Free Statistics

of Irreproducible Research!

Author's title

Author*The author of this computation has been verified*
R Software Modulerwasp_autocorrelation.wasp
Title produced by software(Partial) Autocorrelation Function
Date of computationSat, 13 Dec 2008 08:48:44 -0700
Cite this page as followsStatistical Computations at FreeStatistics.org, Office for Research Development and Education, URL https://freestatistics.org/blog/index.php?v=date/2008/Dec/13/t1229183390wp2v008gfbzy43z.htm/, Retrieved Mon, 27 May 2024 04:03:48 +0000
Statistical Computations at FreeStatistics.org, Office for Research Development and Education, URL https://freestatistics.org/blog/index.php?pk=33160, Retrieved Mon, 27 May 2024 04:03:48 +0000
QR Codes:

Original text written by user:
IsPrivate?No (this computation is public)
User-defined keywords
Estimated Impact168
Family? (F = Feedback message, R = changed R code, M = changed R Module, P = changed Parameters, D = changed Data)
-     [Maximum-likelihood Fitting - Normal Distribution] [Maximum-likelihoo...] [2008-12-10 19:35:16] [82d201ca7b4e7cd2c6f885d29b5b6937]
- RMP   [(Partial) Autocorrelation Function] [P(ACF)] [2008-12-10 20:35:05] [82d201ca7b4e7cd2c6f885d29b5b6937]
-   P       [(Partial) Autocorrelation Function] [ACF] [2008-12-13 15:48:44] [00a0a665d7a07edd2e460056b0c0c354] [Current]
-   P         [(Partial) Autocorrelation Function] [ACF] [2008-12-13 16:05:24] [82d201ca7b4e7cd2c6f885d29b5b6937]
-   PD          [(Partial) Autocorrelation Function] [ACF lambda 1: invoer] [2008-12-14 13:22:30] [82d201ca7b4e7cd2c6f885d29b5b6937]
Feedback Forum

Post a new message
Dataseries X:
11703.7
16283.6
16726.5
14968.9
14861
14583.3
15305.8
17903.9
16379.4
15420.3
17870.5
15912.8
13866.5
17823.2
17872
17420.4
16704.4
15991.2
16583.6
19123.5
17838.7
17209.4
18586.5
16258.1
15141.6
19202.1
17746.5
19090.1
18040.3
17515.5
17751.8
21072.4
17170
19439.5
19795.4
17574.9
16165.4
19464.6
19932.1
19961.2
17343.4
18924.2
18574.1
21350.6
18594.6
19823.1
20844.4
19640.2
17735.4
19813.6
22160
20664.3
17877.4
21211.2
21423.1
21688.7
23243.2
21490.2
22925.8
23184.8
18562.2


Summary of computational transaction
Raw Inputview raw input (R code)
Raw Outputview raw output of R engine
Computing time3 seconds
R Server'Herman Ole Andreas Wold' @ 193.190.124.10:1001

\begin{tabular}{lllllllll}
\hline
Summary of computational transaction \tabularnewline
Raw Input & view raw input (R code)  \tabularnewline
Raw Output & view raw output of R engine  \tabularnewline
Computing time & 3 seconds \tabularnewline
R Server & 'Herman Ole Andreas Wold' @ 193.190.124.10:1001 \tabularnewline
\hline
\end{tabular}
%Source: https://freestatistics.org/blog/index.php?pk=33160&T=0

[TABLE]
[ROW][C]Summary of computational transaction[/C][/ROW]
[ROW][C]Raw Input[/C][C]view raw input (R code) [/C][/ROW]
[ROW][C]Raw Output[/C][C]view raw output of R engine [/C][/ROW]
[ROW][C]Computing time[/C][C]3 seconds[/C][/ROW]
[ROW][C]R Server[/C][C]'Herman Ole Andreas Wold' @ 193.190.124.10:1001[/C][/ROW]
[/TABLE]
Source: https://freestatistics.org/blog/index.php?pk=33160&T=0

Globally Unique Identifier (entire table): ba.freestatistics.org/blog/index.php?pk=33160&T=0

As an alternative you can also use a QR Code:  

The GUIDs for individual cells are displayed in the table below:

Summary of computational transaction
Raw Inputview raw input (R code)
Raw Outputview raw output of R engine
Computing time3 seconds
R Server'Herman Ole Andreas Wold' @ 193.190.124.10:1001


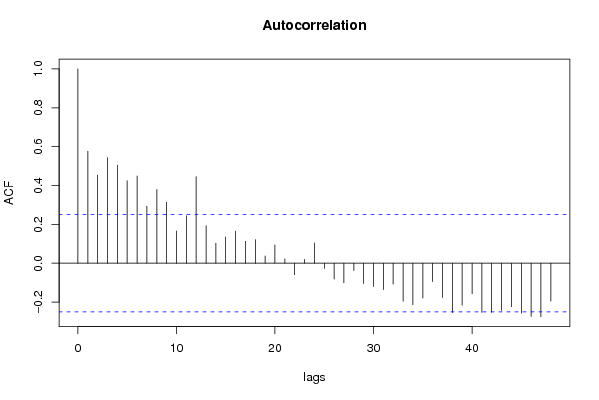
Autocorrelation Function
Time lag kACF(k)T-STATP-value
10.5767894.50491.5e-05
20.4529233.53740.000389
30.5430694.24153.8e-05
40.5045183.94040.000106
50.4247123.31710.000768
60.4494273.51010.000424
70.293712.29390.012626
80.3790822.96070.002184
90.3140342.45270.008527
100.1655441.29290.100454
110.2439361.90520.030735
120.4451993.47710.00047
130.1931111.50820.068327
140.1030160.80460.212094
150.13471.0520.148466
160.1645691.28530.101768
170.1130040.88260.190462
180.1209520.94470.174278
190.0372410.29090.386072
200.0939050.73340.233056
210.0221750.17320.431537
22-0.05922-0.46250.322675
230.0197110.1540.439078
240.1045370.81650.208708
25-0.027015-0.2110.416798
26-0.081402-0.63580.263651
27-0.100924-0.78820.216803
28-0.037683-0.29430.384759
29-0.104297-0.81460.209239
30-0.120141-0.93830.175888
31-0.135984-1.06210.146195
32-0.107212-0.83730.202832
33-0.195284-1.52520.066187
34-0.213614-1.66840.050184
35-0.179015-1.39820.083565
36-0.094823-0.74060.230892
37-0.176958-1.38210.085993
38-0.254158-1.9850.025821
39-0.216203-1.68860.048201
40-0.157572-1.23070.111584
41-0.253784-1.98210.025988
42-0.252458-1.97180.026588
43-0.243022-1.89810.031211
44-0.223792-1.74790.042759
45-0.257499-2.01110.024368
46-0.274009-2.14010.018178
47-0.275154-2.1490.017805
48-0.194855-1.52190.066605

\begin{tabular}{lllllllll}
\hline
Autocorrelation Function \tabularnewline
Time lag k & ACF(k) & T-STAT & P-value \tabularnewline
1 & 0.576789 & 4.5049 & 1.5e-05 \tabularnewline
2 & 0.452923 & 3.5374 & 0.000389 \tabularnewline
3 & 0.543069 & 4.2415 & 3.8e-05 \tabularnewline
4 & 0.504518 & 3.9404 & 0.000106 \tabularnewline
5 & 0.424712 & 3.3171 & 0.000768 \tabularnewline
6 & 0.449427 & 3.5101 & 0.000424 \tabularnewline
7 & 0.29371 & 2.2939 & 0.012626 \tabularnewline
8 & 0.379082 & 2.9607 & 0.002184 \tabularnewline
9 & 0.314034 & 2.4527 & 0.008527 \tabularnewline
10 & 0.165544 & 1.2929 & 0.100454 \tabularnewline
11 & 0.243936 & 1.9052 & 0.030735 \tabularnewline
12 & 0.445199 & 3.4771 & 0.00047 \tabularnewline
13 & 0.193111 & 1.5082 & 0.068327 \tabularnewline
14 & 0.103016 & 0.8046 & 0.212094 \tabularnewline
15 & 0.1347 & 1.052 & 0.148466 \tabularnewline
16 & 0.164569 & 1.2853 & 0.101768 \tabularnewline
17 & 0.113004 & 0.8826 & 0.190462 \tabularnewline
18 & 0.120952 & 0.9447 & 0.174278 \tabularnewline
19 & 0.037241 & 0.2909 & 0.386072 \tabularnewline
20 & 0.093905 & 0.7334 & 0.233056 \tabularnewline
21 & 0.022175 & 0.1732 & 0.431537 \tabularnewline
22 & -0.05922 & -0.4625 & 0.322675 \tabularnewline
23 & 0.019711 & 0.154 & 0.439078 \tabularnewline
24 & 0.104537 & 0.8165 & 0.208708 \tabularnewline
25 & -0.027015 & -0.211 & 0.416798 \tabularnewline
26 & -0.081402 & -0.6358 & 0.263651 \tabularnewline
27 & -0.100924 & -0.7882 & 0.216803 \tabularnewline
28 & -0.037683 & -0.2943 & 0.384759 \tabularnewline
29 & -0.104297 & -0.8146 & 0.209239 \tabularnewline
30 & -0.120141 & -0.9383 & 0.175888 \tabularnewline
31 & -0.135984 & -1.0621 & 0.146195 \tabularnewline
32 & -0.107212 & -0.8373 & 0.202832 \tabularnewline
33 & -0.195284 & -1.5252 & 0.066187 \tabularnewline
34 & -0.213614 & -1.6684 & 0.050184 \tabularnewline
35 & -0.179015 & -1.3982 & 0.083565 \tabularnewline
36 & -0.094823 & -0.7406 & 0.230892 \tabularnewline
37 & -0.176958 & -1.3821 & 0.085993 \tabularnewline
38 & -0.254158 & -1.985 & 0.025821 \tabularnewline
39 & -0.216203 & -1.6886 & 0.048201 \tabularnewline
40 & -0.157572 & -1.2307 & 0.111584 \tabularnewline
41 & -0.253784 & -1.9821 & 0.025988 \tabularnewline
42 & -0.252458 & -1.9718 & 0.026588 \tabularnewline
43 & -0.243022 & -1.8981 & 0.031211 \tabularnewline
44 & -0.223792 & -1.7479 & 0.042759 \tabularnewline
45 & -0.257499 & -2.0111 & 0.024368 \tabularnewline
46 & -0.274009 & -2.1401 & 0.018178 \tabularnewline
47 & -0.275154 & -2.149 & 0.017805 \tabularnewline
48 & -0.194855 & -1.5219 & 0.066605 \tabularnewline
\hline
\end{tabular}
%Source: https://freestatistics.org/blog/index.php?pk=33160&T=1

[TABLE]
[ROW][C]Autocorrelation Function[/C][/ROW]
[ROW][C]Time lag k[/C][C]ACF(k)[/C][C]T-STAT[/C][C]P-value[/C][/ROW]
[ROW][C]1[/C][C]0.576789[/C][C]4.5049[/C][C]1.5e-05[/C][/ROW]
[ROW][C]2[/C][C]0.452923[/C][C]3.5374[/C][C]0.000389[/C][/ROW]
[ROW][C]3[/C][C]0.543069[/C][C]4.2415[/C][C]3.8e-05[/C][/ROW]
[ROW][C]4[/C][C]0.504518[/C][C]3.9404[/C][C]0.000106[/C][/ROW]
[ROW][C]5[/C][C]0.424712[/C][C]3.3171[/C][C]0.000768[/C][/ROW]
[ROW][C]6[/C][C]0.449427[/C][C]3.5101[/C][C]0.000424[/C][/ROW]
[ROW][C]7[/C][C]0.29371[/C][C]2.2939[/C][C]0.012626[/C][/ROW]
[ROW][C]8[/C][C]0.379082[/C][C]2.9607[/C][C]0.002184[/C][/ROW]
[ROW][C]9[/C][C]0.314034[/C][C]2.4527[/C][C]0.008527[/C][/ROW]
[ROW][C]10[/C][C]0.165544[/C][C]1.2929[/C][C]0.100454[/C][/ROW]
[ROW][C]11[/C][C]0.243936[/C][C]1.9052[/C][C]0.030735[/C][/ROW]
[ROW][C]12[/C][C]0.445199[/C][C]3.4771[/C][C]0.00047[/C][/ROW]
[ROW][C]13[/C][C]0.193111[/C][C]1.5082[/C][C]0.068327[/C][/ROW]
[ROW][C]14[/C][C]0.103016[/C][C]0.8046[/C][C]0.212094[/C][/ROW]
[ROW][C]15[/C][C]0.1347[/C][C]1.052[/C][C]0.148466[/C][/ROW]
[ROW][C]16[/C][C]0.164569[/C][C]1.2853[/C][C]0.101768[/C][/ROW]
[ROW][C]17[/C][C]0.113004[/C][C]0.8826[/C][C]0.190462[/C][/ROW]
[ROW][C]18[/C][C]0.120952[/C][C]0.9447[/C][C]0.174278[/C][/ROW]
[ROW][C]19[/C][C]0.037241[/C][C]0.2909[/C][C]0.386072[/C][/ROW]
[ROW][C]20[/C][C]0.093905[/C][C]0.7334[/C][C]0.233056[/C][/ROW]
[ROW][C]21[/C][C]0.022175[/C][C]0.1732[/C][C]0.431537[/C][/ROW]
[ROW][C]22[/C][C]-0.05922[/C][C]-0.4625[/C][C]0.322675[/C][/ROW]
[ROW][C]23[/C][C]0.019711[/C][C]0.154[/C][C]0.439078[/C][/ROW]
[ROW][C]24[/C][C]0.104537[/C][C]0.8165[/C][C]0.208708[/C][/ROW]
[ROW][C]25[/C][C]-0.027015[/C][C]-0.211[/C][C]0.416798[/C][/ROW]
[ROW][C]26[/C][C]-0.081402[/C][C]-0.6358[/C][C]0.263651[/C][/ROW]
[ROW][C]27[/C][C]-0.100924[/C][C]-0.7882[/C][C]0.216803[/C][/ROW]
[ROW][C]28[/C][C]-0.037683[/C][C]-0.2943[/C][C]0.384759[/C][/ROW]
[ROW][C]29[/C][C]-0.104297[/C][C]-0.8146[/C][C]0.209239[/C][/ROW]
[ROW][C]30[/C][C]-0.120141[/C][C]-0.9383[/C][C]0.175888[/C][/ROW]
[ROW][C]31[/C][C]-0.135984[/C][C]-1.0621[/C][C]0.146195[/C][/ROW]
[ROW][C]32[/C][C]-0.107212[/C][C]-0.8373[/C][C]0.202832[/C][/ROW]
[ROW][C]33[/C][C]-0.195284[/C][C]-1.5252[/C][C]0.066187[/C][/ROW]
[ROW][C]34[/C][C]-0.213614[/C][C]-1.6684[/C][C]0.050184[/C][/ROW]
[ROW][C]35[/C][C]-0.179015[/C][C]-1.3982[/C][C]0.083565[/C][/ROW]
[ROW][C]36[/C][C]-0.094823[/C][C]-0.7406[/C][C]0.230892[/C][/ROW]
[ROW][C]37[/C][C]-0.176958[/C][C]-1.3821[/C][C]0.085993[/C][/ROW]
[ROW][C]38[/C][C]-0.254158[/C][C]-1.985[/C][C]0.025821[/C][/ROW]
[ROW][C]39[/C][C]-0.216203[/C][C]-1.6886[/C][C]0.048201[/C][/ROW]
[ROW][C]40[/C][C]-0.157572[/C][C]-1.2307[/C][C]0.111584[/C][/ROW]
[ROW][C]41[/C][C]-0.253784[/C][C]-1.9821[/C][C]0.025988[/C][/ROW]
[ROW][C]42[/C][C]-0.252458[/C][C]-1.9718[/C][C]0.026588[/C][/ROW]
[ROW][C]43[/C][C]-0.243022[/C][C]-1.8981[/C][C]0.031211[/C][/ROW]
[ROW][C]44[/C][C]-0.223792[/C][C]-1.7479[/C][C]0.042759[/C][/ROW]
[ROW][C]45[/C][C]-0.257499[/C][C]-2.0111[/C][C]0.024368[/C][/ROW]
[ROW][C]46[/C][C]-0.274009[/C][C]-2.1401[/C][C]0.018178[/C][/ROW]
[ROW][C]47[/C][C]-0.275154[/C][C]-2.149[/C][C]0.017805[/C][/ROW]
[ROW][C]48[/C][C]-0.194855[/C][C]-1.5219[/C][C]0.066605[/C][/ROW]
[/TABLE]
Source: https://freestatistics.org/blog/index.php?pk=33160&T=1

Globally Unique Identifier (entire table): ba.freestatistics.org/blog/index.php?pk=33160&T=1

As an alternative you can also use a QR Code:  

The GUIDs for individual cells are displayed in the table below:

Autocorrelation Function
Time lag kACF(k)T-STATP-value
10.5767894.50491.5e-05
20.4529233.53740.000389
30.5430694.24153.8e-05
40.5045183.94040.000106
50.4247123.31710.000768
60.4494273.51010.000424
70.293712.29390.012626
80.3790822.96070.002184
90.3140342.45270.008527
100.1655441.29290.100454
110.2439361.90520.030735
120.4451993.47710.00047
130.1931111.50820.068327
140.1030160.80460.212094
150.13471.0520.148466
160.1645691.28530.101768
170.1130040.88260.190462
180.1209520.94470.174278
190.0372410.29090.386072
200.0939050.73340.233056
210.0221750.17320.431537
22-0.05922-0.46250.322675
230.0197110.1540.439078
240.1045370.81650.208708
25-0.027015-0.2110.416798
26-0.081402-0.63580.263651
27-0.100924-0.78820.216803
28-0.037683-0.29430.384759
29-0.104297-0.81460.209239
30-0.120141-0.93830.175888
31-0.135984-1.06210.146195
32-0.107212-0.83730.202832
33-0.195284-1.52520.066187
34-0.213614-1.66840.050184
35-0.179015-1.39820.083565
36-0.094823-0.74060.230892
37-0.176958-1.38210.085993
38-0.254158-1.9850.025821
39-0.216203-1.68860.048201
40-0.157572-1.23070.111584
41-0.253784-1.98210.025988
42-0.252458-1.97180.026588
43-0.243022-1.89810.031211
44-0.223792-1.74790.042759
45-0.257499-2.01110.024368
46-0.274009-2.14010.018178
47-0.275154-2.1490.017805
48-0.194855-1.52190.066605


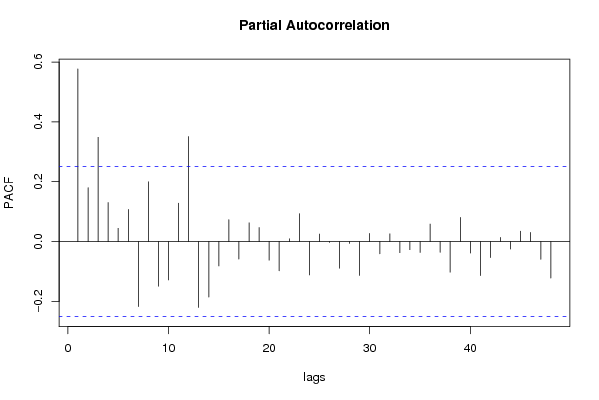
Partial Autocorrelation Function
Time lag kPACF(k)T-STATP-value
10.5767894.50491.5e-05
20.1801811.40730.082213
30.3484432.72140.00423
40.1301981.01690.156614
50.0442820.34590.365321
60.1072640.83780.202719
7-0.217128-1.69580.047509
80.1995371.55840.062152
9-0.149358-1.16650.123972
10-0.128289-1.0020.160158
110.1282951.0020.160147
120.3508362.74010.004022
13-0.220308-1.72070.045191
14-0.185603-1.44960.076145
15-0.081376-0.63560.263719
160.0729580.56980.285447
17-0.058324-0.45550.325176
180.0624220.48750.313814
190.04660.3640.358574
20-0.062191-0.48570.314451
21-0.097847-0.76420.223844
220.0093720.07320.470943
230.0930410.72670.235102
24-0.111621-0.87180.193372
250.024960.19490.423041
26-0.003117-0.02430.490328
27-0.088835-0.69380.245213
28-0.006435-0.05030.480039
29-0.113439-0.8860.189551
300.0269360.21040.417039
31-0.04103-0.32050.374859
320.0258360.20180.420378
33-0.037094-0.28970.386509
34-0.027124-0.21180.416467
35-0.036216-0.28290.389121
360.0586770.45830.32419
37-0.035956-0.28080.389898
38-0.102425-0.80.213418
390.0806750.63010.265494
40-0.03861-0.30160.382008
41-0.113696-0.8880.189016
42-0.053418-0.41720.338997
430.0137290.10720.457481
44-0.025068-0.19580.422713
450.0346910.27090.393673
460.0305070.23830.406236
47-0.059521-0.46490.321838
48-0.12209-0.95350.172037

\begin{tabular}{lllllllll}
\hline
Partial Autocorrelation Function \tabularnewline
Time lag k & PACF(k) & T-STAT & P-value \tabularnewline
1 & 0.576789 & 4.5049 & 1.5e-05 \tabularnewline
2 & 0.180181 & 1.4073 & 0.082213 \tabularnewline
3 & 0.348443 & 2.7214 & 0.00423 \tabularnewline
4 & 0.130198 & 1.0169 & 0.156614 \tabularnewline
5 & 0.044282 & 0.3459 & 0.365321 \tabularnewline
6 & 0.107264 & 0.8378 & 0.202719 \tabularnewline
7 & -0.217128 & -1.6958 & 0.047509 \tabularnewline
8 & 0.199537 & 1.5584 & 0.062152 \tabularnewline
9 & -0.149358 & -1.1665 & 0.123972 \tabularnewline
10 & -0.128289 & -1.002 & 0.160158 \tabularnewline
11 & 0.128295 & 1.002 & 0.160147 \tabularnewline
12 & 0.350836 & 2.7401 & 0.004022 \tabularnewline
13 & -0.220308 & -1.7207 & 0.045191 \tabularnewline
14 & -0.185603 & -1.4496 & 0.076145 \tabularnewline
15 & -0.081376 & -0.6356 & 0.263719 \tabularnewline
16 & 0.072958 & 0.5698 & 0.285447 \tabularnewline
17 & -0.058324 & -0.4555 & 0.325176 \tabularnewline
18 & 0.062422 & 0.4875 & 0.313814 \tabularnewline
19 & 0.0466 & 0.364 & 0.358574 \tabularnewline
20 & -0.062191 & -0.4857 & 0.314451 \tabularnewline
21 & -0.097847 & -0.7642 & 0.223844 \tabularnewline
22 & 0.009372 & 0.0732 & 0.470943 \tabularnewline
23 & 0.093041 & 0.7267 & 0.235102 \tabularnewline
24 & -0.111621 & -0.8718 & 0.193372 \tabularnewline
25 & 0.02496 & 0.1949 & 0.423041 \tabularnewline
26 & -0.003117 & -0.0243 & 0.490328 \tabularnewline
27 & -0.088835 & -0.6938 & 0.245213 \tabularnewline
28 & -0.006435 & -0.0503 & 0.480039 \tabularnewline
29 & -0.113439 & -0.886 & 0.189551 \tabularnewline
30 & 0.026936 & 0.2104 & 0.417039 \tabularnewline
31 & -0.04103 & -0.3205 & 0.374859 \tabularnewline
32 & 0.025836 & 0.2018 & 0.420378 \tabularnewline
33 & -0.037094 & -0.2897 & 0.386509 \tabularnewline
34 & -0.027124 & -0.2118 & 0.416467 \tabularnewline
35 & -0.036216 & -0.2829 & 0.389121 \tabularnewline
36 & 0.058677 & 0.4583 & 0.32419 \tabularnewline
37 & -0.035956 & -0.2808 & 0.389898 \tabularnewline
38 & -0.102425 & -0.8 & 0.213418 \tabularnewline
39 & 0.080675 & 0.6301 & 0.265494 \tabularnewline
40 & -0.03861 & -0.3016 & 0.382008 \tabularnewline
41 & -0.113696 & -0.888 & 0.189016 \tabularnewline
42 & -0.053418 & -0.4172 & 0.338997 \tabularnewline
43 & 0.013729 & 0.1072 & 0.457481 \tabularnewline
44 & -0.025068 & -0.1958 & 0.422713 \tabularnewline
45 & 0.034691 & 0.2709 & 0.393673 \tabularnewline
46 & 0.030507 & 0.2383 & 0.406236 \tabularnewline
47 & -0.059521 & -0.4649 & 0.321838 \tabularnewline
48 & -0.12209 & -0.9535 & 0.172037 \tabularnewline
\hline
\end{tabular}
%Source: https://freestatistics.org/blog/index.php?pk=33160&T=2

[TABLE]
[ROW][C]Partial Autocorrelation Function[/C][/ROW]
[ROW][C]Time lag k[/C][C]PACF(k)[/C][C]T-STAT[/C][C]P-value[/C][/ROW]
[ROW][C]1[/C][C]0.576789[/C][C]4.5049[/C][C]1.5e-05[/C][/ROW]
[ROW][C]2[/C][C]0.180181[/C][C]1.4073[/C][C]0.082213[/C][/ROW]
[ROW][C]3[/C][C]0.348443[/C][C]2.7214[/C][C]0.00423[/C][/ROW]
[ROW][C]4[/C][C]0.130198[/C][C]1.0169[/C][C]0.156614[/C][/ROW]
[ROW][C]5[/C][C]0.044282[/C][C]0.3459[/C][C]0.365321[/C][/ROW]
[ROW][C]6[/C][C]0.107264[/C][C]0.8378[/C][C]0.202719[/C][/ROW]
[ROW][C]7[/C][C]-0.217128[/C][C]-1.6958[/C][C]0.047509[/C][/ROW]
[ROW][C]8[/C][C]0.199537[/C][C]1.5584[/C][C]0.062152[/C][/ROW]
[ROW][C]9[/C][C]-0.149358[/C][C]-1.1665[/C][C]0.123972[/C][/ROW]
[ROW][C]10[/C][C]-0.128289[/C][C]-1.002[/C][C]0.160158[/C][/ROW]
[ROW][C]11[/C][C]0.128295[/C][C]1.002[/C][C]0.160147[/C][/ROW]
[ROW][C]12[/C][C]0.350836[/C][C]2.7401[/C][C]0.004022[/C][/ROW]
[ROW][C]13[/C][C]-0.220308[/C][C]-1.7207[/C][C]0.045191[/C][/ROW]
[ROW][C]14[/C][C]-0.185603[/C][C]-1.4496[/C][C]0.076145[/C][/ROW]
[ROW][C]15[/C][C]-0.081376[/C][C]-0.6356[/C][C]0.263719[/C][/ROW]
[ROW][C]16[/C][C]0.072958[/C][C]0.5698[/C][C]0.285447[/C][/ROW]
[ROW][C]17[/C][C]-0.058324[/C][C]-0.4555[/C][C]0.325176[/C][/ROW]
[ROW][C]18[/C][C]0.062422[/C][C]0.4875[/C][C]0.313814[/C][/ROW]
[ROW][C]19[/C][C]0.0466[/C][C]0.364[/C][C]0.358574[/C][/ROW]
[ROW][C]20[/C][C]-0.062191[/C][C]-0.4857[/C][C]0.314451[/C][/ROW]
[ROW][C]21[/C][C]-0.097847[/C][C]-0.7642[/C][C]0.223844[/C][/ROW]
[ROW][C]22[/C][C]0.009372[/C][C]0.0732[/C][C]0.470943[/C][/ROW]
[ROW][C]23[/C][C]0.093041[/C][C]0.7267[/C][C]0.235102[/C][/ROW]
[ROW][C]24[/C][C]-0.111621[/C][C]-0.8718[/C][C]0.193372[/C][/ROW]
[ROW][C]25[/C][C]0.02496[/C][C]0.1949[/C][C]0.423041[/C][/ROW]
[ROW][C]26[/C][C]-0.003117[/C][C]-0.0243[/C][C]0.490328[/C][/ROW]
[ROW][C]27[/C][C]-0.088835[/C][C]-0.6938[/C][C]0.245213[/C][/ROW]
[ROW][C]28[/C][C]-0.006435[/C][C]-0.0503[/C][C]0.480039[/C][/ROW]
[ROW][C]29[/C][C]-0.113439[/C][C]-0.886[/C][C]0.189551[/C][/ROW]
[ROW][C]30[/C][C]0.026936[/C][C]0.2104[/C][C]0.417039[/C][/ROW]
[ROW][C]31[/C][C]-0.04103[/C][C]-0.3205[/C][C]0.374859[/C][/ROW]
[ROW][C]32[/C][C]0.025836[/C][C]0.2018[/C][C]0.420378[/C][/ROW]
[ROW][C]33[/C][C]-0.037094[/C][C]-0.2897[/C][C]0.386509[/C][/ROW]
[ROW][C]34[/C][C]-0.027124[/C][C]-0.2118[/C][C]0.416467[/C][/ROW]
[ROW][C]35[/C][C]-0.036216[/C][C]-0.2829[/C][C]0.389121[/C][/ROW]
[ROW][C]36[/C][C]0.058677[/C][C]0.4583[/C][C]0.32419[/C][/ROW]
[ROW][C]37[/C][C]-0.035956[/C][C]-0.2808[/C][C]0.389898[/C][/ROW]
[ROW][C]38[/C][C]-0.102425[/C][C]-0.8[/C][C]0.213418[/C][/ROW]
[ROW][C]39[/C][C]0.080675[/C][C]0.6301[/C][C]0.265494[/C][/ROW]
[ROW][C]40[/C][C]-0.03861[/C][C]-0.3016[/C][C]0.382008[/C][/ROW]
[ROW][C]41[/C][C]-0.113696[/C][C]-0.888[/C][C]0.189016[/C][/ROW]
[ROW][C]42[/C][C]-0.053418[/C][C]-0.4172[/C][C]0.338997[/C][/ROW]
[ROW][C]43[/C][C]0.013729[/C][C]0.1072[/C][C]0.457481[/C][/ROW]
[ROW][C]44[/C][C]-0.025068[/C][C]-0.1958[/C][C]0.422713[/C][/ROW]
[ROW][C]45[/C][C]0.034691[/C][C]0.2709[/C][C]0.393673[/C][/ROW]
[ROW][C]46[/C][C]0.030507[/C][C]0.2383[/C][C]0.406236[/C][/ROW]
[ROW][C]47[/C][C]-0.059521[/C][C]-0.4649[/C][C]0.321838[/C][/ROW]
[ROW][C]48[/C][C]-0.12209[/C][C]-0.9535[/C][C]0.172037[/C][/ROW]
[/TABLE]
Source: https://freestatistics.org/blog/index.php?pk=33160&T=2

Globally Unique Identifier (entire table): ba.freestatistics.org/blog/index.php?pk=33160&T=2

As an alternative you can also use a QR Code:  

The GUIDs for individual cells are displayed in the table below:

Partial Autocorrelation Function
Time lag kPACF(k)T-STATP-value
10.5767894.50491.5e-05
20.1801811.40730.082213
30.3484432.72140.00423
40.1301981.01690.156614
50.0442820.34590.365321
60.1072640.83780.202719
7-0.217128-1.69580.047509
80.1995371.55840.062152
9-0.149358-1.16650.123972
10-0.128289-1.0020.160158
110.1282951.0020.160147
120.3508362.74010.004022
13-0.220308-1.72070.045191
14-0.185603-1.44960.076145
15-0.081376-0.63560.263719
160.0729580.56980.285447
17-0.058324-0.45550.325176
180.0624220.48750.313814
190.04660.3640.358574
20-0.062191-0.48570.314451
21-0.097847-0.76420.223844
220.0093720.07320.470943
230.0930410.72670.235102
24-0.111621-0.87180.193372
250.024960.19490.423041
26-0.003117-0.02430.490328
27-0.088835-0.69380.245213
28-0.006435-0.05030.480039
29-0.113439-0.8860.189551
300.0269360.21040.417039
31-0.04103-0.32050.374859
320.0258360.20180.420378
33-0.037094-0.28970.386509
34-0.027124-0.21180.416467
35-0.036216-0.28290.389121
360.0586770.45830.32419
37-0.035956-0.28080.389898
38-0.102425-0.80.213418
390.0806750.63010.265494
40-0.03861-0.30160.382008
41-0.113696-0.8880.189016
42-0.053418-0.41720.338997
430.0137290.10720.457481
44-0.025068-0.19580.422713
450.0346910.27090.393673
460.0305070.23830.406236
47-0.059521-0.46490.321838
48-0.12209-0.95350.172037


Parameters (Session):
par1 = 48 ; par2 = 1 ; par3 = 0 ; par4 = 0 ; par5 = 12 ;
Parameters (R input):
par1 = 48 ; par2 = 1 ; par3 = 0 ; par4 = 0 ; par5 = 12 ;
R code (references can be found in the software module):
if (par1 == 'Default') {
par1 = 10*log10(length(x))
} else {
par1 <- as.numeric(par1)
}
par2 <- as.numeric(par2)
par3 <- as.numeric(par3)
par4 <- as.numeric(par4)
par5 <- as.numeric(par5)
if (par2 == 0) {
x <- log(x)
} else {
x <- (x ^ par2 - 1) / par2
}
if (par3 > 0) x <- diff(x,lag=1,difference=par3)
if (par4 > 0) x <- diff(x,lag=par5,difference=par4)
bitmap(file='pic1.png')
racf <- acf(x,par1,main='Autocorrelation',xlab='lags',ylab='ACF')
dev.off()
bitmap(file='pic2.png')
rpacf <- pacf(x,par1,main='Partial Autocorrelation',xlab='lags',ylab='PACF')
dev.off()
(myacf <- c(racf$acf))
(mypacf <- c(rpacf$acf))
lengthx <- length(x)
sqrtn <- sqrt(lengthx)
load(file='createtable')
a<-table.start()
a<-table.row.start(a)
a<-table.element(a,'Autocorrelation Function',4,TRUE)
a<-table.row.end(a)
a<-table.row.start(a)
a<-table.element(a,'Time lag k',header=TRUE)
a<-table.element(a,hyperlink('basics.htm','ACF(k)','click here for more information about the Autocorrelation Function'),header=TRUE)
a<-table.element(a,'T-STAT',header=TRUE)
a<-table.element(a,'P-value',header=TRUE)
a<-table.row.end(a)
for (i in 2:(par1+1)) {
a<-table.row.start(a)
a<-table.element(a,i-1,header=TRUE)
a<-table.element(a,round(myacf[i],6))
mytstat <- myacf[i]*sqrtn
a<-table.element(a,round(mytstat,4))
a<-table.element(a,round(1-pt(abs(mytstat),lengthx),6))
a<-table.row.end(a)
}
a<-table.end(a)
table.save(a,file='mytable.tab')
a<-table.start()
a<-table.row.start(a)
a<-table.element(a,'Partial Autocorrelation Function',4,TRUE)
a<-table.row.end(a)
a<-table.row.start(a)
a<-table.element(a,'Time lag k',header=TRUE)
a<-table.element(a,hyperlink('basics.htm','PACF(k)','click here for more information about the Partial Autocorrelation Function'),header=TRUE)
a<-table.element(a,'T-STAT',header=TRUE)
a<-table.element(a,'P-value',header=TRUE)
a<-table.row.end(a)
for (i in 1:par1) {
a<-table.row.start(a)
a<-table.element(a,i,header=TRUE)
a<-table.element(a,round(mypacf[i],6))
mytstat <- mypacf[i]*sqrtn
a<-table.element(a,round(mytstat,4))
a<-table.element(a,round(1-pt(abs(mytstat),lengthx),6))
a<-table.row.end(a)
}
a<-table.end(a)
table.save(a,file='mytable1.tab')