Free Statistics

of Irreproducible Research!

Author's title

Author*The author of this computation has been verified*
R Software Modulerwasp_autocorrelation.wasp
Title produced by software(Partial) Autocorrelation Function
Date of computationSat, 13 Dec 2008 05:13:54 -0700
Cite this page as followsStatistical Computations at FreeStatistics.org, Office for Research Development and Education, URL https://freestatistics.org/blog/index.php?v=date/2008/Dec/13/t122917048934or5k3vy1l1bik.htm/, Retrieved Sun, 19 May 2024 05:58:09 +0000
Statistical Computations at FreeStatistics.org, Office for Research Development and Education, URL https://freestatistics.org/blog/index.php?pk=32999, Retrieved Sun, 19 May 2024 05:58:09 +0000
QR Codes:

Original text written by user:
IsPrivate?No (this computation is public)
User-defined keywordsjenske_cole@hotmail.com
Estimated Impact182
Family? (F = Feedback message, R = changed R code, M = changed R Module, P = changed Parameters, D = changed Data)
F     [Bivariate Kernel Density Estimation] [Various EDA Topic...] [2008-11-12 13:37:39] [8094ad203a218aaca2d1cea2c78c2d6e]
F    D  [Bivariate Kernel Density Estimation] [opdracht3 blok8 q...] [2008-11-12 17:51:49] [975daa21de49eaf4d491226310243f5a]
- RMPD      [(Partial) Autocorrelation Function] [paper autocorrela...] [2008-12-13 12:13:54] [120dfa2440e51a0cfc0f5296bc5d7460] [Current]
Feedback Forum

Post a new message
Dataseries X:
7.6
7.4
7.3
7.1
6.9
6.8
7.5
7.6
7.8
8
8.1
8.2
8.3
8.2
8
7.9
7.6
7.6
8.2
8.3
8.4
8.4
8.4
8.6
8.9
8.8
8.3
7.5
7.2
7.5
8.8
9.3
9.3
8.7
8.2
8.3
8.5
8.6
8.6
8.2
8.1
8
8.6
8.7
8.8
8.5
8.4
8.5
8.7
8.7
8.6
8.5
8.3
8.1
8.2
8.1
8.1
7.9
7.9
7.9
8
8
7.9
8
7.7
7.2
7.5
7.3
7
7
7
7.2
7.3
7.1
6.8
6.6
6.2
6.2
6.8
6.9
6.8
6.7


Summary of computational transaction
Raw Inputview raw input (R code)
Raw Outputview raw output of R engine
Computing time2 seconds
R Server'Sir Ronald Aylmer Fisher' @ 193.190.124.24

\begin{tabular}{lllllllll}
\hline
Summary of computational transaction \tabularnewline
Raw Input & view raw input (R code)  \tabularnewline
Raw Output & view raw output of R engine  \tabularnewline
Computing time & 2 seconds \tabularnewline
R Server & 'Sir Ronald Aylmer Fisher' @ 193.190.124.24 \tabularnewline
\hline
\end{tabular}
%Source: https://freestatistics.org/blog/index.php?pk=32999&T=0

[TABLE]
[ROW][C]Summary of computational transaction[/C][/ROW]
[ROW][C]Raw Input[/C][C]view raw input (R code) [/C][/ROW]
[ROW][C]Raw Output[/C][C]view raw output of R engine [/C][/ROW]
[ROW][C]Computing time[/C][C]2 seconds[/C][/ROW]
[ROW][C]R Server[/C][C]'Sir Ronald Aylmer Fisher' @ 193.190.124.24[/C][/ROW]
[/TABLE]
Source: https://freestatistics.org/blog/index.php?pk=32999&T=0

Globally Unique Identifier (entire table): ba.freestatistics.org/blog/index.php?pk=32999&T=0

As an alternative you can also use a QR Code:  

The GUIDs for individual cells are displayed in the table below:

Summary of computational transaction
Raw Inputview raw input (R code)
Raw Outputview raw output of R engine
Computing time2 seconds
R Server'Sir Ronald Aylmer Fisher' @ 193.190.124.24


Autocorrelation Function
Time lag kACF(k)T-STATP-value
10.8889028.04940
20.7133476.45960
30.5702895.16421e-06
40.5104664.62257e-06
50.5020534.54639e-06
60.4949334.48181.2e-05
70.4471344.0495.8e-05
80.3747983.39390.000532
90.332023.00660.001753
100.3457883.13120.001206
110.3844963.48180.000401
120.3877173.51090.000364
130.2913962.63870.004979
140.1653831.49760.069038
150.0662910.60030.274983
160.0235960.21370.415668
170.0055390.05020.48006
180.0019250.01740.493069
19-0.023155-0.20970.417219

\begin{tabular}{lllllllll}
\hline
Autocorrelation Function \tabularnewline
Time lag k & ACF(k) & T-STAT & P-value \tabularnewline
1 & 0.888902 & 8.0494 & 0 \tabularnewline
2 & 0.713347 & 6.4596 & 0 \tabularnewline
3 & 0.570289 & 5.1642 & 1e-06 \tabularnewline
4 & 0.510466 & 4.6225 & 7e-06 \tabularnewline
5 & 0.502053 & 4.5463 & 9e-06 \tabularnewline
6 & 0.494933 & 4.4818 & 1.2e-05 \tabularnewline
7 & 0.447134 & 4.049 & 5.8e-05 \tabularnewline
8 & 0.374798 & 3.3939 & 0.000532 \tabularnewline
9 & 0.33202 & 3.0066 & 0.001753 \tabularnewline
10 & 0.345788 & 3.1312 & 0.001206 \tabularnewline
11 & 0.384496 & 3.4818 & 0.000401 \tabularnewline
12 & 0.387717 & 3.5109 & 0.000364 \tabularnewline
13 & 0.291396 & 2.6387 & 0.004979 \tabularnewline
14 & 0.165383 & 1.4976 & 0.069038 \tabularnewline
15 & 0.066291 & 0.6003 & 0.274983 \tabularnewline
16 & 0.023596 & 0.2137 & 0.415668 \tabularnewline
17 & 0.005539 & 0.0502 & 0.48006 \tabularnewline
18 & 0.001925 & 0.0174 & 0.493069 \tabularnewline
19 & -0.023155 & -0.2097 & 0.417219 \tabularnewline
\hline
\end{tabular}
%Source: https://freestatistics.org/blog/index.php?pk=32999&T=1

[TABLE]
[ROW][C]Autocorrelation Function[/C][/ROW]
[ROW][C]Time lag k[/C][C]ACF(k)[/C][C]T-STAT[/C][C]P-value[/C][/ROW]
[ROW][C]1[/C][C]0.888902[/C][C]8.0494[/C][C]0[/C][/ROW]
[ROW][C]2[/C][C]0.713347[/C][C]6.4596[/C][C]0[/C][/ROW]
[ROW][C]3[/C][C]0.570289[/C][C]5.1642[/C][C]1e-06[/C][/ROW]
[ROW][C]4[/C][C]0.510466[/C][C]4.6225[/C][C]7e-06[/C][/ROW]
[ROW][C]5[/C][C]0.502053[/C][C]4.5463[/C][C]9e-06[/C][/ROW]
[ROW][C]6[/C][C]0.494933[/C][C]4.4818[/C][C]1.2e-05[/C][/ROW]
[ROW][C]7[/C][C]0.447134[/C][C]4.049[/C][C]5.8e-05[/C][/ROW]
[ROW][C]8[/C][C]0.374798[/C][C]3.3939[/C][C]0.000532[/C][/ROW]
[ROW][C]9[/C][C]0.33202[/C][C]3.0066[/C][C]0.001753[/C][/ROW]
[ROW][C]10[/C][C]0.345788[/C][C]3.1312[/C][C]0.001206[/C][/ROW]
[ROW][C]11[/C][C]0.384496[/C][C]3.4818[/C][C]0.000401[/C][/ROW]
[ROW][C]12[/C][C]0.387717[/C][C]3.5109[/C][C]0.000364[/C][/ROW]
[ROW][C]13[/C][C]0.291396[/C][C]2.6387[/C][C]0.004979[/C][/ROW]
[ROW][C]14[/C][C]0.165383[/C][C]1.4976[/C][C]0.069038[/C][/ROW]
[ROW][C]15[/C][C]0.066291[/C][C]0.6003[/C][C]0.274983[/C][/ROW]
[ROW][C]16[/C][C]0.023596[/C][C]0.2137[/C][C]0.415668[/C][/ROW]
[ROW][C]17[/C][C]0.005539[/C][C]0.0502[/C][C]0.48006[/C][/ROW]
[ROW][C]18[/C][C]0.001925[/C][C]0.0174[/C][C]0.493069[/C][/ROW]
[ROW][C]19[/C][C]-0.023155[/C][C]-0.2097[/C][C]0.417219[/C][/ROW]
[/TABLE]
Source: https://freestatistics.org/blog/index.php?pk=32999&T=1

Globally Unique Identifier (entire table): ba.freestatistics.org/blog/index.php?pk=32999&T=1

As an alternative you can also use a QR Code:  

The GUIDs for individual cells are displayed in the table below:

Autocorrelation Function
Time lag kACF(k)T-STATP-value
10.8889028.04940
20.7133476.45960
30.5702895.16421e-06
40.5104664.62257e-06
50.5020534.54639e-06
60.4949334.48181.2e-05
70.4471344.0495.8e-05
80.3747983.39390.000532
90.332023.00660.001753
100.3457883.13120.001206
110.3844963.48180.000401
120.3877173.51090.000364
130.2913962.63870.004979
140.1653831.49760.069038
150.0662910.60030.274983
160.0235960.21370.415668
170.0055390.05020.48006
180.0019250.01740.493069
19-0.023155-0.20970.417219


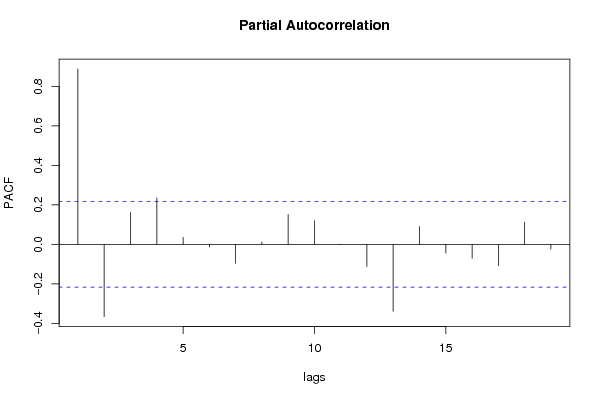
Partial Autocorrelation Function
Time lag kPACF(k)T-STATP-value
10.8889028.04940
2-0.365972-3.3140.000685
30.1620151.46710.073086
40.2349362.12740.018194
50.0354510.3210.374504
6-0.013208-0.11960.452543
7-0.095028-0.86050.196007
80.0123880.11220.455478
90.1510141.36750.087604
100.1204031.09030.139389
11-0.001679-0.01520.493955
12-0.112397-1.01780.155884
13-0.338294-3.06340.00148
140.0903350.8180.207857
15-0.043241-0.39160.348198
16-0.070173-0.63540.263453
17-0.10762-0.97450.166328
180.1121741.01580.15636
19-0.023474-0.21260.416095

\begin{tabular}{lllllllll}
\hline
Partial Autocorrelation Function \tabularnewline
Time lag k & PACF(k) & T-STAT & P-value \tabularnewline
1 & 0.888902 & 8.0494 & 0 \tabularnewline
2 & -0.365972 & -3.314 & 0.000685 \tabularnewline
3 & 0.162015 & 1.4671 & 0.073086 \tabularnewline
4 & 0.234936 & 2.1274 & 0.018194 \tabularnewline
5 & 0.035451 & 0.321 & 0.374504 \tabularnewline
6 & -0.013208 & -0.1196 & 0.452543 \tabularnewline
7 & -0.095028 & -0.8605 & 0.196007 \tabularnewline
8 & 0.012388 & 0.1122 & 0.455478 \tabularnewline
9 & 0.151014 & 1.3675 & 0.087604 \tabularnewline
10 & 0.120403 & 1.0903 & 0.139389 \tabularnewline
11 & -0.001679 & -0.0152 & 0.493955 \tabularnewline
12 & -0.112397 & -1.0178 & 0.155884 \tabularnewline
13 & -0.338294 & -3.0634 & 0.00148 \tabularnewline
14 & 0.090335 & 0.818 & 0.207857 \tabularnewline
15 & -0.043241 & -0.3916 & 0.348198 \tabularnewline
16 & -0.070173 & -0.6354 & 0.263453 \tabularnewline
17 & -0.10762 & -0.9745 & 0.166328 \tabularnewline
18 & 0.112174 & 1.0158 & 0.15636 \tabularnewline
19 & -0.023474 & -0.2126 & 0.416095 \tabularnewline
\hline
\end{tabular}
%Source: https://freestatistics.org/blog/index.php?pk=32999&T=2

[TABLE]
[ROW][C]Partial Autocorrelation Function[/C][/ROW]
[ROW][C]Time lag k[/C][C]PACF(k)[/C][C]T-STAT[/C][C]P-value[/C][/ROW]
[ROW][C]1[/C][C]0.888902[/C][C]8.0494[/C][C]0[/C][/ROW]
[ROW][C]2[/C][C]-0.365972[/C][C]-3.314[/C][C]0.000685[/C][/ROW]
[ROW][C]3[/C][C]0.162015[/C][C]1.4671[/C][C]0.073086[/C][/ROW]
[ROW][C]4[/C][C]0.234936[/C][C]2.1274[/C][C]0.018194[/C][/ROW]
[ROW][C]5[/C][C]0.035451[/C][C]0.321[/C][C]0.374504[/C][/ROW]
[ROW][C]6[/C][C]-0.013208[/C][C]-0.1196[/C][C]0.452543[/C][/ROW]
[ROW][C]7[/C][C]-0.095028[/C][C]-0.8605[/C][C]0.196007[/C][/ROW]
[ROW][C]8[/C][C]0.012388[/C][C]0.1122[/C][C]0.455478[/C][/ROW]
[ROW][C]9[/C][C]0.151014[/C][C]1.3675[/C][C]0.087604[/C][/ROW]
[ROW][C]10[/C][C]0.120403[/C][C]1.0903[/C][C]0.139389[/C][/ROW]
[ROW][C]11[/C][C]-0.001679[/C][C]-0.0152[/C][C]0.493955[/C][/ROW]
[ROW][C]12[/C][C]-0.112397[/C][C]-1.0178[/C][C]0.155884[/C][/ROW]
[ROW][C]13[/C][C]-0.338294[/C][C]-3.0634[/C][C]0.00148[/C][/ROW]
[ROW][C]14[/C][C]0.090335[/C][C]0.818[/C][C]0.207857[/C][/ROW]
[ROW][C]15[/C][C]-0.043241[/C][C]-0.3916[/C][C]0.348198[/C][/ROW]
[ROW][C]16[/C][C]-0.070173[/C][C]-0.6354[/C][C]0.263453[/C][/ROW]
[ROW][C]17[/C][C]-0.10762[/C][C]-0.9745[/C][C]0.166328[/C][/ROW]
[ROW][C]18[/C][C]0.112174[/C][C]1.0158[/C][C]0.15636[/C][/ROW]
[ROW][C]19[/C][C]-0.023474[/C][C]-0.2126[/C][C]0.416095[/C][/ROW]
[/TABLE]
Source: https://freestatistics.org/blog/index.php?pk=32999&T=2

Globally Unique Identifier (entire table): ba.freestatistics.org/blog/index.php?pk=32999&T=2

As an alternative you can also use a QR Code:  

The GUIDs for individual cells are displayed in the table below:

Partial Autocorrelation Function
Time lag kPACF(k)T-STATP-value
10.8889028.04940
2-0.365972-3.3140.000685
30.1620151.46710.073086
40.2349362.12740.018194
50.0354510.3210.374504
6-0.013208-0.11960.452543
7-0.095028-0.86050.196007
80.0123880.11220.455478
90.1510141.36750.087604
100.1204031.09030.139389
11-0.001679-0.01520.493955
12-0.112397-1.01780.155884
13-0.338294-3.06340.00148
140.0903350.8180.207857
15-0.043241-0.39160.348198
16-0.070173-0.63540.263453
17-0.10762-0.97450.166328
180.1121741.01580.15636
19-0.023474-0.21260.416095


Parameters (Session):
par1 = 4 ;
Parameters (R input):
par1 = Default ; par2 = 1 ; par3 = 0 ; par4 = 0 ; par5 = 12 ;
R code (references can be found in the software module):
if (par1 == 'Default') {
par1 = 10*log10(length(x))
} else {
par1 <- as.numeric(par1)
}
par2 <- as.numeric(par2)
par3 <- as.numeric(par3)
par4 <- as.numeric(par4)
par5 <- as.numeric(par5)
if (par2 == 0) {
x <- log(x)
} else {
x <- (x ^ par2 - 1) / par2
}
if (par3 > 0) x <- diff(x,lag=1,difference=par3)
if (par4 > 0) x <- diff(x,lag=par5,difference=par4)
bitmap(file='pic1.png')
racf <- acf(x,par1,main='Autocorrelation',xlab='lags',ylab='ACF')
dev.off()
bitmap(file='pic2.png')
rpacf <- pacf(x,par1,main='Partial Autocorrelation',xlab='lags',ylab='PACF')
dev.off()
(myacf <- c(racf$acf))
(mypacf <- c(rpacf$acf))
lengthx <- length(x)
sqrtn <- sqrt(lengthx)
load(file='createtable')
a<-table.start()
a<-table.row.start(a)
a<-table.element(a,'Autocorrelation Function',4,TRUE)
a<-table.row.end(a)
a<-table.row.start(a)
a<-table.element(a,'Time lag k',header=TRUE)
a<-table.element(a,hyperlink('basics.htm','ACF(k)','click here for more information about the Autocorrelation Function'),header=TRUE)
a<-table.element(a,'T-STAT',header=TRUE)
a<-table.element(a,'P-value',header=TRUE)
a<-table.row.end(a)
for (i in 2:(par1+1)) {
a<-table.row.start(a)
a<-table.element(a,i-1,header=TRUE)
a<-table.element(a,round(myacf[i],6))
mytstat <- myacf[i]*sqrtn
a<-table.element(a,round(mytstat,4))
a<-table.element(a,round(1-pt(abs(mytstat),lengthx),6))
a<-table.row.end(a)
}
a<-table.end(a)
table.save(a,file='mytable.tab')
a<-table.start()
a<-table.row.start(a)
a<-table.element(a,'Partial Autocorrelation Function',4,TRUE)
a<-table.row.end(a)
a<-table.row.start(a)
a<-table.element(a,'Time lag k',header=TRUE)
a<-table.element(a,hyperlink('basics.htm','PACF(k)','click here for more information about the Partial Autocorrelation Function'),header=TRUE)
a<-table.element(a,'T-STAT',header=TRUE)
a<-table.element(a,'P-value',header=TRUE)
a<-table.row.end(a)
for (i in 1:par1) {
a<-table.row.start(a)
a<-table.element(a,i,header=TRUE)
a<-table.element(a,round(mypacf[i],6))
mytstat <- mypacf[i]*sqrtn
a<-table.element(a,round(mytstat,4))
a<-table.element(a,round(1-pt(abs(mytstat),lengthx),6))
a<-table.row.end(a)
}
a<-table.end(a)
table.save(a,file='mytable1.tab')