Free Statistics

of Irreproducible Research!

Author's title

Author*Unverified author*
R Software Modulerwasp_autocorrelation.wasp
Title produced by software(Partial) Autocorrelation Function
Date of computationSat, 13 Dec 2008 03:18:43 -0700
Cite this page as followsStatistical Computations at FreeStatistics.org, Office for Research Development and Education, URL https://freestatistics.org/blog/index.php?v=date/2008/Dec/13/t1229163555h5brpj9xn97y0b4.htm/, Retrieved Sun, 19 May 2024 07:17:18 +0000
Statistical Computations at FreeStatistics.org, Office for Research Development and Education, URL https://freestatistics.org/blog/index.php?pk=32937, Retrieved Sun, 19 May 2024 07:17:18 +0000
QR Codes:

Original text written by user:
IsPrivate?No (this computation is public)
User-defined keywords
Estimated Impact214
Family? (F = Feedback message, R = changed R code, M = changed R Module, P = changed Parameters, D = changed Data)
-     [Univariate Data Series] [data set] [2008-12-01 19:54:57] [b98453cac15ba1066b407e146608df68]
- RMPD    [(Partial) Autocorrelation Function] [Duurzame consumpt...] [2008-12-13 10:18:43] [d41d8cd98f00b204e9800998ecf8427e] [Current]
Feedback Forum

Post a new message
Dataseries X:
98.1
101.1
111.1
93.3
100
108
70.4
75.4
105.5
112.3
102.5
93.5
86.7
95.2
103.8
97
95.5
101
67.5
64
106.7
100.6
101.2
93.1
84.2
85.8
91.8
92.4
80.3
79.7
62.5
57.1
100.8
100.7
86.2
83.2
71.7
77.5
89.8
80.3
78.7
93.8
57.6
60.6
91
85.3
77.4
77.3
68.3
69.9
81.7
75.1
69.9
84
54.3
60
89.9
77
85.3
77.6
69.2
75.5
85.7
72.2
79.9
85.3
52.2
61.2
82.4
85.4
78.2
70.2
70.2
69.3
77.5
66.1
69
79.2
56.2
63.3
77.8
92
78.1
65.1
71.1
70.9
72
81.9
70.6
72.5
65.1
54.9
80


Summary of computational transaction
Raw Inputview raw input (R code)
Raw Outputview raw output of R engine
Computing time0 seconds
R Server'George Udny Yule' @ 72.249.76.132

\begin{tabular}{lllllllll}
\hline
Summary of computational transaction \tabularnewline
Raw Input & view raw input (R code)  \tabularnewline
Raw Output & view raw output of R engine  \tabularnewline
Computing time & 0 seconds \tabularnewline
R Server & 'George Udny Yule' @ 72.249.76.132 \tabularnewline
\hline
\end{tabular}
%Source: https://freestatistics.org/blog/index.php?pk=32937&T=0

[TABLE]
[ROW][C]Summary of computational transaction[/C][/ROW]
[ROW][C]Raw Input[/C][C]view raw input (R code) [/C][/ROW]
[ROW][C]Raw Output[/C][C]view raw output of R engine [/C][/ROW]
[ROW][C]Computing time[/C][C]0 seconds[/C][/ROW]
[ROW][C]R Server[/C][C]'George Udny Yule' @ 72.249.76.132[/C][/ROW]
[/TABLE]
Source: https://freestatistics.org/blog/index.php?pk=32937&T=0

Globally Unique Identifier (entire table): ba.freestatistics.org/blog/index.php?pk=32937&T=0

As an alternative you can also use a QR Code:  

The GUIDs for individual cells are displayed in the table below:

Summary of computational transaction
Raw Inputview raw input (R code)
Raw Outputview raw output of R engine
Computing time0 seconds
R Server'George Udny Yule' @ 72.249.76.132


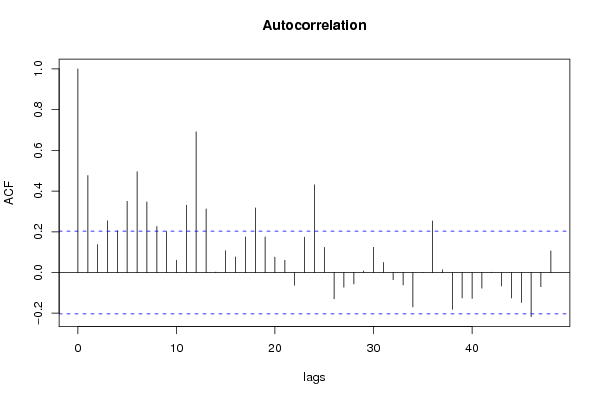
Autocorrelation Function
Time lag kACF(k)T-STATP-value
10.4764034.59437e-06
20.1372761.32380.0944
30.2537622.44720.008138
40.2047141.97420.025663
50.3496153.37160.000545
60.495024.77383e-06
70.3464773.34130.000601
80.2264252.18360.015755
90.2016651.94480.027411
100.0603460.5820.281004
110.3306793.1890.000973
120.6914286.66790
130.3122153.01090.001677
140.0024010.02310.49079
150.1069711.03160.15247
160.0763620.73640.231669
170.175021.68780.047397
180.3173583.06050.001444
190.1746351.68410.047756
200.0755940.7290.233916
210.0606710.58510.279951
22-0.062019-0.59810.275617
230.1732651.67090.049051
240.4311444.15783.6e-05
250.1234881.19090.118367
26-0.128949-1.24350.108397
27-0.072272-0.6970.24378
28-0.056409-0.5440.293874
290.0078120.07530.470055
300.1236131.19210.118131
310.0494240.47660.317372
32-0.035166-0.33910.367639
33-0.061097-0.58920.278579
34-0.169187-1.63160.053075
35-0.000987-0.00950.496212
360.2533572.44330.008221
370.0133450.12870.448937
38-0.180735-1.74290.042324
39-0.124795-1.20350.115922
40-0.127332-1.22790.111283
41-0.077224-0.74470.229159
420.0013390.01290.494862
43-0.065949-0.6360.263172
44-0.125114-1.20660.115332
45-0.147781-1.42520.07873
46-0.216842-2.09110.019621
47-0.069646-0.67160.251737
480.106281.02490.154029

\begin{tabular}{lllllllll}
\hline
Autocorrelation Function \tabularnewline
Time lag k & ACF(k) & T-STAT & P-value \tabularnewline
1 & 0.476403 & 4.5943 & 7e-06 \tabularnewline
2 & 0.137276 & 1.3238 & 0.0944 \tabularnewline
3 & 0.253762 & 2.4472 & 0.008138 \tabularnewline
4 & 0.204714 & 1.9742 & 0.025663 \tabularnewline
5 & 0.349615 & 3.3716 & 0.000545 \tabularnewline
6 & 0.49502 & 4.7738 & 3e-06 \tabularnewline
7 & 0.346477 & 3.3413 & 0.000601 \tabularnewline
8 & 0.226425 & 2.1836 & 0.015755 \tabularnewline
9 & 0.201665 & 1.9448 & 0.027411 \tabularnewline
10 & 0.060346 & 0.582 & 0.281004 \tabularnewline
11 & 0.330679 & 3.189 & 0.000973 \tabularnewline
12 & 0.691428 & 6.6679 & 0 \tabularnewline
13 & 0.312215 & 3.0109 & 0.001677 \tabularnewline
14 & 0.002401 & 0.0231 & 0.49079 \tabularnewline
15 & 0.106971 & 1.0316 & 0.15247 \tabularnewline
16 & 0.076362 & 0.7364 & 0.231669 \tabularnewline
17 & 0.17502 & 1.6878 & 0.047397 \tabularnewline
18 & 0.317358 & 3.0605 & 0.001444 \tabularnewline
19 & 0.174635 & 1.6841 & 0.047756 \tabularnewline
20 & 0.075594 & 0.729 & 0.233916 \tabularnewline
21 & 0.060671 & 0.5851 & 0.279951 \tabularnewline
22 & -0.062019 & -0.5981 & 0.275617 \tabularnewline
23 & 0.173265 & 1.6709 & 0.049051 \tabularnewline
24 & 0.431144 & 4.1578 & 3.6e-05 \tabularnewline
25 & 0.123488 & 1.1909 & 0.118367 \tabularnewline
26 & -0.128949 & -1.2435 & 0.108397 \tabularnewline
27 & -0.072272 & -0.697 & 0.24378 \tabularnewline
28 & -0.056409 & -0.544 & 0.293874 \tabularnewline
29 & 0.007812 & 0.0753 & 0.470055 \tabularnewline
30 & 0.123613 & 1.1921 & 0.118131 \tabularnewline
31 & 0.049424 & 0.4766 & 0.317372 \tabularnewline
32 & -0.035166 & -0.3391 & 0.367639 \tabularnewline
33 & -0.061097 & -0.5892 & 0.278579 \tabularnewline
34 & -0.169187 & -1.6316 & 0.053075 \tabularnewline
35 & -0.000987 & -0.0095 & 0.496212 \tabularnewline
36 & 0.253357 & 2.4433 & 0.008221 \tabularnewline
37 & 0.013345 & 0.1287 & 0.448937 \tabularnewline
38 & -0.180735 & -1.7429 & 0.042324 \tabularnewline
39 & -0.124795 & -1.2035 & 0.115922 \tabularnewline
40 & -0.127332 & -1.2279 & 0.111283 \tabularnewline
41 & -0.077224 & -0.7447 & 0.229159 \tabularnewline
42 & 0.001339 & 0.0129 & 0.494862 \tabularnewline
43 & -0.065949 & -0.636 & 0.263172 \tabularnewline
44 & -0.125114 & -1.2066 & 0.115332 \tabularnewline
45 & -0.147781 & -1.4252 & 0.07873 \tabularnewline
46 & -0.216842 & -2.0911 & 0.019621 \tabularnewline
47 & -0.069646 & -0.6716 & 0.251737 \tabularnewline
48 & 0.10628 & 1.0249 & 0.154029 \tabularnewline
\hline
\end{tabular}
%Source: https://freestatistics.org/blog/index.php?pk=32937&T=1

[TABLE]
[ROW][C]Autocorrelation Function[/C][/ROW]
[ROW][C]Time lag k[/C][C]ACF(k)[/C][C]T-STAT[/C][C]P-value[/C][/ROW]
[ROW][C]1[/C][C]0.476403[/C][C]4.5943[/C][C]7e-06[/C][/ROW]
[ROW][C]2[/C][C]0.137276[/C][C]1.3238[/C][C]0.0944[/C][/ROW]
[ROW][C]3[/C][C]0.253762[/C][C]2.4472[/C][C]0.008138[/C][/ROW]
[ROW][C]4[/C][C]0.204714[/C][C]1.9742[/C][C]0.025663[/C][/ROW]
[ROW][C]5[/C][C]0.349615[/C][C]3.3716[/C][C]0.000545[/C][/ROW]
[ROW][C]6[/C][C]0.49502[/C][C]4.7738[/C][C]3e-06[/C][/ROW]
[ROW][C]7[/C][C]0.346477[/C][C]3.3413[/C][C]0.000601[/C][/ROW]
[ROW][C]8[/C][C]0.226425[/C][C]2.1836[/C][C]0.015755[/C][/ROW]
[ROW][C]9[/C][C]0.201665[/C][C]1.9448[/C][C]0.027411[/C][/ROW]
[ROW][C]10[/C][C]0.060346[/C][C]0.582[/C][C]0.281004[/C][/ROW]
[ROW][C]11[/C][C]0.330679[/C][C]3.189[/C][C]0.000973[/C][/ROW]
[ROW][C]12[/C][C]0.691428[/C][C]6.6679[/C][C]0[/C][/ROW]
[ROW][C]13[/C][C]0.312215[/C][C]3.0109[/C][C]0.001677[/C][/ROW]
[ROW][C]14[/C][C]0.002401[/C][C]0.0231[/C][C]0.49079[/C][/ROW]
[ROW][C]15[/C][C]0.106971[/C][C]1.0316[/C][C]0.15247[/C][/ROW]
[ROW][C]16[/C][C]0.076362[/C][C]0.7364[/C][C]0.231669[/C][/ROW]
[ROW][C]17[/C][C]0.17502[/C][C]1.6878[/C][C]0.047397[/C][/ROW]
[ROW][C]18[/C][C]0.317358[/C][C]3.0605[/C][C]0.001444[/C][/ROW]
[ROW][C]19[/C][C]0.174635[/C][C]1.6841[/C][C]0.047756[/C][/ROW]
[ROW][C]20[/C][C]0.075594[/C][C]0.729[/C][C]0.233916[/C][/ROW]
[ROW][C]21[/C][C]0.060671[/C][C]0.5851[/C][C]0.279951[/C][/ROW]
[ROW][C]22[/C][C]-0.062019[/C][C]-0.5981[/C][C]0.275617[/C][/ROW]
[ROW][C]23[/C][C]0.173265[/C][C]1.6709[/C][C]0.049051[/C][/ROW]
[ROW][C]24[/C][C]0.431144[/C][C]4.1578[/C][C]3.6e-05[/C][/ROW]
[ROW][C]25[/C][C]0.123488[/C][C]1.1909[/C][C]0.118367[/C][/ROW]
[ROW][C]26[/C][C]-0.128949[/C][C]-1.2435[/C][C]0.108397[/C][/ROW]
[ROW][C]27[/C][C]-0.072272[/C][C]-0.697[/C][C]0.24378[/C][/ROW]
[ROW][C]28[/C][C]-0.056409[/C][C]-0.544[/C][C]0.293874[/C][/ROW]
[ROW][C]29[/C][C]0.007812[/C][C]0.0753[/C][C]0.470055[/C][/ROW]
[ROW][C]30[/C][C]0.123613[/C][C]1.1921[/C][C]0.118131[/C][/ROW]
[ROW][C]31[/C][C]0.049424[/C][C]0.4766[/C][C]0.317372[/C][/ROW]
[ROW][C]32[/C][C]-0.035166[/C][C]-0.3391[/C][C]0.367639[/C][/ROW]
[ROW][C]33[/C][C]-0.061097[/C][C]-0.5892[/C][C]0.278579[/C][/ROW]
[ROW][C]34[/C][C]-0.169187[/C][C]-1.6316[/C][C]0.053075[/C][/ROW]
[ROW][C]35[/C][C]-0.000987[/C][C]-0.0095[/C][C]0.496212[/C][/ROW]
[ROW][C]36[/C][C]0.253357[/C][C]2.4433[/C][C]0.008221[/C][/ROW]
[ROW][C]37[/C][C]0.013345[/C][C]0.1287[/C][C]0.448937[/C][/ROW]
[ROW][C]38[/C][C]-0.180735[/C][C]-1.7429[/C][C]0.042324[/C][/ROW]
[ROW][C]39[/C][C]-0.124795[/C][C]-1.2035[/C][C]0.115922[/C][/ROW]
[ROW][C]40[/C][C]-0.127332[/C][C]-1.2279[/C][C]0.111283[/C][/ROW]
[ROW][C]41[/C][C]-0.077224[/C][C]-0.7447[/C][C]0.229159[/C][/ROW]
[ROW][C]42[/C][C]0.001339[/C][C]0.0129[/C][C]0.494862[/C][/ROW]
[ROW][C]43[/C][C]-0.065949[/C][C]-0.636[/C][C]0.263172[/C][/ROW]
[ROW][C]44[/C][C]-0.125114[/C][C]-1.2066[/C][C]0.115332[/C][/ROW]
[ROW][C]45[/C][C]-0.147781[/C][C]-1.4252[/C][C]0.07873[/C][/ROW]
[ROW][C]46[/C][C]-0.216842[/C][C]-2.0911[/C][C]0.019621[/C][/ROW]
[ROW][C]47[/C][C]-0.069646[/C][C]-0.6716[/C][C]0.251737[/C][/ROW]
[ROW][C]48[/C][C]0.10628[/C][C]1.0249[/C][C]0.154029[/C][/ROW]
[/TABLE]
Source: https://freestatistics.org/blog/index.php?pk=32937&T=1

Globally Unique Identifier (entire table): ba.freestatistics.org/blog/index.php?pk=32937&T=1

As an alternative you can also use a QR Code:  

The GUIDs for individual cells are displayed in the table below:

Autocorrelation Function
Time lag kACF(k)T-STATP-value
10.4764034.59437e-06
20.1372761.32380.0944
30.2537622.44720.008138
40.2047141.97420.025663
50.3496153.37160.000545
60.495024.77383e-06
70.3464773.34130.000601
80.2264252.18360.015755
90.2016651.94480.027411
100.0603460.5820.281004
110.3306793.1890.000973
120.6914286.66790
130.3122153.01090.001677
140.0024010.02310.49079
150.1069711.03160.15247
160.0763620.73640.231669
170.175021.68780.047397
180.3173583.06050.001444
190.1746351.68410.047756
200.0755940.7290.233916
210.0606710.58510.279951
22-0.062019-0.59810.275617
230.1732651.67090.049051
240.4311444.15783.6e-05
250.1234881.19090.118367
26-0.128949-1.24350.108397
27-0.072272-0.6970.24378
28-0.056409-0.5440.293874
290.0078120.07530.470055
300.1236131.19210.118131
310.0494240.47660.317372
32-0.035166-0.33910.367639
33-0.061097-0.58920.278579
34-0.169187-1.63160.053075
35-0.000987-0.00950.496212
360.2533572.44330.008221
370.0133450.12870.448937
38-0.180735-1.74290.042324
39-0.124795-1.20350.115922
40-0.127332-1.22790.111283
41-0.077224-0.74470.229159
420.0013390.01290.494862
43-0.065949-0.6360.263172
44-0.125114-1.20660.115332
45-0.147781-1.42520.07873
46-0.216842-2.09110.019621
47-0.069646-0.67160.251737
480.106281.02490.154029


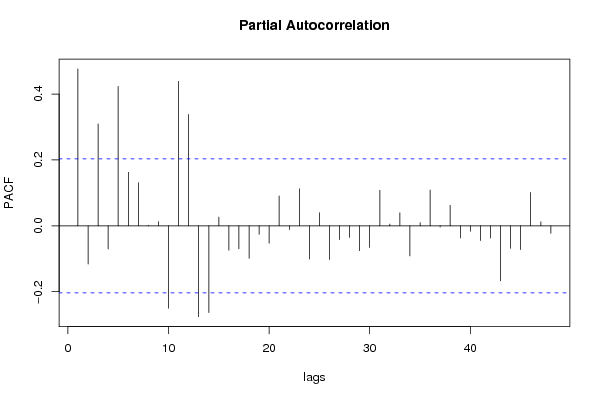
Partial Autocorrelation Function
Time lag kPACF(k)T-STATP-value
10.4764034.59437e-06
2-0.116014-1.11880.133053
30.3095132.98480.001813
4-0.069975-0.67480.250733
50.4234424.08354.7e-05
60.1627111.56910.060008
70.130991.26320.104834
80.0014560.0140.494415
90.0126250.12170.451681
10-0.250042-2.41130.00893
110.4389914.23352.7e-05
120.3383713.26310.000771
13-0.275771-2.65940.004609
14-0.263291-2.53910.006387
150.0267420.25790.398531
16-0.073992-0.71360.238646
17-0.069628-0.67150.251793
18-0.098509-0.950.17229
19-0.025784-0.24860.40209
20-0.05264-0.50760.306452
210.0907880.87550.191771
22-0.011212-0.10810.457064
230.1123931.08390.14061
24-0.101011-0.97410.166262
250.0395680.38160.351823
26-0.102291-0.98650.163233
27-0.041537-0.40060.344827
28-0.035083-0.33830.367938
29-0.075419-0.72730.234429
30-0.065799-0.63450.263642
310.1079591.04110.150261
320.0055020.05310.478897
330.0394240.38020.352334
34-0.091593-0.88330.189679
350.0095180.09180.463534
360.1087051.04830.148605
37-0.003615-0.03490.486131
380.0624840.60260.274128
39-0.036621-0.35320.362383
40-0.016516-0.15930.436899
41-0.044698-0.4310.333715
42-0.03724-0.35910.360157
43-0.167115-1.61160.055219
44-0.06828-0.65850.255933
45-0.072218-0.69640.243943
460.1013190.97710.165531
470.012420.11980.452459
48-0.02264-0.21830.413826

\begin{tabular}{lllllllll}
\hline
Partial Autocorrelation Function \tabularnewline
Time lag k & PACF(k) & T-STAT & P-value \tabularnewline
1 & 0.476403 & 4.5943 & 7e-06 \tabularnewline
2 & -0.116014 & -1.1188 & 0.133053 \tabularnewline
3 & 0.309513 & 2.9848 & 0.001813 \tabularnewline
4 & -0.069975 & -0.6748 & 0.250733 \tabularnewline
5 & 0.423442 & 4.0835 & 4.7e-05 \tabularnewline
6 & 0.162711 & 1.5691 & 0.060008 \tabularnewline
7 & 0.13099 & 1.2632 & 0.104834 \tabularnewline
8 & 0.001456 & 0.014 & 0.494415 \tabularnewline
9 & 0.012625 & 0.1217 & 0.451681 \tabularnewline
10 & -0.250042 & -2.4113 & 0.00893 \tabularnewline
11 & 0.438991 & 4.2335 & 2.7e-05 \tabularnewline
12 & 0.338371 & 3.2631 & 0.000771 \tabularnewline
13 & -0.275771 & -2.6594 & 0.004609 \tabularnewline
14 & -0.263291 & -2.5391 & 0.006387 \tabularnewline
15 & 0.026742 & 0.2579 & 0.398531 \tabularnewline
16 & -0.073992 & -0.7136 & 0.238646 \tabularnewline
17 & -0.069628 & -0.6715 & 0.251793 \tabularnewline
18 & -0.098509 & -0.95 & 0.17229 \tabularnewline
19 & -0.025784 & -0.2486 & 0.40209 \tabularnewline
20 & -0.05264 & -0.5076 & 0.306452 \tabularnewline
21 & 0.090788 & 0.8755 & 0.191771 \tabularnewline
22 & -0.011212 & -0.1081 & 0.457064 \tabularnewline
23 & 0.112393 & 1.0839 & 0.14061 \tabularnewline
24 & -0.101011 & -0.9741 & 0.166262 \tabularnewline
25 & 0.039568 & 0.3816 & 0.351823 \tabularnewline
26 & -0.102291 & -0.9865 & 0.163233 \tabularnewline
27 & -0.041537 & -0.4006 & 0.344827 \tabularnewline
28 & -0.035083 & -0.3383 & 0.367938 \tabularnewline
29 & -0.075419 & -0.7273 & 0.234429 \tabularnewline
30 & -0.065799 & -0.6345 & 0.263642 \tabularnewline
31 & 0.107959 & 1.0411 & 0.150261 \tabularnewline
32 & 0.005502 & 0.0531 & 0.478897 \tabularnewline
33 & 0.039424 & 0.3802 & 0.352334 \tabularnewline
34 & -0.091593 & -0.8833 & 0.189679 \tabularnewline
35 & 0.009518 & 0.0918 & 0.463534 \tabularnewline
36 & 0.108705 & 1.0483 & 0.148605 \tabularnewline
37 & -0.003615 & -0.0349 & 0.486131 \tabularnewline
38 & 0.062484 & 0.6026 & 0.274128 \tabularnewline
39 & -0.036621 & -0.3532 & 0.362383 \tabularnewline
40 & -0.016516 & -0.1593 & 0.436899 \tabularnewline
41 & -0.044698 & -0.431 & 0.333715 \tabularnewline
42 & -0.03724 & -0.3591 & 0.360157 \tabularnewline
43 & -0.167115 & -1.6116 & 0.055219 \tabularnewline
44 & -0.06828 & -0.6585 & 0.255933 \tabularnewline
45 & -0.072218 & -0.6964 & 0.243943 \tabularnewline
46 & 0.101319 & 0.9771 & 0.165531 \tabularnewline
47 & 0.01242 & 0.1198 & 0.452459 \tabularnewline
48 & -0.02264 & -0.2183 & 0.413826 \tabularnewline
\hline
\end{tabular}
%Source: https://freestatistics.org/blog/index.php?pk=32937&T=2

[TABLE]
[ROW][C]Partial Autocorrelation Function[/C][/ROW]
[ROW][C]Time lag k[/C][C]PACF(k)[/C][C]T-STAT[/C][C]P-value[/C][/ROW]
[ROW][C]1[/C][C]0.476403[/C][C]4.5943[/C][C]7e-06[/C][/ROW]
[ROW][C]2[/C][C]-0.116014[/C][C]-1.1188[/C][C]0.133053[/C][/ROW]
[ROW][C]3[/C][C]0.309513[/C][C]2.9848[/C][C]0.001813[/C][/ROW]
[ROW][C]4[/C][C]-0.069975[/C][C]-0.6748[/C][C]0.250733[/C][/ROW]
[ROW][C]5[/C][C]0.423442[/C][C]4.0835[/C][C]4.7e-05[/C][/ROW]
[ROW][C]6[/C][C]0.162711[/C][C]1.5691[/C][C]0.060008[/C][/ROW]
[ROW][C]7[/C][C]0.13099[/C][C]1.2632[/C][C]0.104834[/C][/ROW]
[ROW][C]8[/C][C]0.001456[/C][C]0.014[/C][C]0.494415[/C][/ROW]
[ROW][C]9[/C][C]0.012625[/C][C]0.1217[/C][C]0.451681[/C][/ROW]
[ROW][C]10[/C][C]-0.250042[/C][C]-2.4113[/C][C]0.00893[/C][/ROW]
[ROW][C]11[/C][C]0.438991[/C][C]4.2335[/C][C]2.7e-05[/C][/ROW]
[ROW][C]12[/C][C]0.338371[/C][C]3.2631[/C][C]0.000771[/C][/ROW]
[ROW][C]13[/C][C]-0.275771[/C][C]-2.6594[/C][C]0.004609[/C][/ROW]
[ROW][C]14[/C][C]-0.263291[/C][C]-2.5391[/C][C]0.006387[/C][/ROW]
[ROW][C]15[/C][C]0.026742[/C][C]0.2579[/C][C]0.398531[/C][/ROW]
[ROW][C]16[/C][C]-0.073992[/C][C]-0.7136[/C][C]0.238646[/C][/ROW]
[ROW][C]17[/C][C]-0.069628[/C][C]-0.6715[/C][C]0.251793[/C][/ROW]
[ROW][C]18[/C][C]-0.098509[/C][C]-0.95[/C][C]0.17229[/C][/ROW]
[ROW][C]19[/C][C]-0.025784[/C][C]-0.2486[/C][C]0.40209[/C][/ROW]
[ROW][C]20[/C][C]-0.05264[/C][C]-0.5076[/C][C]0.306452[/C][/ROW]
[ROW][C]21[/C][C]0.090788[/C][C]0.8755[/C][C]0.191771[/C][/ROW]
[ROW][C]22[/C][C]-0.011212[/C][C]-0.1081[/C][C]0.457064[/C][/ROW]
[ROW][C]23[/C][C]0.112393[/C][C]1.0839[/C][C]0.14061[/C][/ROW]
[ROW][C]24[/C][C]-0.101011[/C][C]-0.9741[/C][C]0.166262[/C][/ROW]
[ROW][C]25[/C][C]0.039568[/C][C]0.3816[/C][C]0.351823[/C][/ROW]
[ROW][C]26[/C][C]-0.102291[/C][C]-0.9865[/C][C]0.163233[/C][/ROW]
[ROW][C]27[/C][C]-0.041537[/C][C]-0.4006[/C][C]0.344827[/C][/ROW]
[ROW][C]28[/C][C]-0.035083[/C][C]-0.3383[/C][C]0.367938[/C][/ROW]
[ROW][C]29[/C][C]-0.075419[/C][C]-0.7273[/C][C]0.234429[/C][/ROW]
[ROW][C]30[/C][C]-0.065799[/C][C]-0.6345[/C][C]0.263642[/C][/ROW]
[ROW][C]31[/C][C]0.107959[/C][C]1.0411[/C][C]0.150261[/C][/ROW]
[ROW][C]32[/C][C]0.005502[/C][C]0.0531[/C][C]0.478897[/C][/ROW]
[ROW][C]33[/C][C]0.039424[/C][C]0.3802[/C][C]0.352334[/C][/ROW]
[ROW][C]34[/C][C]-0.091593[/C][C]-0.8833[/C][C]0.189679[/C][/ROW]
[ROW][C]35[/C][C]0.009518[/C][C]0.0918[/C][C]0.463534[/C][/ROW]
[ROW][C]36[/C][C]0.108705[/C][C]1.0483[/C][C]0.148605[/C][/ROW]
[ROW][C]37[/C][C]-0.003615[/C][C]-0.0349[/C][C]0.486131[/C][/ROW]
[ROW][C]38[/C][C]0.062484[/C][C]0.6026[/C][C]0.274128[/C][/ROW]
[ROW][C]39[/C][C]-0.036621[/C][C]-0.3532[/C][C]0.362383[/C][/ROW]
[ROW][C]40[/C][C]-0.016516[/C][C]-0.1593[/C][C]0.436899[/C][/ROW]
[ROW][C]41[/C][C]-0.044698[/C][C]-0.431[/C][C]0.333715[/C][/ROW]
[ROW][C]42[/C][C]-0.03724[/C][C]-0.3591[/C][C]0.360157[/C][/ROW]
[ROW][C]43[/C][C]-0.167115[/C][C]-1.6116[/C][C]0.055219[/C][/ROW]
[ROW][C]44[/C][C]-0.06828[/C][C]-0.6585[/C][C]0.255933[/C][/ROW]
[ROW][C]45[/C][C]-0.072218[/C][C]-0.6964[/C][C]0.243943[/C][/ROW]
[ROW][C]46[/C][C]0.101319[/C][C]0.9771[/C][C]0.165531[/C][/ROW]
[ROW][C]47[/C][C]0.01242[/C][C]0.1198[/C][C]0.452459[/C][/ROW]
[ROW][C]48[/C][C]-0.02264[/C][C]-0.2183[/C][C]0.413826[/C][/ROW]
[/TABLE]
Source: https://freestatistics.org/blog/index.php?pk=32937&T=2

Globally Unique Identifier (entire table): ba.freestatistics.org/blog/index.php?pk=32937&T=2

As an alternative you can also use a QR Code:  

The GUIDs for individual cells are displayed in the table below:

Partial Autocorrelation Function
Time lag kPACF(k)T-STATP-value
10.4764034.59437e-06
2-0.116014-1.11880.133053
30.3095132.98480.001813
4-0.069975-0.67480.250733
50.4234424.08354.7e-05
60.1627111.56910.060008
70.130991.26320.104834
80.0014560.0140.494415
90.0126250.12170.451681
10-0.250042-2.41130.00893
110.4389914.23352.7e-05
120.3383713.26310.000771
13-0.275771-2.65940.004609
14-0.263291-2.53910.006387
150.0267420.25790.398531
16-0.073992-0.71360.238646
17-0.069628-0.67150.251793
18-0.098509-0.950.17229
19-0.025784-0.24860.40209
20-0.05264-0.50760.306452
210.0907880.87550.191771
22-0.011212-0.10810.457064
230.1123931.08390.14061
24-0.101011-0.97410.166262
250.0395680.38160.351823
26-0.102291-0.98650.163233
27-0.041537-0.40060.344827
28-0.035083-0.33830.367938
29-0.075419-0.72730.234429
30-0.065799-0.63450.263642
310.1079591.04110.150261
320.0055020.05310.478897
330.0394240.38020.352334
34-0.091593-0.88330.189679
350.0095180.09180.463534
360.1087051.04830.148605
37-0.003615-0.03490.486131
380.0624840.60260.274128
39-0.036621-0.35320.362383
40-0.016516-0.15930.436899
41-0.044698-0.4310.333715
42-0.03724-0.35910.360157
43-0.167115-1.61160.055219
44-0.06828-0.65850.255933
45-0.072218-0.69640.243943
460.1013190.97710.165531
470.012420.11980.452459
48-0.02264-0.21830.413826


Parameters (Session):
par1 = 48 ; par2 = 1 ; par3 = 0 ; par4 = 0 ; par5 = 12 ;
Parameters (R input):
par1 = 48 ; par2 = 1 ; par3 = 0 ; par4 = 0 ; par5 = 12 ;
R code (references can be found in the software module):
if (par1 == 'Default') {
par1 = 10*log10(length(x))
} else {
par1 <- as.numeric(par1)
}
par2 <- as.numeric(par2)
par3 <- as.numeric(par3)
par4 <- as.numeric(par4)
par5 <- as.numeric(par5)
if (par2 == 0) {
x <- log(x)
} else {
x <- (x ^ par2 - 1) / par2
}
if (par3 > 0) x <- diff(x,lag=1,difference=par3)
if (par4 > 0) x <- diff(x,lag=par5,difference=par4)
bitmap(file='pic1.png')
racf <- acf(x,par1,main='Autocorrelation',xlab='lags',ylab='ACF')
dev.off()
bitmap(file='pic2.png')
rpacf <- pacf(x,par1,main='Partial Autocorrelation',xlab='lags',ylab='PACF')
dev.off()
(myacf <- c(racf$acf))
(mypacf <- c(rpacf$acf))
lengthx <- length(x)
sqrtn <- sqrt(lengthx)
load(file='createtable')
a<-table.start()
a<-table.row.start(a)
a<-table.element(a,'Autocorrelation Function',4,TRUE)
a<-table.row.end(a)
a<-table.row.start(a)
a<-table.element(a,'Time lag k',header=TRUE)
a<-table.element(a,hyperlink('basics.htm','ACF(k)','click here for more information about the Autocorrelation Function'),header=TRUE)
a<-table.element(a,'T-STAT',header=TRUE)
a<-table.element(a,'P-value',header=TRUE)
a<-table.row.end(a)
for (i in 2:(par1+1)) {
a<-table.row.start(a)
a<-table.element(a,i-1,header=TRUE)
a<-table.element(a,round(myacf[i],6))
mytstat <- myacf[i]*sqrtn
a<-table.element(a,round(mytstat,4))
a<-table.element(a,round(1-pt(abs(mytstat),lengthx),6))
a<-table.row.end(a)
}
a<-table.end(a)
table.save(a,file='mytable.tab')
a<-table.start()
a<-table.row.start(a)
a<-table.element(a,'Partial Autocorrelation Function',4,TRUE)
a<-table.row.end(a)
a<-table.row.start(a)
a<-table.element(a,'Time lag k',header=TRUE)
a<-table.element(a,hyperlink('basics.htm','PACF(k)','click here for more information about the Partial Autocorrelation Function'),header=TRUE)
a<-table.element(a,'T-STAT',header=TRUE)
a<-table.element(a,'P-value',header=TRUE)
a<-table.row.end(a)
for (i in 1:par1) {
a<-table.row.start(a)
a<-table.element(a,i,header=TRUE)
a<-table.element(a,round(mypacf[i],6))
mytstat <- mypacf[i]*sqrtn
a<-table.element(a,round(mytstat,4))
a<-table.element(a,round(1-pt(abs(mytstat),lengthx),6))
a<-table.row.end(a)
}
a<-table.end(a)
table.save(a,file='mytable1.tab')