Free Statistics

of Irreproducible Research!

Author's title

Author*The author of this computation has been verified*
R Software Modulerwasp_arimaforecasting.wasp
Title produced by softwareARIMA Forecasting
Date of computationSat, 13 Dec 2008 02:23:17 -0700
Cite this page as followsStatistical Computations at FreeStatistics.org, Office for Research Development and Education, URL https://freestatistics.org/blog/index.php?v=date/2008/Dec/13/t1229160244vrhpii8hdnjplv0.htm/, Retrieved Sun, 19 May 2024 06:31:41 +0000
Statistical Computations at FreeStatistics.org, Office for Research Development and Education, URL https://freestatistics.org/blog/index.php?pk=32899, Retrieved Sun, 19 May 2024 06:31:41 +0000
QR Codes:

Original text written by user:
IsPrivate?No (this computation is public)
User-defined keywords
Estimated Impact207
Family? (F = Feedback message, R = changed R code, M = changed R Module, P = changed Parameters, D = changed Data)
-     [ARIMA Forecasting] [workshop6] [2008-12-13 09:18:56] [de72ca3f4fcfd0997c84e1ac92aea119]
F   P     [ARIMA Forecasting] [workshop6] [2008-12-13 09:23:17] [56fd94b954e08a6655cb7790b21ee404] [Current]
Feedback Forum
2008-12-18 13:14:32 [Charis Berrevoets] [reply
Je hebt de juiste output gevonden. Je interpretatie van de tabel is echter fout.
Ten eerste worden de laatste maanden voorspeld: maand 133 tot 144 en niet de maanden 120-132. Dit zijn juist de laatste maanden die nog blijven staan en waarmee vergeleken wordt.
Er is ook géén significant verschil tussen de werkelijke waarden en de voorspelde waarden. Dat de p-waarde hoog is wil zeggen dat we bvb voor maand 133 43% kans hebben dat we ons vergissen bij het verwerpen van de nulhypothese. Dit betekent dat het verschil tussen de 2 waarden niet significant is.
Je hebt hier ook reeds de kansen op een stijgende trend besproken, dit moest echter pas bij stap 4 dus ik zal daar evalueren wat je hier geschreven hebt.
Je had hier wel nog de UB (upper bound) en LB (lower bound) kunnen bespreken. Deze geven het 95%-betrouwbaarheidsinterval weer. Met een waarschijnlijkheid van 95% zal de voorspelde waarde gelegen zijn tussen deze twee grenzen. Dit is een ceteris paribus voorspelling. Dit houdt in dat alle omstandigheden hetzelfde moeten blijven, als er fundamentele wijzigingen gebeurd zijn dan zijn de resultaten hier minder betrouwbaar.
Je vermeldt dat er iets speciaal aan de hand is in periode 135. Dit klopt, hier is echter het verschil juist wel significant. We zien hier een p-waarde die kleiner is dan 5% en er is ook een groot verschil tussen de voorspelde en de werkelijke waarde. Hier kunnen allerhande verklaringen voor zijn zoals een verandering in de economische conjunctuur, stakingen, een promotie etc.
2008-12-18 14:59:15 [Charis Berrevoets] [reply
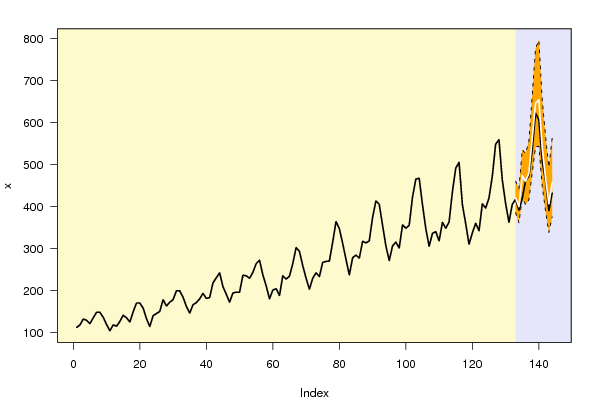
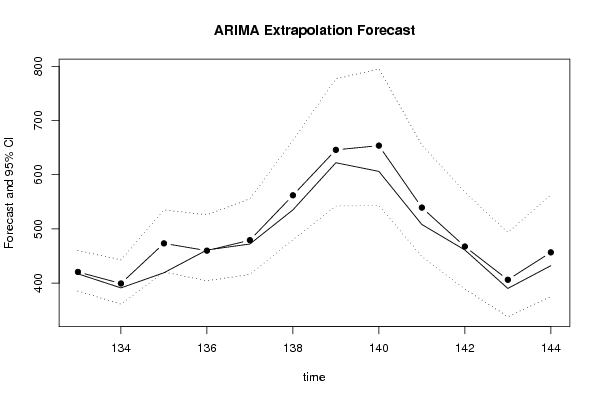
Step 2: In de eerste grafiek zien we inderdaad dat de voorspelde waarde redelijk goed overeen komt met de werkelijke. Ook de tweede grafiek heb je goed besproken. Je had deze misschien beter kunnen gebruiken om te antwoorden in step 5.
Step 3: Je hebt de standaardfout goed besproken. Je had nog kunnen zeggen dat de werkelijke fout (PE) vastgesteld wordt door de werkelijke waarden met de voorspelde te vergelijken. Verder moet je opletten dat je de absolute waarde van de PE bekijkt, dan is deze inderdaad kleiner dan de %S.E., behalve voor de 3de maand. Dit is niet toevallig, we hadden immers eerder al gezien dat er iets mis is met deze maand. Daarom was het al te verwachten dat de voorspellingsfout hier groter zou zijn.
We kunnen hier inderdaad concluderen dat we een goed model hebben opgebouwd. Dit omdat na 12 maanden voorspellen de %S.E. nog maar 12% is. Dit is een zeer lage waarde, met dit model zijn we dus in staat om goede voorspellingen te maken.
Step 4: Je hebt de kansen niet allemaal correct geïnterpreteerd:
P(F[t]>Y[t-1]): is niet de kans op een stijging ten opzichte van vorig jaar maar ten opzichte van de vorige periode. We zien hier dus dat een stijgende trend voorspeld wordt.
P(F[t]>Y[t-s]): is niet de kans dat de voorspelde waarde dezelfde is als die van dezelfde maand in het vorige jaar, maar dat ze groter is. Ook hier zien we dat verwacht wordt dat de waarden zullen stijgen.
P(F[t]>Y[132]): is inderdaad de kans dat we stijgen ten opzichte van de laatst gekende waarde (132). Ook hier wordt tenslotte een stijgende trend voorspeld.
Step 5: heel goed.
2008-12-23 10:08:20 [94a54c888ac7f7d6874c3108eb0e1808] [reply
De student heeft de juiste tabel.
We berekenen de laatste 12 observaties. De waarde Y(t) is de oorspronkelijke waarde van de tijdreeks. De waarde F(t) is de voorspelde. Men kan zien dat de voorspelde waarde binnen het 95% betrouwbaarheidsinterval liggen dat gedefinieerd is in kolom 4 en 5. Er komen geen explosieve waarden in voor dus kunnen we stellen dat we een stabiel model hebben.
De 6de kolom is de p-waarde: het vergissen van het verwerpen van de 0 hypothese.

2008-12-23 10:14:00 [94a54c888ac7f7d6874c3108eb0e1808] [reply
Step 2: Zoals de student heeft opgemerkt is het een goed model. De grijze zone zijn de laatste 12 waarnemingen opnieuw voorspelt. De witte lijn is de voorspelde en de 2 stippellijnen is het 95 % betrouwbaarheidsinterval. De witte lijn wijkt niet af van het 95% betrouwbaarheidsinterval dus kunnen we stellen dat de gevonden waarden significant van 0 zijn en dus niet aan het toeval te wijten. De voorspelde waarden liggen vrij dicht bij de echte en volgen het model. Op de laatste grafiek zien we een dalende trend en seizonaliteit.

step 3: Je hebt de standaardfout correct geïnterpreteerd. Het is een goed model.

Step 4: De waarden van de tabel zijn fout geïnterpreteerd.
7de kolom: Hier wordt berekend wat de kans is dat we stijgen tegen over de laatste maand.
In de 8ste kolom wordt de kans berekend dat in deze maanden dezelfde waarde voorkomen als een jaar eerder.
In de 9de kolom worden de waarde berekend wat de kans is dat we stijgen tegen over de laatste gekende waarde.

Step 5 :correct.


Post a new message
Dataseries X:
112
118
132
129
121
135
148
148
136
119
104
118
115
126
141
135
125
149
170
170
158
133
114
140
145
150
178
163
172
178
199
199
184
162
146
166
171
180
193
181
183
218
230
242
209
191
172
194
196
196
236
235
229
243
264
272
237
211
180
201
204
188
235
227
234
264
302
293
259
229
203
229
242
233
267
269
270
315
364
347
312
274
237
278
284
277
317
313
318
374
413
405
355
306
271
306
315
301
356
348
355
422
465
467
404
347
305
336
340
318
362
348
363
435
491
505
404
359
310
337
360
342
406
396
420
472
548
559
463
407
362
405
417
391
419
461
472
535
622
606
508
461
390
432


Summary of computational transaction
Raw Inputview raw input (R code)
Raw Outputview raw output of R engine
Computing time3 seconds
R Server'Sir Ronald Aylmer Fisher' @ 193.190.124.24

\begin{tabular}{lllllllll}
\hline
Summary of computational transaction \tabularnewline
Raw Input & view raw input (R code)  \tabularnewline
Raw Output & view raw output of R engine  \tabularnewline
Computing time & 3 seconds \tabularnewline
R Server & 'Sir Ronald Aylmer Fisher' @ 193.190.124.24 \tabularnewline
\hline
\end{tabular}
%Source: https://freestatistics.org/blog/index.php?pk=32899&T=0

[TABLE]
[ROW][C]Summary of computational transaction[/C][/ROW]
[ROW][C]Raw Input[/C][C]view raw input (R code) [/C][/ROW]
[ROW][C]Raw Output[/C][C]view raw output of R engine [/C][/ROW]
[ROW][C]Computing time[/C][C]3 seconds[/C][/ROW]
[ROW][C]R Server[/C][C]'Sir Ronald Aylmer Fisher' @ 193.190.124.24[/C][/ROW]
[/TABLE]
Source: https://freestatistics.org/blog/index.php?pk=32899&T=0

Globally Unique Identifier (entire table): ba.freestatistics.org/blog/index.php?pk=32899&T=0

As an alternative you can also use a QR Code:  

The GUIDs for individual cells are displayed in the table below:

Summary of computational transaction
Raw Inputview raw input (R code)
Raw Outputview raw output of R engine
Computing time3 seconds
R Server'Sir Ronald Aylmer Fisher' @ 193.190.124.24


Univariate ARIMA Extrapolation Forecast
timeY[t]F[t]95% LB95% UBp-value(H0: Y[t] = F[t])P(F[t]>Y[t-1])P(F[t]>Y[t-s])P(F[t]>Y[132])
120337-------
121360-------
122342-------
123406-------
124396-------
125420-------
126472-------
127548-------
128559-------
129463-------
130407-------
131362-------
132405-------
133417420.4376385.2234459.9540.43230.77810.99860.7781
134391399.1493361.0418442.65540.35680.21060.9950.3961
135419473.1677420.2928535.02660.04310.99540.98330.9846
136461459.762404.1038525.81170.48530.88680.97080.9479
137472479.1007415.9796555.26150.42750.67930.93590.9717
138535561.8519479.5594663.48750.30230.95840.95840.9988
139622645.7644542.0887776.76630.36110.95130.92820.9998
140606653.5451543.1045795.05290.25510.66890.90480.9997
141508539.2133448.8089654.79360.29830.12870.90190.9886
142461467.3323388.8733567.67860.45080.21350.88070.8883
143390406.0529337.9633493.1080.35890.1080.83940.5095
144432456.5858374.9333562.94780.32530.89010.82910.8291

\begin{tabular}{lllllllll}
\hline
Univariate ARIMA Extrapolation Forecast \tabularnewline
time & Y[t] & F[t] & 95% LB & 95% UB & p-value(H0: Y[t] = F[t]) & P(F[t]>Y[t-1]) & P(F[t]>Y[t-s]) & P(F[t]>Y[132]) \tabularnewline
120 & 337 & - & - & - & - & - & - & - \tabularnewline
121 & 360 & - & - & - & - & - & - & - \tabularnewline
122 & 342 & - & - & - & - & - & - & - \tabularnewline
123 & 406 & - & - & - & - & - & - & - \tabularnewline
124 & 396 & - & - & - & - & - & - & - \tabularnewline
125 & 420 & - & - & - & - & - & - & - \tabularnewline
126 & 472 & - & - & - & - & - & - & - \tabularnewline
127 & 548 & - & - & - & - & - & - & - \tabularnewline
128 & 559 & - & - & - & - & - & - & - \tabularnewline
129 & 463 & - & - & - & - & - & - & - \tabularnewline
130 & 407 & - & - & - & - & - & - & - \tabularnewline
131 & 362 & - & - & - & - & - & - & - \tabularnewline
132 & 405 & - & - & - & - & - & - & - \tabularnewline
133 & 417 & 420.4376 & 385.2234 & 459.954 & 0.4323 & 0.7781 & 0.9986 & 0.7781 \tabularnewline
134 & 391 & 399.1493 & 361.0418 & 442.6554 & 0.3568 & 0.2106 & 0.995 & 0.3961 \tabularnewline
135 & 419 & 473.1677 & 420.2928 & 535.0266 & 0.0431 & 0.9954 & 0.9833 & 0.9846 \tabularnewline
136 & 461 & 459.762 & 404.1038 & 525.8117 & 0.4853 & 0.8868 & 0.9708 & 0.9479 \tabularnewline
137 & 472 & 479.1007 & 415.9796 & 555.2615 & 0.4275 & 0.6793 & 0.9359 & 0.9717 \tabularnewline
138 & 535 & 561.8519 & 479.5594 & 663.4875 & 0.3023 & 0.9584 & 0.9584 & 0.9988 \tabularnewline
139 & 622 & 645.7644 & 542.0887 & 776.7663 & 0.3611 & 0.9513 & 0.9282 & 0.9998 \tabularnewline
140 & 606 & 653.5451 & 543.1045 & 795.0529 & 0.2551 & 0.6689 & 0.9048 & 0.9997 \tabularnewline
141 & 508 & 539.2133 & 448.8089 & 654.7936 & 0.2983 & 0.1287 & 0.9019 & 0.9886 \tabularnewline
142 & 461 & 467.3323 & 388.8733 & 567.6786 & 0.4508 & 0.2135 & 0.8807 & 0.8883 \tabularnewline
143 & 390 & 406.0529 & 337.9633 & 493.108 & 0.3589 & 0.108 & 0.8394 & 0.5095 \tabularnewline
144 & 432 & 456.5858 & 374.9333 & 562.9478 & 0.3253 & 0.8901 & 0.8291 & 0.8291 \tabularnewline
\hline
\end{tabular}
%Source: https://freestatistics.org/blog/index.php?pk=32899&T=1

[TABLE]
[ROW][C]Univariate ARIMA Extrapolation Forecast[/C][/ROW]
[ROW][C]time[/C][C]Y[t][/C][C]F[t][/C][C]95% LB[/C][C]95% UB[/C][C]p-value(H0: Y[t] = F[t])[/C][C]P(F[t]>Y[t-1])[/C][C]P(F[t]>Y[t-s])[/C][C]P(F[t]>Y[132])[/C][/ROW]
[ROW][C]120[/C][C]337[/C][C]-[/C][C]-[/C][C]-[/C][C]-[/C][C]-[/C][C]-[/C][C]-[/C][/ROW]
[ROW][C]121[/C][C]360[/C][C]-[/C][C]-[/C][C]-[/C][C]-[/C][C]-[/C][C]-[/C][C]-[/C][/ROW]
[ROW][C]122[/C][C]342[/C][C]-[/C][C]-[/C][C]-[/C][C]-[/C][C]-[/C][C]-[/C][C]-[/C][/ROW]
[ROW][C]123[/C][C]406[/C][C]-[/C][C]-[/C][C]-[/C][C]-[/C][C]-[/C][C]-[/C][C]-[/C][/ROW]
[ROW][C]124[/C][C]396[/C][C]-[/C][C]-[/C][C]-[/C][C]-[/C][C]-[/C][C]-[/C][C]-[/C][/ROW]
[ROW][C]125[/C][C]420[/C][C]-[/C][C]-[/C][C]-[/C][C]-[/C][C]-[/C][C]-[/C][C]-[/C][/ROW]
[ROW][C]126[/C][C]472[/C][C]-[/C][C]-[/C][C]-[/C][C]-[/C][C]-[/C][C]-[/C][C]-[/C][/ROW]
[ROW][C]127[/C][C]548[/C][C]-[/C][C]-[/C][C]-[/C][C]-[/C][C]-[/C][C]-[/C][C]-[/C][/ROW]
[ROW][C]128[/C][C]559[/C][C]-[/C][C]-[/C][C]-[/C][C]-[/C][C]-[/C][C]-[/C][C]-[/C][/ROW]
[ROW][C]129[/C][C]463[/C][C]-[/C][C]-[/C][C]-[/C][C]-[/C][C]-[/C][C]-[/C][C]-[/C][/ROW]
[ROW][C]130[/C][C]407[/C][C]-[/C][C]-[/C][C]-[/C][C]-[/C][C]-[/C][C]-[/C][C]-[/C][/ROW]
[ROW][C]131[/C][C]362[/C][C]-[/C][C]-[/C][C]-[/C][C]-[/C][C]-[/C][C]-[/C][C]-[/C][/ROW]
[ROW][C]132[/C][C]405[/C][C]-[/C][C]-[/C][C]-[/C][C]-[/C][C]-[/C][C]-[/C][C]-[/C][/ROW]
[ROW][C]133[/C][C]417[/C][C]420.4376[/C][C]385.2234[/C][C]459.954[/C][C]0.4323[/C][C]0.7781[/C][C]0.9986[/C][C]0.7781[/C][/ROW]
[ROW][C]134[/C][C]391[/C][C]399.1493[/C][C]361.0418[/C][C]442.6554[/C][C]0.3568[/C][C]0.2106[/C][C]0.995[/C][C]0.3961[/C][/ROW]
[ROW][C]135[/C][C]419[/C][C]473.1677[/C][C]420.2928[/C][C]535.0266[/C][C]0.0431[/C][C]0.9954[/C][C]0.9833[/C][C]0.9846[/C][/ROW]
[ROW][C]136[/C][C]461[/C][C]459.762[/C][C]404.1038[/C][C]525.8117[/C][C]0.4853[/C][C]0.8868[/C][C]0.9708[/C][C]0.9479[/C][/ROW]
[ROW][C]137[/C][C]472[/C][C]479.1007[/C][C]415.9796[/C][C]555.2615[/C][C]0.4275[/C][C]0.6793[/C][C]0.9359[/C][C]0.9717[/C][/ROW]
[ROW][C]138[/C][C]535[/C][C]561.8519[/C][C]479.5594[/C][C]663.4875[/C][C]0.3023[/C][C]0.9584[/C][C]0.9584[/C][C]0.9988[/C][/ROW]
[ROW][C]139[/C][C]622[/C][C]645.7644[/C][C]542.0887[/C][C]776.7663[/C][C]0.3611[/C][C]0.9513[/C][C]0.9282[/C][C]0.9998[/C][/ROW]
[ROW][C]140[/C][C]606[/C][C]653.5451[/C][C]543.1045[/C][C]795.0529[/C][C]0.2551[/C][C]0.6689[/C][C]0.9048[/C][C]0.9997[/C][/ROW]
[ROW][C]141[/C][C]508[/C][C]539.2133[/C][C]448.8089[/C][C]654.7936[/C][C]0.2983[/C][C]0.1287[/C][C]0.9019[/C][C]0.9886[/C][/ROW]
[ROW][C]142[/C][C]461[/C][C]467.3323[/C][C]388.8733[/C][C]567.6786[/C][C]0.4508[/C][C]0.2135[/C][C]0.8807[/C][C]0.8883[/C][/ROW]
[ROW][C]143[/C][C]390[/C][C]406.0529[/C][C]337.9633[/C][C]493.108[/C][C]0.3589[/C][C]0.108[/C][C]0.8394[/C][C]0.5095[/C][/ROW]
[ROW][C]144[/C][C]432[/C][C]456.5858[/C][C]374.9333[/C][C]562.9478[/C][C]0.3253[/C][C]0.8901[/C][C]0.8291[/C][C]0.8291[/C][/ROW]
[/TABLE]
Source: https://freestatistics.org/blog/index.php?pk=32899&T=1

Globally Unique Identifier (entire table): ba.freestatistics.org/blog/index.php?pk=32899&T=1

As an alternative you can also use a QR Code:  

The GUIDs for individual cells are displayed in the table below:

Univariate ARIMA Extrapolation Forecast
timeY[t]F[t]95% LB95% UBp-value(H0: Y[t] = F[t])P(F[t]>Y[t-1])P(F[t]>Y[t-s])P(F[t]>Y[132])
120337-------
121360-------
122342-------
123406-------
124396-------
125420-------
126472-------
127548-------
128559-------
129463-------
130407-------
131362-------
132405-------
133417420.4376385.2234459.9540.43230.77810.99860.7781
134391399.1493361.0418442.65540.35680.21060.9950.3961
135419473.1677420.2928535.02660.04310.99540.98330.9846
136461459.762404.1038525.81170.48530.88680.97080.9479
137472479.1007415.9796555.26150.42750.67930.93590.9717
138535561.8519479.5594663.48750.30230.95840.95840.9988
139622645.7644542.0887776.76630.36110.95130.92820.9998
140606653.5451543.1045795.05290.25510.66890.90480.9997
141508539.2133448.8089654.79360.29830.12870.90190.9886
142461467.3323388.8733567.67860.45080.21350.88070.8883
143390406.0529337.9633493.1080.35890.1080.83940.5095
144432456.5858374.9333562.94780.32530.89010.82910.8291


Univariate ARIMA Extrapolation Forecast Performance
time% S.E.PEMAPESq.EMSERMSE
1330.048-0.00827e-0411.81740.98480.9924
1340.0556-0.02040.001766.41095.53422.3525
1350.0667-0.11450.00952934.1384244.511515.6369
1360.07330.00272e-041.53270.12770.3574
1370.0811-0.01480.001250.42064.20172.0498
1380.0923-0.04780.004721.022860.08527.7515
1390.1035-0.03680.0031564.749147.06246.8602
1400.1105-0.07270.00612260.5365188.37813.7251
1410.1094-0.05790.0048974.267281.18899.0105
1420.1096-0.01350.001140.09833.34151.828
1430.1094-0.03950.0033257.694521.47454.6341
1440.1189-0.05380.0045604.463350.37197.0973

\begin{tabular}{lllllllll}
\hline
Univariate ARIMA Extrapolation Forecast Performance \tabularnewline
time & % S.E. & PE & MAPE & Sq.E & MSE & RMSE \tabularnewline
133 & 0.048 & -0.0082 & 7e-04 & 11.8174 & 0.9848 & 0.9924 \tabularnewline
134 & 0.0556 & -0.0204 & 0.0017 & 66.4109 & 5.5342 & 2.3525 \tabularnewline
135 & 0.0667 & -0.1145 & 0.0095 & 2934.1384 & 244.5115 & 15.6369 \tabularnewline
136 & 0.0733 & 0.0027 & 2e-04 & 1.5327 & 0.1277 & 0.3574 \tabularnewline
137 & 0.0811 & -0.0148 & 0.0012 & 50.4206 & 4.2017 & 2.0498 \tabularnewline
138 & 0.0923 & -0.0478 & 0.004 & 721.0228 & 60.0852 & 7.7515 \tabularnewline
139 & 0.1035 & -0.0368 & 0.0031 & 564.7491 & 47.0624 & 6.8602 \tabularnewline
140 & 0.1105 & -0.0727 & 0.0061 & 2260.5365 & 188.378 & 13.7251 \tabularnewline
141 & 0.1094 & -0.0579 & 0.0048 & 974.2672 & 81.1889 & 9.0105 \tabularnewline
142 & 0.1096 & -0.0135 & 0.0011 & 40.0983 & 3.3415 & 1.828 \tabularnewline
143 & 0.1094 & -0.0395 & 0.0033 & 257.6945 & 21.4745 & 4.6341 \tabularnewline
144 & 0.1189 & -0.0538 & 0.0045 & 604.4633 & 50.3719 & 7.0973 \tabularnewline
\hline
\end{tabular}
%Source: https://freestatistics.org/blog/index.php?pk=32899&T=2

[TABLE]
[ROW][C]Univariate ARIMA Extrapolation Forecast Performance[/C][/ROW]
[ROW][C]time[/C][C]% S.E.[/C][C]PE[/C][C]MAPE[/C][C]Sq.E[/C][C]MSE[/C][C]RMSE[/C][/ROW]
[ROW][C]133[/C][C]0.048[/C][C]-0.0082[/C][C]7e-04[/C][C]11.8174[/C][C]0.9848[/C][C]0.9924[/C][/ROW]
[ROW][C]134[/C][C]0.0556[/C][C]-0.0204[/C][C]0.0017[/C][C]66.4109[/C][C]5.5342[/C][C]2.3525[/C][/ROW]
[ROW][C]135[/C][C]0.0667[/C][C]-0.1145[/C][C]0.0095[/C][C]2934.1384[/C][C]244.5115[/C][C]15.6369[/C][/ROW]
[ROW][C]136[/C][C]0.0733[/C][C]0.0027[/C][C]2e-04[/C][C]1.5327[/C][C]0.1277[/C][C]0.3574[/C][/ROW]
[ROW][C]137[/C][C]0.0811[/C][C]-0.0148[/C][C]0.0012[/C][C]50.4206[/C][C]4.2017[/C][C]2.0498[/C][/ROW]
[ROW][C]138[/C][C]0.0923[/C][C]-0.0478[/C][C]0.004[/C][C]721.0228[/C][C]60.0852[/C][C]7.7515[/C][/ROW]
[ROW][C]139[/C][C]0.1035[/C][C]-0.0368[/C][C]0.0031[/C][C]564.7491[/C][C]47.0624[/C][C]6.8602[/C][/ROW]
[ROW][C]140[/C][C]0.1105[/C][C]-0.0727[/C][C]0.0061[/C][C]2260.5365[/C][C]188.378[/C][C]13.7251[/C][/ROW]
[ROW][C]141[/C][C]0.1094[/C][C]-0.0579[/C][C]0.0048[/C][C]974.2672[/C][C]81.1889[/C][C]9.0105[/C][/ROW]
[ROW][C]142[/C][C]0.1096[/C][C]-0.0135[/C][C]0.0011[/C][C]40.0983[/C][C]3.3415[/C][C]1.828[/C][/ROW]
[ROW][C]143[/C][C]0.1094[/C][C]-0.0395[/C][C]0.0033[/C][C]257.6945[/C][C]21.4745[/C][C]4.6341[/C][/ROW]
[ROW][C]144[/C][C]0.1189[/C][C]-0.0538[/C][C]0.0045[/C][C]604.4633[/C][C]50.3719[/C][C]7.0973[/C][/ROW]
[/TABLE]
Source: https://freestatistics.org/blog/index.php?pk=32899&T=2

Globally Unique Identifier (entire table): ba.freestatistics.org/blog/index.php?pk=32899&T=2

As an alternative you can also use a QR Code:  

The GUIDs for individual cells are displayed in the table below:

Univariate ARIMA Extrapolation Forecast Performance
time% S.E.PEMAPESq.EMSERMSE
1330.048-0.00827e-0411.81740.98480.9924
1340.0556-0.02040.001766.41095.53422.3525
1350.0667-0.11450.00952934.1384244.511515.6369
1360.07330.00272e-041.53270.12770.3574
1370.0811-0.01480.001250.42064.20172.0498
1380.0923-0.04780.004721.022860.08527.7515
1390.1035-0.03680.0031564.749147.06246.8602
1400.1105-0.07270.00612260.5365188.37813.7251
1410.1094-0.05790.0048974.267281.18899.0105
1420.1096-0.01350.001140.09833.34151.828
1430.1094-0.03950.0033257.694521.47454.6341
1440.1189-0.05380.0045604.463350.37197.0973


Parameters (Session):
par1 = 12 ; par2 = -0.3 ; par3 = 1 ; par4 = 1 ; par5 = 12 ; par6 = 0 ; par7 = 1 ; par8 = 0 ; par9 = 1 ; par10 = FALSE ;
Parameters (R input):
par1 = 12 ; par2 = -0.3 ; par3 = 1 ; par4 = 1 ; par5 = 12 ; par6 = 0 ; par7 = 1 ; par8 = 0 ; par9 = 1 ; par10 = FALSE ;
R code (references can be found in the software module):
par1 <- as.numeric(par1) #cut off periods
par2 <- as.numeric(par2) #lambda
par3 <- as.numeric(par3) #degree of non-seasonal differencing
par4 <- as.numeric(par4) #degree of seasonal differencing
par5 <- as.numeric(par5) #seasonal period
par6 <- as.numeric(par6) #p
par7 <- as.numeric(par7) #q
par8 <- as.numeric(par8) #P
par9 <- as.numeric(par9) #Q
if (par10 == 'TRUE') par10 <- TRUE
if (par10 == 'FALSE') par10 <- FALSE
if (par2 == 0) x <- log(x)
if (par2 != 0) x <- x^par2
lx <- length(x)
first <- lx - 2*par1
nx <- lx - par1
nx1 <- nx + 1
fx <- lx - nx
if (fx < 1) {
fx <- par5
nx1 <- lx + fx - 1
first <- lx - 2*fx
}
first <- 1
if (fx < 3) fx <- round(lx/10,0)
(arima.out <- arima(x[1:nx], order=c(par6,par3,par7), seasonal=list(order=c(par8,par4,par9), period=par5), include.mean=par10, method='ML'))
(forecast <- predict(arima.out,fx))
(lb <- forecast$pred - 1.96 * forecast$se)
(ub <- forecast$pred + 1.96 * forecast$se)
if (par2 == 0) {
x <- exp(x)
forecast$pred <- exp(forecast$pred)
lb <- exp(lb)
ub <- exp(ub)
}
if (par2 != 0) {
x <- x^(1/par2)
forecast$pred <- forecast$pred^(1/par2)
lb <- lb^(1/par2)
ub <- ub^(1/par2)
}
if (par2 < 0) {
olb <- lb
lb <- ub
ub <- olb
}
(actandfor <- c(x[1:nx], forecast$pred))
(perc.se <- (ub-forecast$pred)/1.96/forecast$pred)
bitmap(file='test1.png')
opar <- par(mar=c(4,4,2,2),las=1)
ylim <- c( min(x[first:nx],lb), max(x[first:nx],ub))
plot(x,ylim=ylim,type='n',xlim=c(first,lx))
usr <- par('usr')
rect(usr[1],usr[3],nx+1,usr[4],border=NA,col='lemonchiffon')
rect(nx1,usr[3],usr[2],usr[4],border=NA,col='lavender')
abline(h= (-3:3)*2 , col ='gray', lty =3)
polygon( c(nx1:lx,lx:nx1), c(lb,rev(ub)), col = 'orange', lty=2,border=NA)
lines(nx1:lx, lb , lty=2)
lines(nx1:lx, ub , lty=2)
lines(x, lwd=2)
lines(nx1:lx, forecast$pred , lwd=2 , col ='white')
box()
par(opar)
dev.off()
prob.dec <- array(NA, dim=fx)
prob.sdec <- array(NA, dim=fx)
prob.ldec <- array(NA, dim=fx)
prob.pval <- array(NA, dim=fx)
perf.pe <- array(0, dim=fx)
perf.mape <- array(0, dim=fx)
perf.se <- array(0, dim=fx)
perf.mse <- array(0, dim=fx)
perf.rmse <- array(0, dim=fx)
for (i in 1:fx) {
locSD <- (ub[i] - forecast$pred[i]) / 1.96
perf.pe[i] = (x[nx+i] - forecast$pred[i]) / forecast$pred[i]
perf.mape[i] = perf.mape[i] + abs(perf.pe[i])
perf.se[i] = (x[nx+i] - forecast$pred[i])^2
perf.mse[i] = perf.mse[i] + perf.se[i]
prob.dec[i] = pnorm((x[nx+i-1] - forecast$pred[i]) / locSD)
prob.sdec[i] = pnorm((x[nx+i-par5] - forecast$pred[i]) / locSD)
prob.ldec[i] = pnorm((x[nx] - forecast$pred[i]) / locSD)
prob.pval[i] = pnorm(abs(x[nx+i] - forecast$pred[i]) / locSD)
}
perf.mape = perf.mape / fx
perf.mse = perf.mse / fx
perf.rmse = sqrt(perf.mse)
bitmap(file='test2.png')
plot(forecast$pred, pch=19, type='b',main='ARIMA Extrapolation Forecast', ylab='Forecast and 95% CI', xlab='time',ylim=c(min(lb),max(ub)))
dum <- forecast$pred
dum[1:12] <- x[(nx+1):lx]
lines(dum, lty=1)
lines(ub,lty=3)
lines(lb,lty=3)
dev.off()
load(file='createtable')
a<-table.start()
a<-table.row.start(a)
a<-table.element(a,'Univariate ARIMA Extrapolation Forecast',9,TRUE)
a<-table.row.end(a)
a<-table.row.start(a)
a<-table.element(a,'time',1,header=TRUE)
a<-table.element(a,'Y[t]',1,header=TRUE)
a<-table.element(a,'F[t]',1,header=TRUE)
a<-table.element(a,'95% LB',1,header=TRUE)
a<-table.element(a,'95% UB',1,header=TRUE)
a<-table.element(a,'p-value
(H0: Y[t] = F[t])',1,header=TRUE)
a<-table.element(a,'P(F[t]>Y[t-1])',1,header=TRUE)
a<-table.element(a,'P(F[t]>Y[t-s])',1,header=TRUE)
mylab <- paste('P(F[t]>Y[',nx,sep='')
mylab <- paste(mylab,'])',sep='')
a<-table.element(a,mylab,1,header=TRUE)
a<-table.row.end(a)
for (i in (nx-par5):nx) {
a<-table.row.start(a)
a<-table.element(a,i,header=TRUE)
a<-table.element(a,x[i])
a<-table.element(a,'-')
a<-table.row.end(a)
}
for (i in 1:fx) {
a<-table.row.start(a)
a<-table.element(a,nx+i,header=TRUE)
a<-table.element(a,round(x[nx+i],4))
a<-table.element(a,round(forecast$pred[i],4))
a<-table.element(a,round(lb[i],4))
a<-table.element(a,round(ub[i],4))
a<-table.element(a,round((1-prob.pval[i]),4))
a<-table.element(a,round((1-prob.dec[i]),4))
a<-table.element(a,round((1-prob.sdec[i]),4))
a<-table.element(a,round((1-prob.ldec[i]),4))
a<-table.row.end(a)
}
a<-table.end(a)
table.save(a,file='mytable.tab')
a<-table.start()
a<-table.row.start(a)
a<-table.element(a,'Univariate ARIMA Extrapolation Forecast Performance',7,TRUE)
a<-table.row.end(a)
a<-table.row.start(a)
a<-table.element(a,'time',1,header=TRUE)
a<-table.element(a,'% S.E.',1,header=TRUE)
a<-table.element(a,'PE',1,header=TRUE)
a<-table.element(a,'MAPE',1,header=TRUE)
a<-table.element(a,'Sq.E',1,header=TRUE)
a<-table.element(a,'MSE',1,header=TRUE)
a<-table.element(a,'RMSE',1,header=TRUE)
a<-table.row.end(a)
for (i in 1:fx) {
a<-table.row.start(a)
a<-table.element(a,nx+i,header=TRUE)
a<-table.element(a,round(perc.se[i],4))
a<-table.element(a,round(perf.pe[i],4))
a<-table.element(a,round(perf.mape[i],4))
a<-table.element(a,round(perf.se[i],4))
a<-table.element(a,round(perf.mse[i],4))
a<-table.element(a,round(perf.rmse[i],4))
a<-table.row.end(a)
}
a<-table.end(a)
table.save(a,file='mytable1.tab')