Free Statistics

of Irreproducible Research!

Author's title

Author*The author of this computation has been verified*
R Software Modulerwasp_arimabackwardselection.wasp
Title produced by softwareARIMA Backward Selection
Date of computationFri, 12 Dec 2008 12:09:17 -0700
Cite this page as followsStatistical Computations at FreeStatistics.org, Office for Research Development and Education, URL https://freestatistics.org/blog/index.php?v=date/2008/Dec/12/t1229108990l662a5xz1uuy2sb.htm/, Retrieved Sun, 19 May 2024 06:06:30 +0000
Statistical Computations at FreeStatistics.org, Office for Research Development and Education, URL https://freestatistics.org/blog/index.php?pk=32871, Retrieved Sun, 19 May 2024 06:06:30 +0000
QR Codes:

Original text written by user:
IsPrivate?No (this computation is public)
User-defined keywords
Estimated Impact204
Family? (F = Feedback message, R = changed R code, M = changed R Module, P = changed Parameters, D = changed Data)
-     [Univariate Data Series] [Uitvoer.Nederland] [2008-12-03 15:11:10] [988ab43f527fc78aae41c84649095267]
-   P   [Univariate Data Series] [Export From Belgi...] [2008-12-03 15:52:29] [988ab43f527fc78aae41c84649095267]
- RMP     [Variance Reduction Matrix] [Variance Reductio...] [2008-12-03 15:56:08] [988ab43f527fc78aae41c84649095267]
- RMP       [(Partial) Autocorrelation Function] [Partial Autocorre...] [2008-12-03 16:40:39] [988ab43f527fc78aae41c84649095267]
- RMP         [ARIMA Backward Selection] [ARMA backward sel...] [2008-12-11 15:57:30] [988ab43f527fc78aae41c84649095267]
-   P           [ARIMA Backward Selection] [ARMA backward sel...] [2008-12-11 16:11:26] [988ab43f527fc78aae41c84649095267]
-   PD            [ARIMA Backward Selection] [ARMA backward sel...] [2008-12-11 17:31:33] [988ab43f527fc78aae41c84649095267]
-   PD                [ARIMA Backward Selection] [ARMA backward sel...] [2008-12-12 19:09:17] [5d823194959040fa9b19b8c8302177e6] [Current]
Feedback Forum

Post a new message
Dataseries X:
3258.1
3140.1
3627.4
3279.4
3204
3515.6
3146.6
2271.7
3627.9
3553.4
3018.3
3355.4
3242
3311.1
4125.2
3423
3120.3
3863
3240.8
2837.4
3945
3684.1
3659.6
3769.6
3592.7
3754
4507.8
3853.2
3817.2
3958.4
3428.9
3125.7
3977
3983.3
4299.6
4306.9
4259.5
3986
4755.6
3925.6
4206.5
4323.4
3816.1
3410.7
4227.4
4296.9
4351.7
3800
4277
4100.2
4672.5
4189.9
4231.9
4654.9
4298.5
3635.9
4505.1
4891.9
4894.2
4093.2


Summary of computational transaction
Raw Inputview raw input (R code)
Raw Outputview raw output of R engine
Computing time22 seconds
R Server'Herman Ole Andreas Wold' @ 193.190.124.10:1001

\begin{tabular}{lllllllll}
\hline
Summary of computational transaction \tabularnewline
Raw Input & view raw input (R code)  \tabularnewline
Raw Output & view raw output of R engine  \tabularnewline
Computing time & 22 seconds \tabularnewline
R Server & 'Herman Ole Andreas Wold' @ 193.190.124.10:1001 \tabularnewline
\hline
\end{tabular}
%Source: https://freestatistics.org/blog/index.php?pk=32871&T=0

[TABLE]
[ROW][C]Summary of computational transaction[/C][/ROW]
[ROW][C]Raw Input[/C][C]view raw input (R code) [/C][/ROW]
[ROW][C]Raw Output[/C][C]view raw output of R engine [/C][/ROW]
[ROW][C]Computing time[/C][C]22 seconds[/C][/ROW]
[ROW][C]R Server[/C][C]'Herman Ole Andreas Wold' @ 193.190.124.10:1001[/C][/ROW]
[/TABLE]
Source: https://freestatistics.org/blog/index.php?pk=32871&T=0

Globally Unique Identifier (entire table): ba.freestatistics.org/blog/index.php?pk=32871&T=0

As an alternative you can also use a QR Code:  

The GUIDs for individual cells are displayed in the table below:

Summary of computational transaction
Raw Inputview raw input (R code)
Raw Outputview raw output of R engine
Computing time22 seconds
R Server'Herman Ole Andreas Wold' @ 193.190.124.10:1001


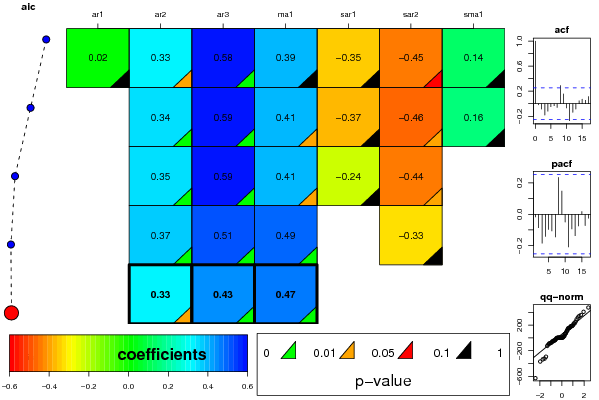
ARIMA Parameter Estimation and Backward Selection
Iterationar1ar2ar3ma1sar1sar2sma1
Estimates ( 1 )0.0180.33110.5820.3896-0.352-0.45390.1388
(p-val)(0.932 )(0.0422 )(2e-04 )(0.1276 )(0.6824 )(0.0628 )(0.8931 )
Estimates ( 2 )00.34090.58790.4064-0.3666-0.45930.1591
(p-val)(NA )(0.0034 )(0 )(0.0111 )(0.6588 )(0.0479 )(0.8731 )
Estimates ( 3 )00.34620.58890.4074-0.2362-0.44030
(p-val)(NA )(0.002 )(0 )(0.0112 )(0.2149 )(0.0324 )(NA )
Estimates ( 4 )00.36630.50640.48620-0.33240
(p-val)(NA )(0.0024 )(3e-04 )(5e-04 )(NA )(0.1268 )(NA )
Estimates ( 5 )00.33140.43430.4693000
(p-val)(NA )(0.0101 )(0.0013 )(0.001 )(NA )(NA )(NA )
Estimates ( 6 )NANANANANANANA
(p-val)(NA )(NA )(NA )(NA )(NA )(NA )(NA )
Estimates ( 7 )NANANANANANANA
(p-val)(NA )(NA )(NA )(NA )(NA )(NA )(NA )
Estimates ( 8 )NANANANANANANA
(p-val)(NA )(NA )(NA )(NA )(NA )(NA )(NA )
Estimates ( 9 )NANANANANANANA
(p-val)(NA )(NA )(NA )(NA )(NA )(NA )(NA )
Estimates ( 10 )NANANANANANANA
(p-val)(NA )(NA )(NA )(NA )(NA )(NA )(NA )
Estimates ( 11 )NANANANANANANA
(p-val)(NA )(NA )(NA )(NA )(NA )(NA )(NA )
Estimates ( 12 )NANANANANANANA
(p-val)(NA )(NA )(NA )(NA )(NA )(NA )(NA )
Estimates ( 13 )NANANANANANANA
(p-val)(NA )(NA )(NA )(NA )(NA )(NA )(NA )

\begin{tabular}{lllllllll}
\hline
ARIMA Parameter Estimation and Backward Selection \tabularnewline
Iteration & ar1 & ar2 & ar3 & ma1 & sar1 & sar2 & sma1 \tabularnewline
Estimates ( 1 ) & 0.018 & 0.3311 & 0.582 & 0.3896 & -0.352 & -0.4539 & 0.1388 \tabularnewline
(p-val) & (0.932 ) & (0.0422 ) & (2e-04 ) & (0.1276 ) & (0.6824 ) & (0.0628 ) & (0.8931 ) \tabularnewline
Estimates ( 2 ) & 0 & 0.3409 & 0.5879 & 0.4064 & -0.3666 & -0.4593 & 0.1591 \tabularnewline
(p-val) & (NA ) & (0.0034 ) & (0 ) & (0.0111 ) & (0.6588 ) & (0.0479 ) & (0.8731 ) \tabularnewline
Estimates ( 3 ) & 0 & 0.3462 & 0.5889 & 0.4074 & -0.2362 & -0.4403 & 0 \tabularnewline
(p-val) & (NA ) & (0.002 ) & (0 ) & (0.0112 ) & (0.2149 ) & (0.0324 ) & (NA ) \tabularnewline
Estimates ( 4 ) & 0 & 0.3663 & 0.5064 & 0.4862 & 0 & -0.3324 & 0 \tabularnewline
(p-val) & (NA ) & (0.0024 ) & (3e-04 ) & (5e-04 ) & (NA ) & (0.1268 ) & (NA ) \tabularnewline
Estimates ( 5 ) & 0 & 0.3314 & 0.4343 & 0.4693 & 0 & 0 & 0 \tabularnewline
(p-val) & (NA ) & (0.0101 ) & (0.0013 ) & (0.001 ) & (NA ) & (NA ) & (NA ) \tabularnewline
Estimates ( 6 ) & NA & NA & NA & NA & NA & NA & NA \tabularnewline
(p-val) & (NA ) & (NA ) & (NA ) & (NA ) & (NA ) & (NA ) & (NA ) \tabularnewline
Estimates ( 7 ) & NA & NA & NA & NA & NA & NA & NA \tabularnewline
(p-val) & (NA ) & (NA ) & (NA ) & (NA ) & (NA ) & (NA ) & (NA ) \tabularnewline
Estimates ( 8 ) & NA & NA & NA & NA & NA & NA & NA \tabularnewline
(p-val) & (NA ) & (NA ) & (NA ) & (NA ) & (NA ) & (NA ) & (NA ) \tabularnewline
Estimates ( 9 ) & NA & NA & NA & NA & NA & NA & NA \tabularnewline
(p-val) & (NA ) & (NA ) & (NA ) & (NA ) & (NA ) & (NA ) & (NA ) \tabularnewline
Estimates ( 10 ) & NA & NA & NA & NA & NA & NA & NA \tabularnewline
(p-val) & (NA ) & (NA ) & (NA ) & (NA ) & (NA ) & (NA ) & (NA ) \tabularnewline
Estimates ( 11 ) & NA & NA & NA & NA & NA & NA & NA \tabularnewline
(p-val) & (NA ) & (NA ) & (NA ) & (NA ) & (NA ) & (NA ) & (NA ) \tabularnewline
Estimates ( 12 ) & NA & NA & NA & NA & NA & NA & NA \tabularnewline
(p-val) & (NA ) & (NA ) & (NA ) & (NA ) & (NA ) & (NA ) & (NA ) \tabularnewline
Estimates ( 13 ) & NA & NA & NA & NA & NA & NA & NA \tabularnewline
(p-val) & (NA ) & (NA ) & (NA ) & (NA ) & (NA ) & (NA ) & (NA ) \tabularnewline
\hline
\end{tabular}
%Source: https://freestatistics.org/blog/index.php?pk=32871&T=1

[TABLE]
[ROW][C]ARIMA Parameter Estimation and Backward Selection[/C][/ROW]
[ROW][C]Iteration[/C][C]ar1[/C][C]ar2[/C][C]ar3[/C][C]ma1[/C][C]sar1[/C][C]sar2[/C][C]sma1[/C][/ROW]
[ROW][C]Estimates ( 1 )[/C][C]0.018[/C][C]0.3311[/C][C]0.582[/C][C]0.3896[/C][C]-0.352[/C][C]-0.4539[/C][C]0.1388[/C][/ROW]
[ROW][C](p-val)[/C][C](0.932 )[/C][C](0.0422 )[/C][C](2e-04 )[/C][C](0.1276 )[/C][C](0.6824 )[/C][C](0.0628 )[/C][C](0.8931 )[/C][/ROW]
[ROW][C]Estimates ( 2 )[/C][C]0[/C][C]0.3409[/C][C]0.5879[/C][C]0.4064[/C][C]-0.3666[/C][C]-0.4593[/C][C]0.1591[/C][/ROW]
[ROW][C](p-val)[/C][C](NA )[/C][C](0.0034 )[/C][C](0 )[/C][C](0.0111 )[/C][C](0.6588 )[/C][C](0.0479 )[/C][C](0.8731 )[/C][/ROW]
[ROW][C]Estimates ( 3 )[/C][C]0[/C][C]0.3462[/C][C]0.5889[/C][C]0.4074[/C][C]-0.2362[/C][C]-0.4403[/C][C]0[/C][/ROW]
[ROW][C](p-val)[/C][C](NA )[/C][C](0.002 )[/C][C](0 )[/C][C](0.0112 )[/C][C](0.2149 )[/C][C](0.0324 )[/C][C](NA )[/C][/ROW]
[ROW][C]Estimates ( 4 )[/C][C]0[/C][C]0.3663[/C][C]0.5064[/C][C]0.4862[/C][C]0[/C][C]-0.3324[/C][C]0[/C][/ROW]
[ROW][C](p-val)[/C][C](NA )[/C][C](0.0024 )[/C][C](3e-04 )[/C][C](5e-04 )[/C][C](NA )[/C][C](0.1268 )[/C][C](NA )[/C][/ROW]
[ROW][C]Estimates ( 5 )[/C][C]0[/C][C]0.3314[/C][C]0.4343[/C][C]0.4693[/C][C]0[/C][C]0[/C][C]0[/C][/ROW]
[ROW][C](p-val)[/C][C](NA )[/C][C](0.0101 )[/C][C](0.0013 )[/C][C](0.001 )[/C][C](NA )[/C][C](NA )[/C][C](NA )[/C][/ROW]
[ROW][C]Estimates ( 6 )[/C][C]NA[/C][C]NA[/C][C]NA[/C][C]NA[/C][C]NA[/C][C]NA[/C][C]NA[/C][/ROW]
[ROW][C](p-val)[/C][C](NA )[/C][C](NA )[/C][C](NA )[/C][C](NA )[/C][C](NA )[/C][C](NA )[/C][C](NA )[/C][/ROW]
[ROW][C]Estimates ( 7 )[/C][C]NA[/C][C]NA[/C][C]NA[/C][C]NA[/C][C]NA[/C][C]NA[/C][C]NA[/C][/ROW]
[ROW][C](p-val)[/C][C](NA )[/C][C](NA )[/C][C](NA )[/C][C](NA )[/C][C](NA )[/C][C](NA )[/C][C](NA )[/C][/ROW]
[ROW][C]Estimates ( 8 )[/C][C]NA[/C][C]NA[/C][C]NA[/C][C]NA[/C][C]NA[/C][C]NA[/C][C]NA[/C][/ROW]
[ROW][C](p-val)[/C][C](NA )[/C][C](NA )[/C][C](NA )[/C][C](NA )[/C][C](NA )[/C][C](NA )[/C][C](NA )[/C][/ROW]
[ROW][C]Estimates ( 9 )[/C][C]NA[/C][C]NA[/C][C]NA[/C][C]NA[/C][C]NA[/C][C]NA[/C][C]NA[/C][/ROW]
[ROW][C](p-val)[/C][C](NA )[/C][C](NA )[/C][C](NA )[/C][C](NA )[/C][C](NA )[/C][C](NA )[/C][C](NA )[/C][/ROW]
[ROW][C]Estimates ( 10 )[/C][C]NA[/C][C]NA[/C][C]NA[/C][C]NA[/C][C]NA[/C][C]NA[/C][C]NA[/C][/ROW]
[ROW][C](p-val)[/C][C](NA )[/C][C](NA )[/C][C](NA )[/C][C](NA )[/C][C](NA )[/C][C](NA )[/C][C](NA )[/C][/ROW]
[ROW][C]Estimates ( 11 )[/C][C]NA[/C][C]NA[/C][C]NA[/C][C]NA[/C][C]NA[/C][C]NA[/C][C]NA[/C][/ROW]
[ROW][C](p-val)[/C][C](NA )[/C][C](NA )[/C][C](NA )[/C][C](NA )[/C][C](NA )[/C][C](NA )[/C][C](NA )[/C][/ROW]
[ROW][C]Estimates ( 12 )[/C][C]NA[/C][C]NA[/C][C]NA[/C][C]NA[/C][C]NA[/C][C]NA[/C][C]NA[/C][/ROW]
[ROW][C](p-val)[/C][C](NA )[/C][C](NA )[/C][C](NA )[/C][C](NA )[/C][C](NA )[/C][C](NA )[/C][C](NA )[/C][/ROW]
[ROW][C]Estimates ( 13 )[/C][C]NA[/C][C]NA[/C][C]NA[/C][C]NA[/C][C]NA[/C][C]NA[/C][C]NA[/C][/ROW]
[ROW][C](p-val)[/C][C](NA )[/C][C](NA )[/C][C](NA )[/C][C](NA )[/C][C](NA )[/C][C](NA )[/C][C](NA )[/C][/ROW]
[/TABLE]
Source: https://freestatistics.org/blog/index.php?pk=32871&T=1

Globally Unique Identifier (entire table): ba.freestatistics.org/blog/index.php?pk=32871&T=1

As an alternative you can also use a QR Code:  

The GUIDs for individual cells are displayed in the table below:

ARIMA Parameter Estimation and Backward Selection
Iterationar1ar2ar3ma1sar1sar2sma1
Estimates ( 1 )0.0180.33110.5820.3896-0.352-0.45390.1388
(p-val)(0.932 )(0.0422 )(2e-04 )(0.1276 )(0.6824 )(0.0628 )(0.8931 )
Estimates ( 2 )00.34090.58790.4064-0.3666-0.45930.1591
(p-val)(NA )(0.0034 )(0 )(0.0111 )(0.6588 )(0.0479 )(0.8731 )
Estimates ( 3 )00.34620.58890.4074-0.2362-0.44030
(p-val)(NA )(0.002 )(0 )(0.0112 )(0.2149 )(0.0324 )(NA )
Estimates ( 4 )00.36630.50640.48620-0.33240
(p-val)(NA )(0.0024 )(3e-04 )(5e-04 )(NA )(0.1268 )(NA )
Estimates ( 5 )00.33140.43430.4693000
(p-val)(NA )(0.0101 )(0.0013 )(0.001 )(NA )(NA )(NA )
Estimates ( 6 )NANANANANANANA
(p-val)(NA )(NA )(NA )(NA )(NA )(NA )(NA )
Estimates ( 7 )NANANANANANANA
(p-val)(NA )(NA )(NA )(NA )(NA )(NA )(NA )
Estimates ( 8 )NANANANANANANA
(p-val)(NA )(NA )(NA )(NA )(NA )(NA )(NA )
Estimates ( 9 )NANANANANANANA
(p-val)(NA )(NA )(NA )(NA )(NA )(NA )(NA )
Estimates ( 10 )NANANANANANANA
(p-val)(NA )(NA )(NA )(NA )(NA )(NA )(NA )
Estimates ( 11 )NANANANANANANA
(p-val)(NA )(NA )(NA )(NA )(NA )(NA )(NA )
Estimates ( 12 )NANANANANANANA
(p-val)(NA )(NA )(NA )(NA )(NA )(NA )(NA )
Estimates ( 13 )NANANANANANANA
(p-val)(NA )(NA )(NA )(NA )(NA )(NA )(NA )


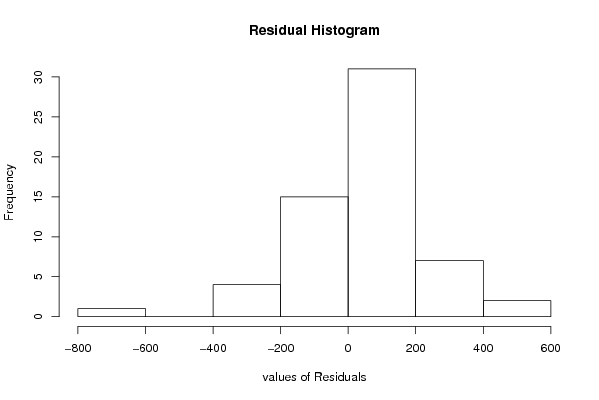
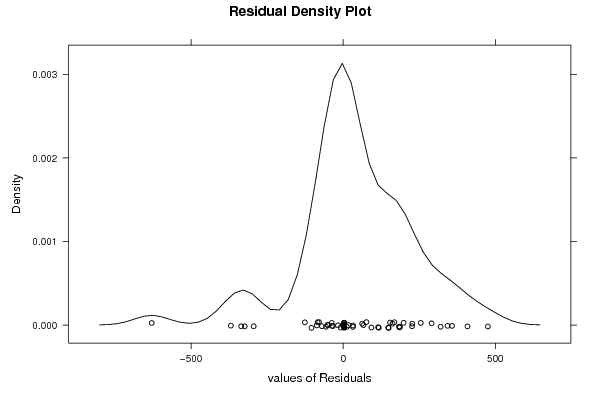
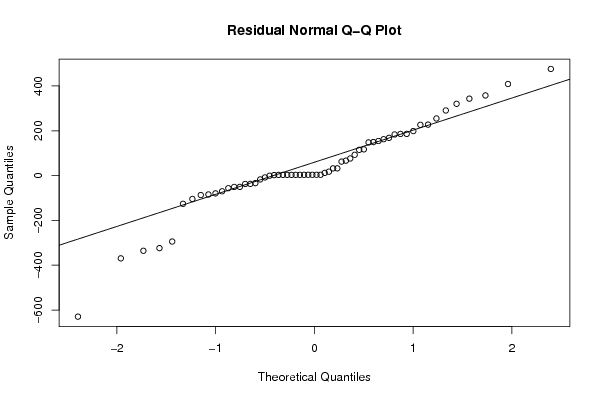
Estimated ARIMA Residuals
Value
3.35531430502430
-8.27824829537609
149.540958192094
357.656091329720
-70.1438691246764
-294.355508214039
185.934833759926
-37.4426496422524
475.778021932562
-126.019995722206
-50.5353528229222
254.919810631308
76.2956600693727
17.3402342208028
-33.6606764675061
66.54969715018
62.4011186977277
290.561654319568
-369.278599572156
-79.3152916002157
-50.7273835817855
-37.0025615954489
114.864675462522
408.601116299976
227.290451503914
147.884140883699
-323.744373330072
32.300201214924
-335.474185200649
226.507902273975
117.110992165333
168.330200462587
32.1487019092338
-56.4275268006185
-0.712849408821241
-104.251326636888
-629.486466528813
162.18010138729
183.486287612826
92.7105608515546
198.570754030778
11.9752819079022
185.879182636985
154.148511617242
-17.1247456794647
-86.8602016223809
343.160120077268
320.199034451878
-84.2788770245183

\begin{tabular}{lllllllll}
\hline
Estimated ARIMA Residuals \tabularnewline
Value \tabularnewline
3.35531430502430 \tabularnewline
-8.27824829537609 \tabularnewline
149.540958192094 \tabularnewline
357.656091329720 \tabularnewline
-70.1438691246764 \tabularnewline
-294.355508214039 \tabularnewline
185.934833759926 \tabularnewline
-37.4426496422524 \tabularnewline
475.778021932562 \tabularnewline
-126.019995722206 \tabularnewline
-50.5353528229222 \tabularnewline
254.919810631308 \tabularnewline
76.2956600693727 \tabularnewline
17.3402342208028 \tabularnewline
-33.6606764675061 \tabularnewline
66.54969715018 \tabularnewline
62.4011186977277 \tabularnewline
290.561654319568 \tabularnewline
-369.278599572156 \tabularnewline
-79.3152916002157 \tabularnewline
-50.7273835817855 \tabularnewline
-37.0025615954489 \tabularnewline
114.864675462522 \tabularnewline
408.601116299976 \tabularnewline
227.290451503914 \tabularnewline
147.884140883699 \tabularnewline
-323.744373330072 \tabularnewline
32.300201214924 \tabularnewline
-335.474185200649 \tabularnewline
226.507902273975 \tabularnewline
117.110992165333 \tabularnewline
168.330200462587 \tabularnewline
32.1487019092338 \tabularnewline
-56.4275268006185 \tabularnewline
-0.712849408821241 \tabularnewline
-104.251326636888 \tabularnewline
-629.486466528813 \tabularnewline
162.18010138729 \tabularnewline
183.486287612826 \tabularnewline
92.7105608515546 \tabularnewline
198.570754030778 \tabularnewline
11.9752819079022 \tabularnewline
185.879182636985 \tabularnewline
154.148511617242 \tabularnewline
-17.1247456794647 \tabularnewline
-86.8602016223809 \tabularnewline
343.160120077268 \tabularnewline
320.199034451878 \tabularnewline
-84.2788770245183 \tabularnewline
\hline
\end{tabular}
%Source: https://freestatistics.org/blog/index.php?pk=32871&T=2

[TABLE]
[ROW][C]Estimated ARIMA Residuals[/C][/ROW]
[ROW][C]Value[/C][/ROW]
[ROW][C]3.35531430502430[/C][/ROW]
[ROW][C]-8.27824829537609[/C][/ROW]
[ROW][C]149.540958192094[/C][/ROW]
[ROW][C]357.656091329720[/C][/ROW]
[ROW][C]-70.1438691246764[/C][/ROW]
[ROW][C]-294.355508214039[/C][/ROW]
[ROW][C]185.934833759926[/C][/ROW]
[ROW][C]-37.4426496422524[/C][/ROW]
[ROW][C]475.778021932562[/C][/ROW]
[ROW][C]-126.019995722206[/C][/ROW]
[ROW][C]-50.5353528229222[/C][/ROW]
[ROW][C]254.919810631308[/C][/ROW]
[ROW][C]76.2956600693727[/C][/ROW]
[ROW][C]17.3402342208028[/C][/ROW]
[ROW][C]-33.6606764675061[/C][/ROW]
[ROW][C]66.54969715018[/C][/ROW]
[ROW][C]62.4011186977277[/C][/ROW]
[ROW][C]290.561654319568[/C][/ROW]
[ROW][C]-369.278599572156[/C][/ROW]
[ROW][C]-79.3152916002157[/C][/ROW]
[ROW][C]-50.7273835817855[/C][/ROW]
[ROW][C]-37.0025615954489[/C][/ROW]
[ROW][C]114.864675462522[/C][/ROW]
[ROW][C]408.601116299976[/C][/ROW]
[ROW][C]227.290451503914[/C][/ROW]
[ROW][C]147.884140883699[/C][/ROW]
[ROW][C]-323.744373330072[/C][/ROW]
[ROW][C]32.300201214924[/C][/ROW]
[ROW][C]-335.474185200649[/C][/ROW]
[ROW][C]226.507902273975[/C][/ROW]
[ROW][C]117.110992165333[/C][/ROW]
[ROW][C]168.330200462587[/C][/ROW]
[ROW][C]32.1487019092338[/C][/ROW]
[ROW][C]-56.4275268006185[/C][/ROW]
[ROW][C]-0.712849408821241[/C][/ROW]
[ROW][C]-104.251326636888[/C][/ROW]
[ROW][C]-629.486466528813[/C][/ROW]
[ROW][C]162.18010138729[/C][/ROW]
[ROW][C]183.486287612826[/C][/ROW]
[ROW][C]92.7105608515546[/C][/ROW]
[ROW][C]198.570754030778[/C][/ROW]
[ROW][C]11.9752819079022[/C][/ROW]
[ROW][C]185.879182636985[/C][/ROW]
[ROW][C]154.148511617242[/C][/ROW]
[ROW][C]-17.1247456794647[/C][/ROW]
[ROW][C]-86.8602016223809[/C][/ROW]
[ROW][C]343.160120077268[/C][/ROW]
[ROW][C]320.199034451878[/C][/ROW]
[ROW][C]-84.2788770245183[/C][/ROW]
[/TABLE]
Source: https://freestatistics.org/blog/index.php?pk=32871&T=2

Globally Unique Identifier (entire table): ba.freestatistics.org/blog/index.php?pk=32871&T=2

As an alternative you can also use a QR Code:  

The GUIDs for individual cells are displayed in the table below:

Estimated ARIMA Residuals
Value
3.35531430502430
-8.27824829537609
149.540958192094
357.656091329720
-70.1438691246764
-294.355508214039
185.934833759926
-37.4426496422524
475.778021932562
-126.019995722206
-50.5353528229222
254.919810631308
76.2956600693727
17.3402342208028
-33.6606764675061
66.54969715018
62.4011186977277
290.561654319568
-369.278599572156
-79.3152916002157
-50.7273835817855
-37.0025615954489
114.864675462522
408.601116299976
227.290451503914
147.884140883699
-323.744373330072
32.300201214924
-335.474185200649
226.507902273975
117.110992165333
168.330200462587
32.1487019092338
-56.4275268006185
-0.712849408821241
-104.251326636888
-629.486466528813
162.18010138729
183.486287612826
92.7105608515546
198.570754030778
11.9752819079022
185.879182636985
154.148511617242
-17.1247456794647
-86.8602016223809
343.160120077268
320.199034451878
-84.2788770245183


Parameters (Session):
par1 = 12 ;
Parameters (R input):
par1 = FALSE ; par2 = 1 ; par3 = 0 ; par4 = 1 ; par5 = 12 ; par6 = 3 ; par7 = 1 ; par8 = 2 ; par9 = 1 ;
R code (references can be found in the software module):
library(lattice)
if (par1 == 'TRUE') par1 <- TRUE
if (par1 == 'FALSE') par1 <- FALSE
par2 <- as.numeric(par2) #Box-Cox lambda transformation parameter
par3 <- as.numeric(par3) #degree of non-seasonal differencing
par4 <- as.numeric(par4) #degree of seasonal differencing
par5 <- as.numeric(par5) #seasonal period
par6 <- as.numeric(par6) #degree (p) of the non-seasonal AR(p) polynomial
par7 <- as.numeric(par7) #degree (q) of the non-seasonal MA(q) polynomial
par8 <- as.numeric(par8) #degree (P) of the seasonal AR(P) polynomial
par9 <- as.numeric(par9) #degree (Q) of the seasonal MA(Q) polynomial
armaGR <- function(arima.out, names, n){
try1 <- arima.out$coef
try2 <- sqrt(diag(arima.out$var.coef))
try.data.frame <- data.frame(matrix(NA,ncol=4,nrow=length(names)))
dimnames(try.data.frame) <- list(names,c('coef','std','tstat','pv'))
try.data.frame[,1] <- try1
for(i in 1:length(try2)) try.data.frame[which(rownames(try.data.frame)==names(try2)[i]),2] <- try2[i]
try.data.frame[,3] <- try.data.frame[,1] / try.data.frame[,2]
try.data.frame[,4] <- round((1-pt(abs(try.data.frame[,3]),df=n-(length(try2)+1)))*2,5)
vector <- rep(NA,length(names))
vector[is.na(try.data.frame[,4])] <- 0
maxi <- which.max(try.data.frame[,4])
continue <- max(try.data.frame[,4],na.rm=TRUE) > .05
vector[maxi] <- 0
list(summary=try.data.frame,next.vector=vector,continue=continue)
}
arimaSelect <- function(series, order=c(13,0,0), seasonal=list(order=c(2,0,0),period=12), include.mean=F){
nrc <- order[1]+order[3]+seasonal$order[1]+seasonal$order[3]
coeff <- matrix(NA, nrow=nrc*2, ncol=nrc)
pval <- matrix(NA, nrow=nrc*2, ncol=nrc)
mylist <- rep(list(NULL), nrc)
names <- NULL
if(order[1] > 0) names <- paste('ar',1:order[1],sep='')
if(order[3] > 0) names <- c( names , paste('ma',1:order[3],sep='') )
if(seasonal$order[1] > 0) names <- c(names, paste('sar',1:seasonal$order[1],sep=''))
if(seasonal$order[3] > 0) names <- c(names, paste('sma',1:seasonal$order[3],sep=''))
arima.out <- arima(series, order=order, seasonal=seasonal, include.mean=include.mean, method='ML')
mylist[[1]] <- arima.out
last.arma <- armaGR(arima.out, names, length(series))
mystop <- FALSE
i <- 1
coeff[i,] <- last.arma[[1]][,1]
pval [i,] <- last.arma[[1]][,4]
i <- 2
aic <- arima.out$aic
while(!mystop){
mylist[[i]] <- arima.out
arima.out <- arima(series, order=order, seasonal=seasonal, include.mean=include.mean, method='ML', fixed=last.arma$next.vector)
aic <- c(aic, arima.out$aic)
last.arma <- armaGR(arima.out, names, length(series))
mystop <- !last.arma$continue
coeff[i,] <- last.arma[[1]][,1]
pval [i,] <- last.arma[[1]][,4]
i <- i+1
}
list(coeff, pval, mylist, aic=aic)
}
arimaSelectplot <- function(arimaSelect.out,noms,choix){
noms <- names(arimaSelect.out[[3]][[1]]$coef)
coeff <- arimaSelect.out[[1]]
k <- min(which(is.na(coeff[,1])))-1
coeff <- coeff[1:k,]
pval <- arimaSelect.out[[2]][1:k,]
aic <- arimaSelect.out$aic[1:k]
coeff[coeff==0] <- NA
n <- ncol(coeff)
if(missing(choix)) choix <- k
layout(matrix(c(1,1,1,2,
3,3,3,2,
3,3,3,4,
5,6,7,7),nr=4),
widths=c(10,35,45,15),
heights=c(30,30,15,15))
couleurs <- rainbow(75)[1:50]#(50)
ticks <- pretty(coeff)
par(mar=c(1,1,3,1))
plot(aic,k:1-.5,type='o',pch=21,bg='blue',cex=2,axes=F,lty=2,xpd=NA)
points(aic[choix],k-choix+.5,pch=21,cex=4,bg=2,xpd=NA)
title('aic',line=2)
par(mar=c(3,0,0,0))
plot(0,axes=F,xlab='',ylab='',xlim=range(ticks),ylim=c(.1,1))
rect(xleft = min(ticks) + (0:49)/50*(max(ticks)-min(ticks)),
xright = min(ticks) + (1:50)/50*(max(ticks)-min(ticks)),
ytop = rep(1,50),
ybottom= rep(0,50),col=couleurs,border=NA)
axis(1,ticks)
rect(xleft=min(ticks),xright=max(ticks),ytop=1,ybottom=0)
text(mean(coeff,na.rm=T),.5,'coefficients',cex=2,font=2)
par(mar=c(1,1,3,1))
image(1:n,1:k,t(coeff[k:1,]),axes=F,col=couleurs,zlim=range(ticks))
for(i in 1:n) for(j in 1:k) if(!is.na(coeff[j,i])) {
if(pval[j,i]<.01) symb = 'green'
else if( (pval[j,i]<.05) & (pval[j,i]>=.01)) symb = 'orange'
else if( (pval[j,i]<.1) & (pval[j,i]>=.05)) symb = 'red'
else symb = 'black'
polygon(c(i+.5 ,i+.2 ,i+.5 ,i+.5),
c(k-j+0.5,k-j+0.5,k-j+0.8,k-j+0.5),
col=symb)
if(j==choix) {
rect(xleft=i-.5,
xright=i+.5,
ybottom=k-j+1.5,
ytop=k-j+.5,
lwd=4)
text(i,
k-j+1,
round(coeff[j,i],2),
cex=1.2,
font=2)
}
else{
rect(xleft=i-.5,xright=i+.5,ybottom=k-j+1.5,ytop=k-j+.5)
text(i,k-j+1,round(coeff[j,i],2),cex=1.2,font=1)
}
}
axis(3,1:n,noms)
par(mar=c(0.5,0,0,0.5))
plot(0,axes=F,xlab='',ylab='',type='n',xlim=c(0,8),ylim=c(-.2,.8))
cols <- c('green','orange','red','black')
niv <- c('0','0.01','0.05','0.1')
for(i in 0:3){
polygon(c(1+2*i ,1+2*i ,1+2*i-.5 ,1+2*i),
c(.4 ,.7 , .4 , .4),
col=cols[i+1])
text(2*i,0.5,niv[i+1],cex=1.5)
}
text(8,.5,1,cex=1.5)
text(4,0,'p-value',cex=2)
box()
residus <- arimaSelect.out[[3]][[choix]]$res
par(mar=c(1,2,4,1))
acf(residus,main='')
title('acf',line=.5)
par(mar=c(1,2,4,1))
pacf(residus,main='')
title('pacf',line=.5)
par(mar=c(2,2,4,1))
qqnorm(residus,main='')
title('qq-norm',line=.5)
qqline(residus)
residus
}
if (par2 == 0) x <- log(x)
if (par2 != 0) x <- x^par2
(selection <- arimaSelect(x, order=c(par6,par3,par7), seasonal=list(order=c(par8,par4,par9), period=par5)))
bitmap(file='test1.png')
resid <- arimaSelectplot(selection)
dev.off()
resid
bitmap(file='test2.png')
acf(resid,length(resid)/2, main='Residual Autocorrelation Function')
dev.off()
bitmap(file='test3.png')
pacf(resid,length(resid)/2, main='Residual Partial Autocorrelation Function')
dev.off()
bitmap(file='test4.png')
cpgram(resid, main='Residual Cumulative Periodogram')
dev.off()
bitmap(file='test5.png')
hist(resid, main='Residual Histogram', xlab='values of Residuals')
dev.off()
bitmap(file='test6.png')
densityplot(~resid,col='black',main='Residual Density Plot', xlab='values of Residuals')
dev.off()
bitmap(file='test7.png')
qqnorm(resid, main='Residual Normal Q-Q Plot')
qqline(resid)
dev.off()
ncols <- length(selection[[1]][1,])
nrows <- length(selection[[2]][,1])-1
load(file='createtable')
a<-table.start()
a<-table.row.start(a)
a<-table.element(a,'ARIMA Parameter Estimation and Backward Selection', ncols+1,TRUE)
a<-table.row.end(a)
a<-table.row.start(a)
a<-table.element(a,'Iteration', header=TRUE)
for (i in 1:ncols) {
a<-table.element(a,names(selection[[3]][[1]]$coef)[i],header=TRUE)
}
a<-table.row.end(a)
for (j in 1:nrows) {
a<-table.row.start(a)
mydum <- 'Estimates ('
mydum <- paste(mydum,j)
mydum <- paste(mydum,')')
a<-table.element(a,mydum, header=TRUE)
for (i in 1:ncols) {
a<-table.element(a,round(selection[[1]][j,i],4))
}
a<-table.row.end(a)
a<-table.row.start(a)
a<-table.element(a,'(p-val)', header=TRUE)
for (i in 1:ncols) {
mydum <- '('
mydum <- paste(mydum,round(selection[[2]][j,i],4),sep='')
mydum <- paste(mydum,')')
a<-table.element(a,mydum)
}
a<-table.row.end(a)
}
a<-table.end(a)
table.save(a,file='mytable.tab')
a<-table.start()
a<-table.row.start(a)
a<-table.element(a,'Estimated ARIMA Residuals', 1,TRUE)
a<-table.row.end(a)
a<-table.row.start(a)
a<-table.element(a,'Value', 1,TRUE)
a<-table.row.end(a)
for (i in (par4*par5+par3):length(resid)) {
a<-table.row.start(a)
a<-table.element(a,resid[i])
a<-table.row.end(a)
}
a<-table.end(a)
table.save(a,file='mytable1.tab')