Free Statistics

of Irreproducible Research!

Author's title

Author*The author of this computation has been verified*
R Software Modulerwasp_arimabackwardselection.wasp
Title produced by softwareARIMA Backward Selection
Date of computationFri, 12 Dec 2008 09:08:38 -0700
Cite this page as followsStatistical Computations at FreeStatistics.org, Office for Research Development and Education, URL https://freestatistics.org/blog/index.php?v=date/2008/Dec/12/t12291002029bhzo1t7mm486wz.htm/, Retrieved Sun, 19 May 2024 05:15:39 +0000
Statistical Computations at FreeStatistics.org, Office for Research Development and Education, URL https://freestatistics.org/blog/index.php?pk=32859, Retrieved Sun, 19 May 2024 05:15:39 +0000
QR Codes:

Original text written by user:
IsPrivate?No (this computation is public)
User-defined keywords
Estimated Impact164
Family? (F = Feedback message, R = changed R code, M = changed R Module, P = changed Parameters, D = changed Data)
-       [ARIMA Backward Selection] [Paper - Arima Bac...] [2008-12-12 16:08:38] [98255691c21504803b38711776845ae0] [Current]
-   PD    [ARIMA Backward Selection] [Paper - ARIMA bac...] [2008-12-19 16:45:03] [7a664918911e34206ce9d0436dd7c1c8]
Feedback Forum

Post a new message
Dataseries X:
14929387,5
14717825,3
15826281,2
16301309,6
15033016,9
16998460,6
14066462,7
13328937,3
17319718,2
17586426,8
15887037,4
17935679,1
15869489
15892510,9
17556558,1
16791643
15953688,5
18144913,6
14390881
13885708,7
17332571,5
17152595,8
16003877,1
16841467,1
14783398,1
14667847,5
17714362,2
16282088
15014866,2
17722582,4
13876509,4
15495489,6
17799521,1
17920079,1
17248022,4
18813782,4
16249688,3
17823358,5
20424438,3
17814218,7
19699959,6
19776328,1
15679833,1
17119266,5
20092613
20863688,3
20925203,1
21032593
20664684,3
19711511,4
22553293,4
19498332,9
20722827,8
21321275
17960847,7
17789654,9
20003708,5
21169851,7
20422839,4
19810562,3


Summary of computational transaction
Raw Inputview raw input (R code)
Raw Outputview raw output of R engine
Computing time8 seconds
R Server'George Udny Yule' @ 72.249.76.132

\begin{tabular}{lllllllll}
\hline
Summary of computational transaction \tabularnewline
Raw Input & view raw input (R code)  \tabularnewline
Raw Output & view raw output of R engine  \tabularnewline
Computing time & 8 seconds \tabularnewline
R Server & 'George Udny Yule' @ 72.249.76.132 \tabularnewline
\hline
\end{tabular}
%Source: https://freestatistics.org/blog/index.php?pk=32859&T=0

[TABLE]
[ROW][C]Summary of computational transaction[/C][/ROW]
[ROW][C]Raw Input[/C][C]view raw input (R code) [/C][/ROW]
[ROW][C]Raw Output[/C][C]view raw output of R engine [/C][/ROW]
[ROW][C]Computing time[/C][C]8 seconds[/C][/ROW]
[ROW][C]R Server[/C][C]'George Udny Yule' @ 72.249.76.132[/C][/ROW]
[/TABLE]
Source: https://freestatistics.org/blog/index.php?pk=32859&T=0

Globally Unique Identifier (entire table): ba.freestatistics.org/blog/index.php?pk=32859&T=0

As an alternative you can also use a QR Code:  

The GUIDs for individual cells are displayed in the table below:

Summary of computational transaction
Raw Inputview raw input (R code)
Raw Outputview raw output of R engine
Computing time8 seconds
R Server'George Udny Yule' @ 72.249.76.132


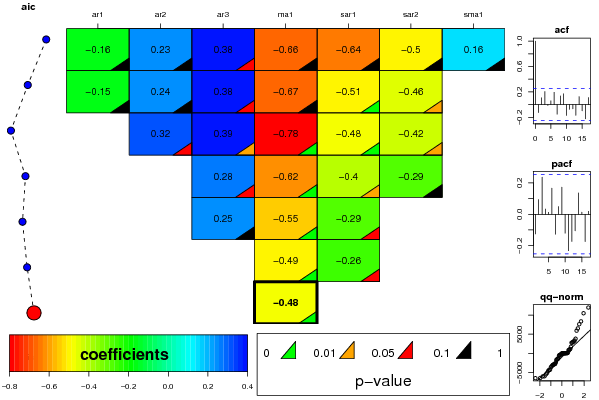
ARIMA Parameter Estimation and Backward Selection
Iterationar1ar2ar3ma1sar1sar2sma1
Estimates ( 1 )-0.15790.23230.3812-0.6643-0.6363-0.50240.1583
(p-val)(0.775 )(0.6013 )(0.0858 )(0.223 )(0.6322 )(0.2886 )(0.9243 )
Estimates ( 2 )-0.15450.24480.3844-0.6718-0.5096-0.46010
(p-val)(0.7668 )(0.5407 )(0.0691 )(0.1812 )(0.0092 )(0.0391 )(NA )
Estimates ( 3 )00.32050.3855-0.783-0.4794-0.42380
(p-val)(NA )(0.0504 )(0.0151 )(0 )(0.0084 )(0.0432 )(NA )
Estimates ( 4 )000.278-0.6152-0.4004-0.29330
(p-val)(NA )(NA )(0.0988 )(0 )(0.0279 )(0.1767 )(NA )
Estimates ( 5 )000.2484-0.5505-0.293700
(p-val)(NA )(NA )(0.1209 )(0 )(0.0573 )(NA )(NA )
Estimates ( 6 )000-0.4942-0.260600
(p-val)(NA )(NA )(NA )(0 )(0.0923 )(NA )(NA )
Estimates ( 7 )000-0.477000
(p-val)(NA )(NA )(NA )(0 )(NA )(NA )(NA )
Estimates ( 8 )NANANANANANANA
(p-val)(NA )(NA )(NA )(NA )(NA )(NA )(NA )
Estimates ( 9 )NANANANANANANA
(p-val)(NA )(NA )(NA )(NA )(NA )(NA )(NA )
Estimates ( 10 )NANANANANANANA
(p-val)(NA )(NA )(NA )(NA )(NA )(NA )(NA )
Estimates ( 11 )NANANANANANANA
(p-val)(NA )(NA )(NA )(NA )(NA )(NA )(NA )
Estimates ( 12 )NANANANANANANA
(p-val)(NA )(NA )(NA )(NA )(NA )(NA )(NA )
Estimates ( 13 )NANANANANANANA
(p-val)(NA )(NA )(NA )(NA )(NA )(NA )(NA )

\begin{tabular}{lllllllll}
\hline
ARIMA Parameter Estimation and Backward Selection \tabularnewline
Iteration & ar1 & ar2 & ar3 & ma1 & sar1 & sar2 & sma1 \tabularnewline
Estimates ( 1 ) & -0.1579 & 0.2323 & 0.3812 & -0.6643 & -0.6363 & -0.5024 & 0.1583 \tabularnewline
(p-val) & (0.775 ) & (0.6013 ) & (0.0858 ) & (0.223 ) & (0.6322 ) & (0.2886 ) & (0.9243 ) \tabularnewline
Estimates ( 2 ) & -0.1545 & 0.2448 & 0.3844 & -0.6718 & -0.5096 & -0.4601 & 0 \tabularnewline
(p-val) & (0.7668 ) & (0.5407 ) & (0.0691 ) & (0.1812 ) & (0.0092 ) & (0.0391 ) & (NA ) \tabularnewline
Estimates ( 3 ) & 0 & 0.3205 & 0.3855 & -0.783 & -0.4794 & -0.4238 & 0 \tabularnewline
(p-val) & (NA ) & (0.0504 ) & (0.0151 ) & (0 ) & (0.0084 ) & (0.0432 ) & (NA ) \tabularnewline
Estimates ( 4 ) & 0 & 0 & 0.278 & -0.6152 & -0.4004 & -0.2933 & 0 \tabularnewline
(p-val) & (NA ) & (NA ) & (0.0988 ) & (0 ) & (0.0279 ) & (0.1767 ) & (NA ) \tabularnewline
Estimates ( 5 ) & 0 & 0 & 0.2484 & -0.5505 & -0.2937 & 0 & 0 \tabularnewline
(p-val) & (NA ) & (NA ) & (0.1209 ) & (0 ) & (0.0573 ) & (NA ) & (NA ) \tabularnewline
Estimates ( 6 ) & 0 & 0 & 0 & -0.4942 & -0.2606 & 0 & 0 \tabularnewline
(p-val) & (NA ) & (NA ) & (NA ) & (0 ) & (0.0923 ) & (NA ) & (NA ) \tabularnewline
Estimates ( 7 ) & 0 & 0 & 0 & -0.477 & 0 & 0 & 0 \tabularnewline
(p-val) & (NA ) & (NA ) & (NA ) & (0 ) & (NA ) & (NA ) & (NA ) \tabularnewline
Estimates ( 8 ) & NA & NA & NA & NA & NA & NA & NA \tabularnewline
(p-val) & (NA ) & (NA ) & (NA ) & (NA ) & (NA ) & (NA ) & (NA ) \tabularnewline
Estimates ( 9 ) & NA & NA & NA & NA & NA & NA & NA \tabularnewline
(p-val) & (NA ) & (NA ) & (NA ) & (NA ) & (NA ) & (NA ) & (NA ) \tabularnewline
Estimates ( 10 ) & NA & NA & NA & NA & NA & NA & NA \tabularnewline
(p-val) & (NA ) & (NA ) & (NA ) & (NA ) & (NA ) & (NA ) & (NA ) \tabularnewline
Estimates ( 11 ) & NA & NA & NA & NA & NA & NA & NA \tabularnewline
(p-val) & (NA ) & (NA ) & (NA ) & (NA ) & (NA ) & (NA ) & (NA ) \tabularnewline
Estimates ( 12 ) & NA & NA & NA & NA & NA & NA & NA \tabularnewline
(p-val) & (NA ) & (NA ) & (NA ) & (NA ) & (NA ) & (NA ) & (NA ) \tabularnewline
Estimates ( 13 ) & NA & NA & NA & NA & NA & NA & NA \tabularnewline
(p-val) & (NA ) & (NA ) & (NA ) & (NA ) & (NA ) & (NA ) & (NA ) \tabularnewline
\hline
\end{tabular}
%Source: https://freestatistics.org/blog/index.php?pk=32859&T=1

[TABLE]
[ROW][C]ARIMA Parameter Estimation and Backward Selection[/C][/ROW]
[ROW][C]Iteration[/C][C]ar1[/C][C]ar2[/C][C]ar3[/C][C]ma1[/C][C]sar1[/C][C]sar2[/C][C]sma1[/C][/ROW]
[ROW][C]Estimates ( 1 )[/C][C]-0.1579[/C][C]0.2323[/C][C]0.3812[/C][C]-0.6643[/C][C]-0.6363[/C][C]-0.5024[/C][C]0.1583[/C][/ROW]
[ROW][C](p-val)[/C][C](0.775 )[/C][C](0.6013 )[/C][C](0.0858 )[/C][C](0.223 )[/C][C](0.6322 )[/C][C](0.2886 )[/C][C](0.9243 )[/C][/ROW]
[ROW][C]Estimates ( 2 )[/C][C]-0.1545[/C][C]0.2448[/C][C]0.3844[/C][C]-0.6718[/C][C]-0.5096[/C][C]-0.4601[/C][C]0[/C][/ROW]
[ROW][C](p-val)[/C][C](0.7668 )[/C][C](0.5407 )[/C][C](0.0691 )[/C][C](0.1812 )[/C][C](0.0092 )[/C][C](0.0391 )[/C][C](NA )[/C][/ROW]
[ROW][C]Estimates ( 3 )[/C][C]0[/C][C]0.3205[/C][C]0.3855[/C][C]-0.783[/C][C]-0.4794[/C][C]-0.4238[/C][C]0[/C][/ROW]
[ROW][C](p-val)[/C][C](NA )[/C][C](0.0504 )[/C][C](0.0151 )[/C][C](0 )[/C][C](0.0084 )[/C][C](0.0432 )[/C][C](NA )[/C][/ROW]
[ROW][C]Estimates ( 4 )[/C][C]0[/C][C]0[/C][C]0.278[/C][C]-0.6152[/C][C]-0.4004[/C][C]-0.2933[/C][C]0[/C][/ROW]
[ROW][C](p-val)[/C][C](NA )[/C][C](NA )[/C][C](0.0988 )[/C][C](0 )[/C][C](0.0279 )[/C][C](0.1767 )[/C][C](NA )[/C][/ROW]
[ROW][C]Estimates ( 5 )[/C][C]0[/C][C]0[/C][C]0.2484[/C][C]-0.5505[/C][C]-0.2937[/C][C]0[/C][C]0[/C][/ROW]
[ROW][C](p-val)[/C][C](NA )[/C][C](NA )[/C][C](0.1209 )[/C][C](0 )[/C][C](0.0573 )[/C][C](NA )[/C][C](NA )[/C][/ROW]
[ROW][C]Estimates ( 6 )[/C][C]0[/C][C]0[/C][C]0[/C][C]-0.4942[/C][C]-0.2606[/C][C]0[/C][C]0[/C][/ROW]
[ROW][C](p-val)[/C][C](NA )[/C][C](NA )[/C][C](NA )[/C][C](0 )[/C][C](0.0923 )[/C][C](NA )[/C][C](NA )[/C][/ROW]
[ROW][C]Estimates ( 7 )[/C][C]0[/C][C]0[/C][C]0[/C][C]-0.477[/C][C]0[/C][C]0[/C][C]0[/C][/ROW]
[ROW][C](p-val)[/C][C](NA )[/C][C](NA )[/C][C](NA )[/C][C](0 )[/C][C](NA )[/C][C](NA )[/C][C](NA )[/C][/ROW]
[ROW][C]Estimates ( 8 )[/C][C]NA[/C][C]NA[/C][C]NA[/C][C]NA[/C][C]NA[/C][C]NA[/C][C]NA[/C][/ROW]
[ROW][C](p-val)[/C][C](NA )[/C][C](NA )[/C][C](NA )[/C][C](NA )[/C][C](NA )[/C][C](NA )[/C][C](NA )[/C][/ROW]
[ROW][C]Estimates ( 9 )[/C][C]NA[/C][C]NA[/C][C]NA[/C][C]NA[/C][C]NA[/C][C]NA[/C][C]NA[/C][/ROW]
[ROW][C](p-val)[/C][C](NA )[/C][C](NA )[/C][C](NA )[/C][C](NA )[/C][C](NA )[/C][C](NA )[/C][C](NA )[/C][/ROW]
[ROW][C]Estimates ( 10 )[/C][C]NA[/C][C]NA[/C][C]NA[/C][C]NA[/C][C]NA[/C][C]NA[/C][C]NA[/C][/ROW]
[ROW][C](p-val)[/C][C](NA )[/C][C](NA )[/C][C](NA )[/C][C](NA )[/C][C](NA )[/C][C](NA )[/C][C](NA )[/C][/ROW]
[ROW][C]Estimates ( 11 )[/C][C]NA[/C][C]NA[/C][C]NA[/C][C]NA[/C][C]NA[/C][C]NA[/C][C]NA[/C][/ROW]
[ROW][C](p-val)[/C][C](NA )[/C][C](NA )[/C][C](NA )[/C][C](NA )[/C][C](NA )[/C][C](NA )[/C][C](NA )[/C][/ROW]
[ROW][C]Estimates ( 12 )[/C][C]NA[/C][C]NA[/C][C]NA[/C][C]NA[/C][C]NA[/C][C]NA[/C][C]NA[/C][/ROW]
[ROW][C](p-val)[/C][C](NA )[/C][C](NA )[/C][C](NA )[/C][C](NA )[/C][C](NA )[/C][C](NA )[/C][C](NA )[/C][/ROW]
[ROW][C]Estimates ( 13 )[/C][C]NA[/C][C]NA[/C][C]NA[/C][C]NA[/C][C]NA[/C][C]NA[/C][C]NA[/C][/ROW]
[ROW][C](p-val)[/C][C](NA )[/C][C](NA )[/C][C](NA )[/C][C](NA )[/C][C](NA )[/C][C](NA )[/C][C](NA )[/C][/ROW]
[/TABLE]
Source: https://freestatistics.org/blog/index.php?pk=32859&T=1

Globally Unique Identifier (entire table): ba.freestatistics.org/blog/index.php?pk=32859&T=1

As an alternative you can also use a QR Code:  

The GUIDs for individual cells are displayed in the table below:

ARIMA Parameter Estimation and Backward Selection
Iterationar1ar2ar3ma1sar1sar2sma1
Estimates ( 1 )-0.15790.23230.3812-0.6643-0.6363-0.50240.1583
(p-val)(0.775 )(0.6013 )(0.0858 )(0.223 )(0.6322 )(0.2886 )(0.9243 )
Estimates ( 2 )-0.15450.24480.3844-0.6718-0.5096-0.46010
(p-val)(0.7668 )(0.5407 )(0.0691 )(0.1812 )(0.0092 )(0.0391 )(NA )
Estimates ( 3 )00.32050.3855-0.783-0.4794-0.42380
(p-val)(NA )(0.0504 )(0.0151 )(0 )(0.0084 )(0.0432 )(NA )
Estimates ( 4 )000.278-0.6152-0.4004-0.29330
(p-val)(NA )(NA )(0.0988 )(0 )(0.0279 )(0.1767 )(NA )
Estimates ( 5 )000.2484-0.5505-0.293700
(p-val)(NA )(NA )(0.1209 )(0 )(0.0573 )(NA )(NA )
Estimates ( 6 )000-0.4942-0.260600
(p-val)(NA )(NA )(NA )(0 )(0.0923 )(NA )(NA )
Estimates ( 7 )000-0.477000
(p-val)(NA )(NA )(NA )(0 )(NA )(NA )(NA )
Estimates ( 8 )NANANANANANANA
(p-val)(NA )(NA )(NA )(NA )(NA )(NA )(NA )
Estimates ( 9 )NANANANANANANA
(p-val)(NA )(NA )(NA )(NA )(NA )(NA )(NA )
Estimates ( 10 )NANANANANANANA
(p-val)(NA )(NA )(NA )(NA )(NA )(NA )(NA )
Estimates ( 11 )NANANANANANANA
(p-val)(NA )(NA )(NA )(NA )(NA )(NA )(NA )
Estimates ( 12 )NANANANANANANA
(p-val)(NA )(NA )(NA )(NA )(NA )(NA )(NA )
Estimates ( 13 )NANANANANANANA
(p-val)(NA )(NA )(NA )(NA )(NA )(NA )(NA )


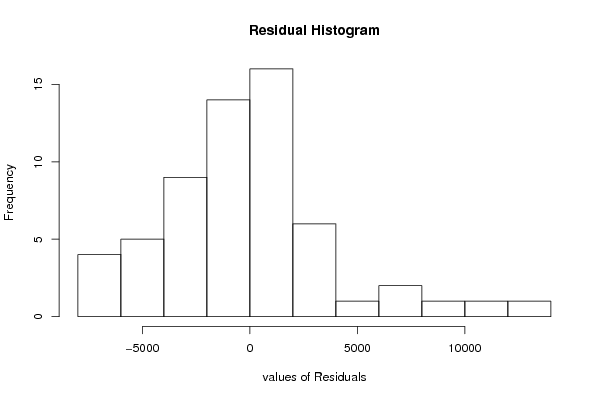
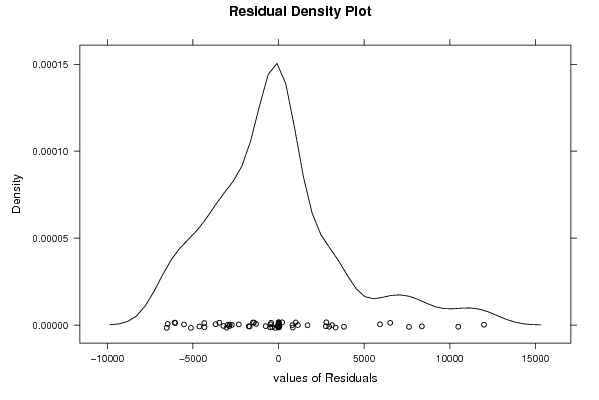
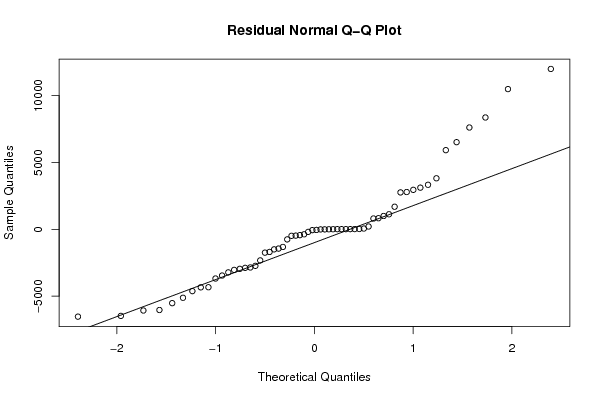
Estimated ARIMA Residuals
Value
-369.769336553112
1000.47687552991
2793.03747406254
-4330.77391951505
-57.4704810579128
834.2692486747
-3218.06836595077
-432.030315192404
-2880.15209150067
-3455.45410950568
810.762340736176
-5120.57686440339
-2850.55754186407
-1742.47830868088
6523.32991236064
-1496.48110490576
-2322.26525784108
1693.08389345869
-750.556335847167
10496.8526992682
-1316.16209376941
214.107384186287
3119.76949998310
3333.82975133262
-468.647280139569
7620.91921535839
2764.36790653075
-4621.41414668021
12002.2954228014
-6034.45477132922
-3678.95797365055
-190.033125525707
1129.16489358581
3821.02021027567
5925.85676980798
-3033.40625225744
8370.33329425831
-5521.6388134563
-2729.83333437853
-4337.77096494098
-1437.27401220503
-1689.74254105819
2957.24332929929
-6531.36303044845
-6071.67843036639
-482.912106746633
-2953.76084408342
-6475.2865581761

\begin{tabular}{lllllllll}
\hline
Estimated ARIMA Residuals \tabularnewline
Value \tabularnewline
-369.769336553112 \tabularnewline
1000.47687552991 \tabularnewline
2793.03747406254 \tabularnewline
-4330.77391951505 \tabularnewline
-57.4704810579128 \tabularnewline
834.2692486747 \tabularnewline
-3218.06836595077 \tabularnewline
-432.030315192404 \tabularnewline
-2880.15209150067 \tabularnewline
-3455.45410950568 \tabularnewline
810.762340736176 \tabularnewline
-5120.57686440339 \tabularnewline
-2850.55754186407 \tabularnewline
-1742.47830868088 \tabularnewline
6523.32991236064 \tabularnewline
-1496.48110490576 \tabularnewline
-2322.26525784108 \tabularnewline
1693.08389345869 \tabularnewline
-750.556335847167 \tabularnewline
10496.8526992682 \tabularnewline
-1316.16209376941 \tabularnewline
214.107384186287 \tabularnewline
3119.76949998310 \tabularnewline
3333.82975133262 \tabularnewline
-468.647280139569 \tabularnewline
7620.91921535839 \tabularnewline
2764.36790653075 \tabularnewline
-4621.41414668021 \tabularnewline
12002.2954228014 \tabularnewline
-6034.45477132922 \tabularnewline
-3678.95797365055 \tabularnewline
-190.033125525707 \tabularnewline
1129.16489358581 \tabularnewline
3821.02021027567 \tabularnewline
5925.85676980798 \tabularnewline
-3033.40625225744 \tabularnewline
8370.33329425831 \tabularnewline
-5521.6388134563 \tabularnewline
-2729.83333437853 \tabularnewline
-4337.77096494098 \tabularnewline
-1437.27401220503 \tabularnewline
-1689.74254105819 \tabularnewline
2957.24332929929 \tabularnewline
-6531.36303044845 \tabularnewline
-6071.67843036639 \tabularnewline
-482.912106746633 \tabularnewline
-2953.76084408342 \tabularnewline
-6475.2865581761 \tabularnewline
\hline
\end{tabular}
%Source: https://freestatistics.org/blog/index.php?pk=32859&T=2

[TABLE]
[ROW][C]Estimated ARIMA Residuals[/C][/ROW]
[ROW][C]Value[/C][/ROW]
[ROW][C]-369.769336553112[/C][/ROW]
[ROW][C]1000.47687552991[/C][/ROW]
[ROW][C]2793.03747406254[/C][/ROW]
[ROW][C]-4330.77391951505[/C][/ROW]
[ROW][C]-57.4704810579128[/C][/ROW]
[ROW][C]834.2692486747[/C][/ROW]
[ROW][C]-3218.06836595077[/C][/ROW]
[ROW][C]-432.030315192404[/C][/ROW]
[ROW][C]-2880.15209150067[/C][/ROW]
[ROW][C]-3455.45410950568[/C][/ROW]
[ROW][C]810.762340736176[/C][/ROW]
[ROW][C]-5120.57686440339[/C][/ROW]
[ROW][C]-2850.55754186407[/C][/ROW]
[ROW][C]-1742.47830868088[/C][/ROW]
[ROW][C]6523.32991236064[/C][/ROW]
[ROW][C]-1496.48110490576[/C][/ROW]
[ROW][C]-2322.26525784108[/C][/ROW]
[ROW][C]1693.08389345869[/C][/ROW]
[ROW][C]-750.556335847167[/C][/ROW]
[ROW][C]10496.8526992682[/C][/ROW]
[ROW][C]-1316.16209376941[/C][/ROW]
[ROW][C]214.107384186287[/C][/ROW]
[ROW][C]3119.76949998310[/C][/ROW]
[ROW][C]3333.82975133262[/C][/ROW]
[ROW][C]-468.647280139569[/C][/ROW]
[ROW][C]7620.91921535839[/C][/ROW]
[ROW][C]2764.36790653075[/C][/ROW]
[ROW][C]-4621.41414668021[/C][/ROW]
[ROW][C]12002.2954228014[/C][/ROW]
[ROW][C]-6034.45477132922[/C][/ROW]
[ROW][C]-3678.95797365055[/C][/ROW]
[ROW][C]-190.033125525707[/C][/ROW]
[ROW][C]1129.16489358581[/C][/ROW]
[ROW][C]3821.02021027567[/C][/ROW]
[ROW][C]5925.85676980798[/C][/ROW]
[ROW][C]-3033.40625225744[/C][/ROW]
[ROW][C]8370.33329425831[/C][/ROW]
[ROW][C]-5521.6388134563[/C][/ROW]
[ROW][C]-2729.83333437853[/C][/ROW]
[ROW][C]-4337.77096494098[/C][/ROW]
[ROW][C]-1437.27401220503[/C][/ROW]
[ROW][C]-1689.74254105819[/C][/ROW]
[ROW][C]2957.24332929929[/C][/ROW]
[ROW][C]-6531.36303044845[/C][/ROW]
[ROW][C]-6071.67843036639[/C][/ROW]
[ROW][C]-482.912106746633[/C][/ROW]
[ROW][C]-2953.76084408342[/C][/ROW]
[ROW][C]-6475.2865581761[/C][/ROW]
[/TABLE]
Source: https://freestatistics.org/blog/index.php?pk=32859&T=2

Globally Unique Identifier (entire table): ba.freestatistics.org/blog/index.php?pk=32859&T=2

As an alternative you can also use a QR Code:  

The GUIDs for individual cells are displayed in the table below:

Estimated ARIMA Residuals
Value
-369.769336553112
1000.47687552991
2793.03747406254
-4330.77391951505
-57.4704810579128
834.2692486747
-3218.06836595077
-432.030315192404
-2880.15209150067
-3455.45410950568
810.762340736176
-5120.57686440339
-2850.55754186407
-1742.47830868088
6523.32991236064
-1496.48110490576
-2322.26525784108
1693.08389345869
-750.556335847167
10496.8526992682
-1316.16209376941
214.107384186287
3119.76949998310
3333.82975133262
-468.647280139569
7620.91921535839
2764.36790653075
-4621.41414668021
12002.2954228014
-6034.45477132922
-3678.95797365055
-190.033125525707
1129.16489358581
3821.02021027567
5925.85676980798
-3033.40625225744
8370.33329425831
-5521.6388134563
-2729.83333437853
-4337.77096494098
-1437.27401220503
-1689.74254105819
2957.24332929929
-6531.36303044845
-6071.67843036639
-482.912106746633
-2953.76084408342
-6475.2865581761


Parameters (Session):
par1 = FALSE ; par2 = 0.7 ; par3 = 1 ; par4 = 1 ; par5 = 12 ; par6 = 3 ; par7 = 1 ; par8 = 2 ; par9 = 1 ;
Parameters (R input):
par1 = FALSE ; par2 = 0.7 ; par3 = 1 ; par4 = 1 ; par5 = 12 ; par6 = 3 ; par7 = 1 ; par8 = 2 ; par9 = 1 ;
R code (references can be found in the software module):
library(lattice)
if (par1 == 'TRUE') par1 <- TRUE
if (par1 == 'FALSE') par1 <- FALSE
par2 <- as.numeric(par2) #Box-Cox lambda transformation parameter
par3 <- as.numeric(par3) #degree of non-seasonal differencing
par4 <- as.numeric(par4) #degree of seasonal differencing
par5 <- as.numeric(par5) #seasonal period
par6 <- as.numeric(par6) #degree (p) of the non-seasonal AR(p) polynomial
par7 <- as.numeric(par7) #degree (q) of the non-seasonal MA(q) polynomial
par8 <- as.numeric(par8) #degree (P) of the seasonal AR(P) polynomial
par9 <- as.numeric(par9) #degree (Q) of the seasonal MA(Q) polynomial
armaGR <- function(arima.out, names, n){
try1 <- arima.out$coef
try2 <- sqrt(diag(arima.out$var.coef))
try.data.frame <- data.frame(matrix(NA,ncol=4,nrow=length(names)))
dimnames(try.data.frame) <- list(names,c('coef','std','tstat','pv'))
try.data.frame[,1] <- try1
for(i in 1:length(try2)) try.data.frame[which(rownames(try.data.frame)==names(try2)[i]),2] <- try2[i]
try.data.frame[,3] <- try.data.frame[,1] / try.data.frame[,2]
try.data.frame[,4] <- round((1-pt(abs(try.data.frame[,3]),df=n-(length(try2)+1)))*2,5)
vector <- rep(NA,length(names))
vector[is.na(try.data.frame[,4])] <- 0
maxi <- which.max(try.data.frame[,4])
continue <- max(try.data.frame[,4],na.rm=TRUE) > .05
vector[maxi] <- 0
list(summary=try.data.frame,next.vector=vector,continue=continue)
}
arimaSelect <- function(series, order=c(13,0,0), seasonal=list(order=c(2,0,0),period=12), include.mean=F){
nrc <- order[1]+order[3]+seasonal$order[1]+seasonal$order[3]
coeff <- matrix(NA, nrow=nrc*2, ncol=nrc)
pval <- matrix(NA, nrow=nrc*2, ncol=nrc)
mylist <- rep(list(NULL), nrc)
names <- NULL
if(order[1] > 0) names <- paste('ar',1:order[1],sep='')
if(order[3] > 0) names <- c( names , paste('ma',1:order[3],sep='') )
if(seasonal$order[1] > 0) names <- c(names, paste('sar',1:seasonal$order[1],sep=''))
if(seasonal$order[3] > 0) names <- c(names, paste('sma',1:seasonal$order[3],sep=''))
arima.out <- arima(series, order=order, seasonal=seasonal, include.mean=include.mean, method='ML')
mylist[[1]] <- arima.out
last.arma <- armaGR(arima.out, names, length(series))
mystop <- FALSE
i <- 1
coeff[i,] <- last.arma[[1]][,1]
pval [i,] <- last.arma[[1]][,4]
i <- 2
aic <- arima.out$aic
while(!mystop){
mylist[[i]] <- arima.out
arima.out <- arima(series, order=order, seasonal=seasonal, include.mean=include.mean, method='ML', fixed=last.arma$next.vector)
aic <- c(aic, arima.out$aic)
last.arma <- armaGR(arima.out, names, length(series))
mystop <- !last.arma$continue
coeff[i,] <- last.arma[[1]][,1]
pval [i,] <- last.arma[[1]][,4]
i <- i+1
}
list(coeff, pval, mylist, aic=aic)
}
arimaSelectplot <- function(arimaSelect.out,noms,choix){
noms <- names(arimaSelect.out[[3]][[1]]$coef)
coeff <- arimaSelect.out[[1]]
k <- min(which(is.na(coeff[,1])))-1
coeff <- coeff[1:k,]
pval <- arimaSelect.out[[2]][1:k,]
aic <- arimaSelect.out$aic[1:k]
coeff[coeff==0] <- NA
n <- ncol(coeff)
if(missing(choix)) choix <- k
layout(matrix(c(1,1,1,2,
3,3,3,2,
3,3,3,4,
5,6,7,7),nr=4),
widths=c(10,35,45,15),
heights=c(30,30,15,15))
couleurs <- rainbow(75)[1:50]#(50)
ticks <- pretty(coeff)
par(mar=c(1,1,3,1))
plot(aic,k:1-.5,type='o',pch=21,bg='blue',cex=2,axes=F,lty=2,xpd=NA)
points(aic[choix],k-choix+.5,pch=21,cex=4,bg=2,xpd=NA)
title('aic',line=2)
par(mar=c(3,0,0,0))
plot(0,axes=F,xlab='',ylab='',xlim=range(ticks),ylim=c(.1,1))
rect(xleft = min(ticks) + (0:49)/50*(max(ticks)-min(ticks)),
xright = min(ticks) + (1:50)/50*(max(ticks)-min(ticks)),
ytop = rep(1,50),
ybottom= rep(0,50),col=couleurs,border=NA)
axis(1,ticks)
rect(xleft=min(ticks),xright=max(ticks),ytop=1,ybottom=0)
text(mean(coeff,na.rm=T),.5,'coefficients',cex=2,font=2)
par(mar=c(1,1,3,1))
image(1:n,1:k,t(coeff[k:1,]),axes=F,col=couleurs,zlim=range(ticks))
for(i in 1:n) for(j in 1:k) if(!is.na(coeff[j,i])) {
if(pval[j,i]<.01) symb = 'green'
else if( (pval[j,i]<.05) & (pval[j,i]>=.01)) symb = 'orange'
else if( (pval[j,i]<.1) & (pval[j,i]>=.05)) symb = 'red'
else symb = 'black'
polygon(c(i+.5 ,i+.2 ,i+.5 ,i+.5),
c(k-j+0.5,k-j+0.5,k-j+0.8,k-j+0.5),
col=symb)
if(j==choix) {
rect(xleft=i-.5,
xright=i+.5,
ybottom=k-j+1.5,
ytop=k-j+.5,
lwd=4)
text(i,
k-j+1,
round(coeff[j,i],2),
cex=1.2,
font=2)
}
else{
rect(xleft=i-.5,xright=i+.5,ybottom=k-j+1.5,ytop=k-j+.5)
text(i,k-j+1,round(coeff[j,i],2),cex=1.2,font=1)
}
}
axis(3,1:n,noms)
par(mar=c(0.5,0,0,0.5))
plot(0,axes=F,xlab='',ylab='',type='n',xlim=c(0,8),ylim=c(-.2,.8))
cols <- c('green','orange','red','black')
niv <- c('0','0.01','0.05','0.1')
for(i in 0:3){
polygon(c(1+2*i ,1+2*i ,1+2*i-.5 ,1+2*i),
c(.4 ,.7 , .4 , .4),
col=cols[i+1])
text(2*i,0.5,niv[i+1],cex=1.5)
}
text(8,.5,1,cex=1.5)
text(4,0,'p-value',cex=2)
box()
residus <- arimaSelect.out[[3]][[choix]]$res
par(mar=c(1,2,4,1))
acf(residus,main='')
title('acf',line=.5)
par(mar=c(1,2,4,1))
pacf(residus,main='')
title('pacf',line=.5)
par(mar=c(2,2,4,1))
qqnorm(residus,main='')
title('qq-norm',line=.5)
qqline(residus)
residus
}
if (par2 == 0) x <- log(x)
if (par2 != 0) x <- x^par2
(selection <- arimaSelect(x, order=c(par6,par3,par7), seasonal=list(order=c(par8,par4,par9), period=par5)))
bitmap(file='test1.png')
resid <- arimaSelectplot(selection)
dev.off()
resid
bitmap(file='test2.png')
acf(resid,length(resid)/2, main='Residual Autocorrelation Function')
dev.off()
bitmap(file='test3.png')
pacf(resid,length(resid)/2, main='Residual Partial Autocorrelation Function')
dev.off()
bitmap(file='test4.png')
cpgram(resid, main='Residual Cumulative Periodogram')
dev.off()
bitmap(file='test5.png')
hist(resid, main='Residual Histogram', xlab='values of Residuals')
dev.off()
bitmap(file='test6.png')
densityplot(~resid,col='black',main='Residual Density Plot', xlab='values of Residuals')
dev.off()
bitmap(file='test7.png')
qqnorm(resid, main='Residual Normal Q-Q Plot')
qqline(resid)
dev.off()
ncols <- length(selection[[1]][1,])
nrows <- length(selection[[2]][,1])-1
load(file='createtable')
a<-table.start()
a<-table.row.start(a)
a<-table.element(a,'ARIMA Parameter Estimation and Backward Selection', ncols+1,TRUE)
a<-table.row.end(a)
a<-table.row.start(a)
a<-table.element(a,'Iteration', header=TRUE)
for (i in 1:ncols) {
a<-table.element(a,names(selection[[3]][[1]]$coef)[i],header=TRUE)
}
a<-table.row.end(a)
for (j in 1:nrows) {
a<-table.row.start(a)
mydum <- 'Estimates ('
mydum <- paste(mydum,j)
mydum <- paste(mydum,')')
a<-table.element(a,mydum, header=TRUE)
for (i in 1:ncols) {
a<-table.element(a,round(selection[[1]][j,i],4))
}
a<-table.row.end(a)
a<-table.row.start(a)
a<-table.element(a,'(p-val)', header=TRUE)
for (i in 1:ncols) {
mydum <- '('
mydum <- paste(mydum,round(selection[[2]][j,i],4),sep='')
mydum <- paste(mydum,')')
a<-table.element(a,mydum)
}
a<-table.row.end(a)
}
a<-table.end(a)
table.save(a,file='mytable.tab')
a<-table.start()
a<-table.row.start(a)
a<-table.element(a,'Estimated ARIMA Residuals', 1,TRUE)
a<-table.row.end(a)
a<-table.row.start(a)
a<-table.element(a,'Value', 1,TRUE)
a<-table.row.end(a)
for (i in (par4*par5+par3):length(resid)) {
a<-table.row.start(a)
a<-table.element(a,resid[i])
a<-table.row.end(a)
}
a<-table.end(a)
table.save(a,file='mytable1.tab')