Free Statistics

of Irreproducible Research!

Author's title

Author*The author of this computation has been verified*
R Software Modulerwasp_autocorrelation.wasp
Title produced by software(Partial) Autocorrelation Function
Date of computationFri, 12 Dec 2008 07:03:24 -0700
Cite this page as followsStatistical Computations at FreeStatistics.org, Office for Research Development and Education, URL https://freestatistics.org/blog/index.php?v=date/2008/Dec/12/t1229090636lcbegv99f3ov6ac.htm/, Retrieved Sun, 19 May 2024 06:08:09 +0000
Statistical Computations at FreeStatistics.org, Office for Research Development and Education, URL https://freestatistics.org/blog/index.php?pk=32751, Retrieved Sun, 19 May 2024 06:08:09 +0000
QR Codes:

Original text written by user:
IsPrivate?No (this computation is public)
User-defined keywords
Estimated Impact219
Family? (F = Feedback message, R = changed R code, M = changed R Module, P = changed Parameters, D = changed Data)
F     [Univariate Data Series] [Airline data] [2007-10-18 09:58:47] [42daae401fd3def69a25014f2252b4c2]
F RMPD  [Standard Deviation-Mean Plot] [vraag 5] [2008-11-29 13:37:39] [c45c87b96bbf32ffc2144fc37d767b2e]
- RMPD      [(Partial) Autocorrelation Function] [ACF] [2008-12-12 14:03:24] [3dc594a6c62226e1e98766c4d385bfaa] [Current]
-    D        [(Partial) Autocorrelation Function] [acf] [2008-12-16 22:57:31] [c45c87b96bbf32ffc2144fc37d767b2e]
Feedback Forum

Post a new message
Dataseries X:
493
481
462
457
442
439
488
521
501
485
464
460
467
460
448
443
436
431
484
510
513
503
471
471
476
475
470
461
455
456
517
525
523
519
509
512
519
517
510
509
501
507
569
580
578
565
547
555
562
561
555
544
537
543
594
611
613
611
594
595
591
589
584
573
567
569
621
629
628
612
595
597
593
590
580
574
573
573
620
626
620
588
566
557
561
549
532
526
511
499
555
565
542
527
510
514
517
508
493
490
469
478


Summary of computational transaction
Raw Inputview raw input (R code)
Raw Outputview raw output of R engine
Computing time2 seconds
R Server'Gwilym Jenkins' @ 72.249.127.135

\begin{tabular}{lllllllll}
\hline
Summary of computational transaction \tabularnewline
Raw Input & view raw input (R code)  \tabularnewline
Raw Output & view raw output of R engine  \tabularnewline
Computing time & 2 seconds \tabularnewline
R Server & 'Gwilym Jenkins' @ 72.249.127.135 \tabularnewline
\hline
\end{tabular}
%Source: https://freestatistics.org/blog/index.php?pk=32751&T=0

[TABLE]
[ROW][C]Summary of computational transaction[/C][/ROW]
[ROW][C]Raw Input[/C][C]view raw input (R code) [/C][/ROW]
[ROW][C]Raw Output[/C][C]view raw output of R engine [/C][/ROW]
[ROW][C]Computing time[/C][C]2 seconds[/C][/ROW]
[ROW][C]R Server[/C][C]'Gwilym Jenkins' @ 72.249.127.135[/C][/ROW]
[/TABLE]
Source: https://freestatistics.org/blog/index.php?pk=32751&T=0

Globally Unique Identifier (entire table): ba.freestatistics.org/blog/index.php?pk=32751&T=0

As an alternative you can also use a QR Code:  

The GUIDs for individual cells are displayed in the table below:

Summary of computational transaction
Raw Inputview raw input (R code)
Raw Outputview raw output of R engine
Computing time2 seconds
R Server'Gwilym Jenkins' @ 72.249.127.135


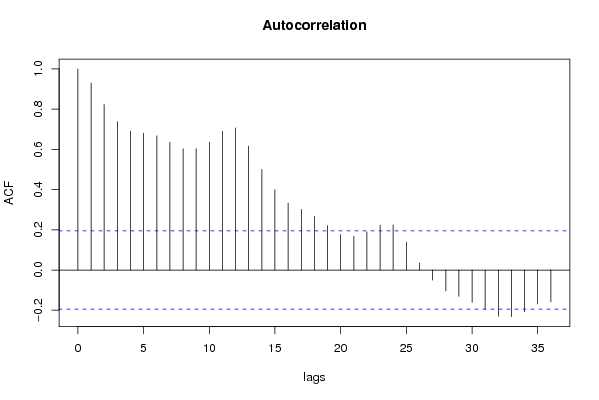
Autocorrelation Function
Time lag kACF(k)T-STATP-value
10.9299839.39240
20.8227278.30910
30.7377587.4510
40.6902736.97140
50.680676.87440
60.6675116.74150
70.6356126.41940
80.6028736.08870
90.6032916.09290
100.6359216.42250
110.6895426.9640
120.7062587.13290
130.6162926.22420
140.5001945.05171e-06
150.3989624.02935.4e-05
160.3321423.35450.000559
170.3009173.03910.001507
180.2668522.69510.004116
190.2208512.23050.013953
200.1763861.78140.038911
210.1672091.68870.047164
220.1890631.90940.029508
230.2231362.25360.013182
240.2240792.26310.012874
250.1380321.39410.083166
260.034950.3530.362417
27-0.049803-0.5030.308031
28-0.104338-1.05380.147241
29-0.131004-1.32310.094384
30-0.16088-1.62480.053644
31-0.19631-1.98260.025049
32-0.23006-2.32350.011069
33-0.232066-2.34380.010515
34-0.207275-2.09340.019398
35-0.168873-1.70550.045569
36-0.158153-1.59730.056649

\begin{tabular}{lllllllll}
\hline
Autocorrelation Function \tabularnewline
Time lag k & ACF(k) & T-STAT & P-value \tabularnewline
1 & 0.929983 & 9.3924 & 0 \tabularnewline
2 & 0.822727 & 8.3091 & 0 \tabularnewline
3 & 0.737758 & 7.451 & 0 \tabularnewline
4 & 0.690273 & 6.9714 & 0 \tabularnewline
5 & 0.68067 & 6.8744 & 0 \tabularnewline
6 & 0.667511 & 6.7415 & 0 \tabularnewline
7 & 0.635612 & 6.4194 & 0 \tabularnewline
8 & 0.602873 & 6.0887 & 0 \tabularnewline
9 & 0.603291 & 6.0929 & 0 \tabularnewline
10 & 0.635921 & 6.4225 & 0 \tabularnewline
11 & 0.689542 & 6.964 & 0 \tabularnewline
12 & 0.706258 & 7.1329 & 0 \tabularnewline
13 & 0.616292 & 6.2242 & 0 \tabularnewline
14 & 0.500194 & 5.0517 & 1e-06 \tabularnewline
15 & 0.398962 & 4.0293 & 5.4e-05 \tabularnewline
16 & 0.332142 & 3.3545 & 0.000559 \tabularnewline
17 & 0.300917 & 3.0391 & 0.001507 \tabularnewline
18 & 0.266852 & 2.6951 & 0.004116 \tabularnewline
19 & 0.220851 & 2.2305 & 0.013953 \tabularnewline
20 & 0.176386 & 1.7814 & 0.038911 \tabularnewline
21 & 0.167209 & 1.6887 & 0.047164 \tabularnewline
22 & 0.189063 & 1.9094 & 0.029508 \tabularnewline
23 & 0.223136 & 2.2536 & 0.013182 \tabularnewline
24 & 0.224079 & 2.2631 & 0.012874 \tabularnewline
25 & 0.138032 & 1.3941 & 0.083166 \tabularnewline
26 & 0.03495 & 0.353 & 0.362417 \tabularnewline
27 & -0.049803 & -0.503 & 0.308031 \tabularnewline
28 & -0.104338 & -1.0538 & 0.147241 \tabularnewline
29 & -0.131004 & -1.3231 & 0.094384 \tabularnewline
30 & -0.16088 & -1.6248 & 0.053644 \tabularnewline
31 & -0.19631 & -1.9826 & 0.025049 \tabularnewline
32 & -0.23006 & -2.3235 & 0.011069 \tabularnewline
33 & -0.232066 & -2.3438 & 0.010515 \tabularnewline
34 & -0.207275 & -2.0934 & 0.019398 \tabularnewline
35 & -0.168873 & -1.7055 & 0.045569 \tabularnewline
36 & -0.158153 & -1.5973 & 0.056649 \tabularnewline
\hline
\end{tabular}
%Source: https://freestatistics.org/blog/index.php?pk=32751&T=1

[TABLE]
[ROW][C]Autocorrelation Function[/C][/ROW]
[ROW][C]Time lag k[/C][C]ACF(k)[/C][C]T-STAT[/C][C]P-value[/C][/ROW]
[ROW][C]1[/C][C]0.929983[/C][C]9.3924[/C][C]0[/C][/ROW]
[ROW][C]2[/C][C]0.822727[/C][C]8.3091[/C][C]0[/C][/ROW]
[ROW][C]3[/C][C]0.737758[/C][C]7.451[/C][C]0[/C][/ROW]
[ROW][C]4[/C][C]0.690273[/C][C]6.9714[/C][C]0[/C][/ROW]
[ROW][C]5[/C][C]0.68067[/C][C]6.8744[/C][C]0[/C][/ROW]
[ROW][C]6[/C][C]0.667511[/C][C]6.7415[/C][C]0[/C][/ROW]
[ROW][C]7[/C][C]0.635612[/C][C]6.4194[/C][C]0[/C][/ROW]
[ROW][C]8[/C][C]0.602873[/C][C]6.0887[/C][C]0[/C][/ROW]
[ROW][C]9[/C][C]0.603291[/C][C]6.0929[/C][C]0[/C][/ROW]
[ROW][C]10[/C][C]0.635921[/C][C]6.4225[/C][C]0[/C][/ROW]
[ROW][C]11[/C][C]0.689542[/C][C]6.964[/C][C]0[/C][/ROW]
[ROW][C]12[/C][C]0.706258[/C][C]7.1329[/C][C]0[/C][/ROW]
[ROW][C]13[/C][C]0.616292[/C][C]6.2242[/C][C]0[/C][/ROW]
[ROW][C]14[/C][C]0.500194[/C][C]5.0517[/C][C]1e-06[/C][/ROW]
[ROW][C]15[/C][C]0.398962[/C][C]4.0293[/C][C]5.4e-05[/C][/ROW]
[ROW][C]16[/C][C]0.332142[/C][C]3.3545[/C][C]0.000559[/C][/ROW]
[ROW][C]17[/C][C]0.300917[/C][C]3.0391[/C][C]0.001507[/C][/ROW]
[ROW][C]18[/C][C]0.266852[/C][C]2.6951[/C][C]0.004116[/C][/ROW]
[ROW][C]19[/C][C]0.220851[/C][C]2.2305[/C][C]0.013953[/C][/ROW]
[ROW][C]20[/C][C]0.176386[/C][C]1.7814[/C][C]0.038911[/C][/ROW]
[ROW][C]21[/C][C]0.167209[/C][C]1.6887[/C][C]0.047164[/C][/ROW]
[ROW][C]22[/C][C]0.189063[/C][C]1.9094[/C][C]0.029508[/C][/ROW]
[ROW][C]23[/C][C]0.223136[/C][C]2.2536[/C][C]0.013182[/C][/ROW]
[ROW][C]24[/C][C]0.224079[/C][C]2.2631[/C][C]0.012874[/C][/ROW]
[ROW][C]25[/C][C]0.138032[/C][C]1.3941[/C][C]0.083166[/C][/ROW]
[ROW][C]26[/C][C]0.03495[/C][C]0.353[/C][C]0.362417[/C][/ROW]
[ROW][C]27[/C][C]-0.049803[/C][C]-0.503[/C][C]0.308031[/C][/ROW]
[ROW][C]28[/C][C]-0.104338[/C][C]-1.0538[/C][C]0.147241[/C][/ROW]
[ROW][C]29[/C][C]-0.131004[/C][C]-1.3231[/C][C]0.094384[/C][/ROW]
[ROW][C]30[/C][C]-0.16088[/C][C]-1.6248[/C][C]0.053644[/C][/ROW]
[ROW][C]31[/C][C]-0.19631[/C][C]-1.9826[/C][C]0.025049[/C][/ROW]
[ROW][C]32[/C][C]-0.23006[/C][C]-2.3235[/C][C]0.011069[/C][/ROW]
[ROW][C]33[/C][C]-0.232066[/C][C]-2.3438[/C][C]0.010515[/C][/ROW]
[ROW][C]34[/C][C]-0.207275[/C][C]-2.0934[/C][C]0.019398[/C][/ROW]
[ROW][C]35[/C][C]-0.168873[/C][C]-1.7055[/C][C]0.045569[/C][/ROW]
[ROW][C]36[/C][C]-0.158153[/C][C]-1.5973[/C][C]0.056649[/C][/ROW]
[/TABLE]
Source: https://freestatistics.org/blog/index.php?pk=32751&T=1

Globally Unique Identifier (entire table): ba.freestatistics.org/blog/index.php?pk=32751&T=1

As an alternative you can also use a QR Code:  

The GUIDs for individual cells are displayed in the table below:

Autocorrelation Function
Time lag kACF(k)T-STATP-value
10.9299839.39240
20.8227278.30910
30.7377587.4510
40.6902736.97140
50.680676.87440
60.6675116.74150
70.6356126.41940
80.6028736.08870
90.6032916.09290
100.6359216.42250
110.6895426.9640
120.7062587.13290
130.6162926.22420
140.5001945.05171e-06
150.3989624.02935.4e-05
160.3321423.35450.000559
170.3009173.03910.001507
180.2668522.69510.004116
190.2208512.23050.013953
200.1763861.78140.038911
210.1672091.68870.047164
220.1890631.90940.029508
230.2231362.25360.013182
240.2240792.26310.012874
250.1380321.39410.083166
260.034950.3530.362417
27-0.049803-0.5030.308031
28-0.104338-1.05380.147241
29-0.131004-1.32310.094384
30-0.16088-1.62480.053644
31-0.19631-1.98260.025049
32-0.23006-2.32350.011069
33-0.232066-2.34380.010515
34-0.207275-2.09340.019398
35-0.168873-1.70550.045569
36-0.158153-1.59730.056649


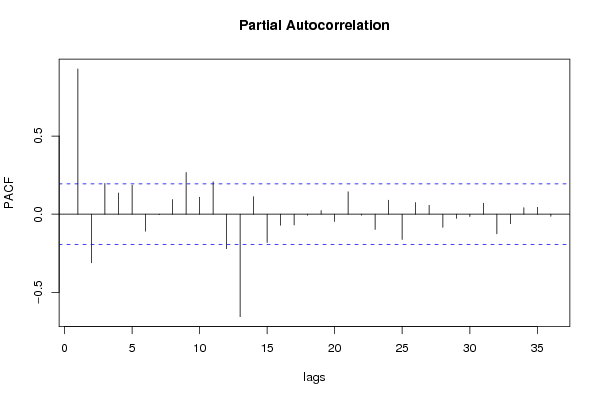
Partial Autocorrelation Function
Time lag kPACF(k)T-STATP-value
10.9299839.39240
2-0.311844-3.14950.001073
30.1971171.99080.02459
40.1361311.37490.086094
50.1859151.87760.031643
6-0.109337-1.10430.136041
7-0.00305-0.03080.487743
80.0938130.94750.172822
90.2676262.70290.004027
100.1087261.09810.137378
110.2074842.09550.019302
12-0.221101-2.2330.013866
13-0.656242-6.62770
140.1117111.12820.130935
15-0.181748-1.83560.034668
16-0.071241-0.71950.236738
17-0.069253-0.69940.24294
18-0.006313-0.06380.474645
190.0229550.23180.408564
20-0.04678-0.47250.318807
210.1435661.44990.075072
22-0.006667-0.06730.473224
23-0.098018-0.98990.162274
240.089790.90680.183317
25-0.16211-1.63720.052332
260.0740420.74780.228154
270.0566020.57160.284409
28-0.084403-0.85240.197988
29-0.027287-0.27560.391713
30-0.015303-0.15460.43874
310.0705380.71240.238923
32-0.125459-1.26710.104008
33-0.060635-0.61240.270824
340.0414460.41860.338199
350.0443430.44780.32761
36-0.01373-0.13870.444994

\begin{tabular}{lllllllll}
\hline
Partial Autocorrelation Function \tabularnewline
Time lag k & PACF(k) & T-STAT & P-value \tabularnewline
1 & 0.929983 & 9.3924 & 0 \tabularnewline
2 & -0.311844 & -3.1495 & 0.001073 \tabularnewline
3 & 0.197117 & 1.9908 & 0.02459 \tabularnewline
4 & 0.136131 & 1.3749 & 0.086094 \tabularnewline
5 & 0.185915 & 1.8776 & 0.031643 \tabularnewline
6 & -0.109337 & -1.1043 & 0.136041 \tabularnewline
7 & -0.00305 & -0.0308 & 0.487743 \tabularnewline
8 & 0.093813 & 0.9475 & 0.172822 \tabularnewline
9 & 0.267626 & 2.7029 & 0.004027 \tabularnewline
10 & 0.108726 & 1.0981 & 0.137378 \tabularnewline
11 & 0.207484 & 2.0955 & 0.019302 \tabularnewline
12 & -0.221101 & -2.233 & 0.013866 \tabularnewline
13 & -0.656242 & -6.6277 & 0 \tabularnewline
14 & 0.111711 & 1.1282 & 0.130935 \tabularnewline
15 & -0.181748 & -1.8356 & 0.034668 \tabularnewline
16 & -0.071241 & -0.7195 & 0.236738 \tabularnewline
17 & -0.069253 & -0.6994 & 0.24294 \tabularnewline
18 & -0.006313 & -0.0638 & 0.474645 \tabularnewline
19 & 0.022955 & 0.2318 & 0.408564 \tabularnewline
20 & -0.04678 & -0.4725 & 0.318807 \tabularnewline
21 & 0.143566 & 1.4499 & 0.075072 \tabularnewline
22 & -0.006667 & -0.0673 & 0.473224 \tabularnewline
23 & -0.098018 & -0.9899 & 0.162274 \tabularnewline
24 & 0.08979 & 0.9068 & 0.183317 \tabularnewline
25 & -0.16211 & -1.6372 & 0.052332 \tabularnewline
26 & 0.074042 & 0.7478 & 0.228154 \tabularnewline
27 & 0.056602 & 0.5716 & 0.284409 \tabularnewline
28 & -0.084403 & -0.8524 & 0.197988 \tabularnewline
29 & -0.027287 & -0.2756 & 0.391713 \tabularnewline
30 & -0.015303 & -0.1546 & 0.43874 \tabularnewline
31 & 0.070538 & 0.7124 & 0.238923 \tabularnewline
32 & -0.125459 & -1.2671 & 0.104008 \tabularnewline
33 & -0.060635 & -0.6124 & 0.270824 \tabularnewline
34 & 0.041446 & 0.4186 & 0.338199 \tabularnewline
35 & 0.044343 & 0.4478 & 0.32761 \tabularnewline
36 & -0.01373 & -0.1387 & 0.444994 \tabularnewline
\hline
\end{tabular}
%Source: https://freestatistics.org/blog/index.php?pk=32751&T=2

[TABLE]
[ROW][C]Partial Autocorrelation Function[/C][/ROW]
[ROW][C]Time lag k[/C][C]PACF(k)[/C][C]T-STAT[/C][C]P-value[/C][/ROW]
[ROW][C]1[/C][C]0.929983[/C][C]9.3924[/C][C]0[/C][/ROW]
[ROW][C]2[/C][C]-0.311844[/C][C]-3.1495[/C][C]0.001073[/C][/ROW]
[ROW][C]3[/C][C]0.197117[/C][C]1.9908[/C][C]0.02459[/C][/ROW]
[ROW][C]4[/C][C]0.136131[/C][C]1.3749[/C][C]0.086094[/C][/ROW]
[ROW][C]5[/C][C]0.185915[/C][C]1.8776[/C][C]0.031643[/C][/ROW]
[ROW][C]6[/C][C]-0.109337[/C][C]-1.1043[/C][C]0.136041[/C][/ROW]
[ROW][C]7[/C][C]-0.00305[/C][C]-0.0308[/C][C]0.487743[/C][/ROW]
[ROW][C]8[/C][C]0.093813[/C][C]0.9475[/C][C]0.172822[/C][/ROW]
[ROW][C]9[/C][C]0.267626[/C][C]2.7029[/C][C]0.004027[/C][/ROW]
[ROW][C]10[/C][C]0.108726[/C][C]1.0981[/C][C]0.137378[/C][/ROW]
[ROW][C]11[/C][C]0.207484[/C][C]2.0955[/C][C]0.019302[/C][/ROW]
[ROW][C]12[/C][C]-0.221101[/C][C]-2.233[/C][C]0.013866[/C][/ROW]
[ROW][C]13[/C][C]-0.656242[/C][C]-6.6277[/C][C]0[/C][/ROW]
[ROW][C]14[/C][C]0.111711[/C][C]1.1282[/C][C]0.130935[/C][/ROW]
[ROW][C]15[/C][C]-0.181748[/C][C]-1.8356[/C][C]0.034668[/C][/ROW]
[ROW][C]16[/C][C]-0.071241[/C][C]-0.7195[/C][C]0.236738[/C][/ROW]
[ROW][C]17[/C][C]-0.069253[/C][C]-0.6994[/C][C]0.24294[/C][/ROW]
[ROW][C]18[/C][C]-0.006313[/C][C]-0.0638[/C][C]0.474645[/C][/ROW]
[ROW][C]19[/C][C]0.022955[/C][C]0.2318[/C][C]0.408564[/C][/ROW]
[ROW][C]20[/C][C]-0.04678[/C][C]-0.4725[/C][C]0.318807[/C][/ROW]
[ROW][C]21[/C][C]0.143566[/C][C]1.4499[/C][C]0.075072[/C][/ROW]
[ROW][C]22[/C][C]-0.006667[/C][C]-0.0673[/C][C]0.473224[/C][/ROW]
[ROW][C]23[/C][C]-0.098018[/C][C]-0.9899[/C][C]0.162274[/C][/ROW]
[ROW][C]24[/C][C]0.08979[/C][C]0.9068[/C][C]0.183317[/C][/ROW]
[ROW][C]25[/C][C]-0.16211[/C][C]-1.6372[/C][C]0.052332[/C][/ROW]
[ROW][C]26[/C][C]0.074042[/C][C]0.7478[/C][C]0.228154[/C][/ROW]
[ROW][C]27[/C][C]0.056602[/C][C]0.5716[/C][C]0.284409[/C][/ROW]
[ROW][C]28[/C][C]-0.084403[/C][C]-0.8524[/C][C]0.197988[/C][/ROW]
[ROW][C]29[/C][C]-0.027287[/C][C]-0.2756[/C][C]0.391713[/C][/ROW]
[ROW][C]30[/C][C]-0.015303[/C][C]-0.1546[/C][C]0.43874[/C][/ROW]
[ROW][C]31[/C][C]0.070538[/C][C]0.7124[/C][C]0.238923[/C][/ROW]
[ROW][C]32[/C][C]-0.125459[/C][C]-1.2671[/C][C]0.104008[/C][/ROW]
[ROW][C]33[/C][C]-0.060635[/C][C]-0.6124[/C][C]0.270824[/C][/ROW]
[ROW][C]34[/C][C]0.041446[/C][C]0.4186[/C][C]0.338199[/C][/ROW]
[ROW][C]35[/C][C]0.044343[/C][C]0.4478[/C][C]0.32761[/C][/ROW]
[ROW][C]36[/C][C]-0.01373[/C][C]-0.1387[/C][C]0.444994[/C][/ROW]
[/TABLE]
Source: https://freestatistics.org/blog/index.php?pk=32751&T=2

Globally Unique Identifier (entire table): ba.freestatistics.org/blog/index.php?pk=32751&T=2

As an alternative you can also use a QR Code:  

The GUIDs for individual cells are displayed in the table below:

Partial Autocorrelation Function
Time lag kPACF(k)T-STATP-value
10.9299839.39240
2-0.311844-3.14950.001073
30.1971171.99080.02459
40.1361311.37490.086094
50.1859151.87760.031643
6-0.109337-1.10430.136041
7-0.00305-0.03080.487743
80.0938130.94750.172822
90.2676262.70290.004027
100.1087261.09810.137378
110.2074842.09550.019302
12-0.221101-2.2330.013866
13-0.656242-6.62770
140.1117111.12820.130935
15-0.181748-1.83560.034668
16-0.071241-0.71950.236738
17-0.069253-0.69940.24294
18-0.006313-0.06380.474645
190.0229550.23180.408564
20-0.04678-0.47250.318807
210.1435661.44990.075072
22-0.006667-0.06730.473224
23-0.098018-0.98990.162274
240.089790.90680.183317
25-0.16211-1.63720.052332
260.0740420.74780.228154
270.0566020.57160.284409
28-0.084403-0.85240.197988
29-0.027287-0.27560.391713
30-0.015303-0.15460.43874
310.0705380.71240.238923
32-0.125459-1.26710.104008
33-0.060635-0.61240.270824
340.0414460.41860.338199
350.0443430.44780.32761
36-0.01373-0.13870.444994


Parameters (Session):
par1 = 36 ; par2 = 1.0 ; par3 = 0 ; par4 = 0 ; par5 = 12 ;
Parameters (R input):
par1 = 36 ; par2 = 1.0 ; par3 = 0 ; par4 = 0 ; par5 = 12 ;
R code (references can be found in the software module):
if (par1 == 'Default') {
par1 = 10*log10(length(x))
} else {
par1 <- as.numeric(par1)
}
par2 <- as.numeric(par2)
par3 <- as.numeric(par3)
par4 <- as.numeric(par4)
par5 <- as.numeric(par5)
if (par2 == 0) {
x <- log(x)
} else {
x <- (x ^ par2 - 1) / par2
}
if (par3 > 0) x <- diff(x,lag=1,difference=par3)
if (par4 > 0) x <- diff(x,lag=par5,difference=par4)
bitmap(file='pic1.png')
racf <- acf(x,par1,main='Autocorrelation',xlab='lags',ylab='ACF')
dev.off()
bitmap(file='pic2.png')
rpacf <- pacf(x,par1,main='Partial Autocorrelation',xlab='lags',ylab='PACF')
dev.off()
(myacf <- c(racf$acf))
(mypacf <- c(rpacf$acf))
lengthx <- length(x)
sqrtn <- sqrt(lengthx)
load(file='createtable')
a<-table.start()
a<-table.row.start(a)
a<-table.element(a,'Autocorrelation Function',4,TRUE)
a<-table.row.end(a)
a<-table.row.start(a)
a<-table.element(a,'Time lag k',header=TRUE)
a<-table.element(a,hyperlink('basics.htm','ACF(k)','click here for more information about the Autocorrelation Function'),header=TRUE)
a<-table.element(a,'T-STAT',header=TRUE)
a<-table.element(a,'P-value',header=TRUE)
a<-table.row.end(a)
for (i in 2:(par1+1)) {
a<-table.row.start(a)
a<-table.element(a,i-1,header=TRUE)
a<-table.element(a,round(myacf[i],6))
mytstat <- myacf[i]*sqrtn
a<-table.element(a,round(mytstat,4))
a<-table.element(a,round(1-pt(abs(mytstat),lengthx),6))
a<-table.row.end(a)
}
a<-table.end(a)
table.save(a,file='mytable.tab')
a<-table.start()
a<-table.row.start(a)
a<-table.element(a,'Partial Autocorrelation Function',4,TRUE)
a<-table.row.end(a)
a<-table.row.start(a)
a<-table.element(a,'Time lag k',header=TRUE)
a<-table.element(a,hyperlink('basics.htm','PACF(k)','click here for more information about the Partial Autocorrelation Function'),header=TRUE)
a<-table.element(a,'T-STAT',header=TRUE)
a<-table.element(a,'P-value',header=TRUE)
a<-table.row.end(a)
for (i in 1:par1) {
a<-table.row.start(a)
a<-table.element(a,i,header=TRUE)
a<-table.element(a,round(mypacf[i],6))
mytstat <- mypacf[i]*sqrtn
a<-table.element(a,round(mytstat,4))
a<-table.element(a,round(1-pt(abs(mytstat),lengthx),6))
a<-table.row.end(a)
}
a<-table.end(a)
table.save(a,file='mytable1.tab')