Free Statistics

of Irreproducible Research!

Author's title

Author*The author of this computation has been verified*
R Software Modulerwasp_arimaforecasting.wasp
Title produced by softwareARIMA Forecasting
Date of computationFri, 12 Dec 2008 06:45:27 -0700
Cite this page as followsStatistical Computations at FreeStatistics.org, Office for Research Development and Education, URL https://freestatistics.org/blog/index.php?v=date/2008/Dec/12/t1229089600ev8ksgm5qxpm0ng.htm/, Retrieved Sun, 19 May 2024 05:17:04 +0000
Statistical Computations at FreeStatistics.org, Office for Research Development and Education, URL https://freestatistics.org/blog/index.php?pk=32723, Retrieved Sun, 19 May 2024 05:17:04 +0000
QR Codes:

Original text written by user:
IsPrivate?No (this computation is public)
User-defined keywords
Estimated Impact181
Family? (F = Feedback message, R = changed R code, M = changed R Module, P = changed Parameters, D = changed Data)
F     [Univariate Data Series] [Paper - werkloosh...] [2008-12-11 13:38:22] [46c5a5fbda57fdfa1d4ef48658f82a0c]
- RMP     [ARIMA Forecasting] [Paper - werkloosh...] [2008-12-12 13:45:27] [b23db733701c4d62df5e228d507c1c6a] [Current]
Feedback Forum

Post a new message
Dataseries X:
51.220
50.487
49.415
49.398
48.196
47.348
49.331
49.644
49.588
49.567
49.010
49.563
49.741
49.487
48.278
47.478
46.985
45.216
46.581
49.266
48.121
46.412
46.285
46.824
46.949
45.355
44.924
45.059
44.202
44.149
46.151
47.703
48.436
47.089
47.492
49.295
49.127
50.041
48.857
48.428
48.788
48.820
50.743
52.590
51.959
53.451
55.674
56.120
55.685
56.714
54.882
55.173
53.574
53.954
58.055
61.062
58.353
59.693
58.833
60.417
61.696
62.515
62.687
61.794
63.014
63.134
68.057
67.327
68.310
69.780
69.944
69.881
71.397
70.631
70.452
69.862
69.114
69.358
71.133
73.128
73.528
73.677
72.273
71.962
73.654
73.305
73.355
73.346
72.881
72.424
74.540
74.847
75.904
76.870
76.370
77.631
78.335
77.926
77.236
76.755
74.710
73.486
76.034
76.389
77.767
78.124
76.696
77.375
77.431
77.347
77.013
76.666
75.225
75.579
77.100
78.592
79.502
78.528
77.775
77.271
78.738
77.885
76.896
75.813
74.958
75.340
77.187
78.602
81.653
78.125
76.092
74.870
75.615
74.776
72.528
71.894
71.641
71.145
73.320
72.186
72.854
74.243
74.628
72.368
75.361
72.746
70.536
69.410
66.219
66.739
67.626
70.602
71.758
71.786
69.641
68.055
70.148
69.390
68.562
68.622
68.120
68.308
70.421
69.766
72.157
72.928
75.340
74.812
74.593
76.003
75.112
75.452
75.634
75.653
78.645
73.100
79.699
82.848
81.834
81.736
82.267
84.120
83.819
82.734
81.842
81.735
83.227
81.934
89.521
88.827
85.874
85.211
87.130
88.620
89.563
89.056
88.542
89.504
89.428
86.040
96.240
94.423
93.028
92.285
91.685
94.260
93.858
92.437
92.980
92.099
92.803
88.551
98.334
98.329
96.455
97.109
97.687
98.512
98.673
96.028
98.014
95.580
97.838
97.760
99.913
97.588
93.942
93.656
93.365
92.881
93.120
91.063
90.930
91.946
94.624
95.484
95.862
95.530
94.574
94.677
93.845
91.533
91.214
90.922
89.563
89.945
91.850
92.505
92.437
93.876


Summary of computational transaction
Raw Inputview raw input (R code)
Raw Outputview raw output of R engine
Computing time4 seconds
R Server'Gwilym Jenkins' @ 72.249.127.135

\begin{tabular}{lllllllll}
\hline
Summary of computational transaction \tabularnewline
Raw Input & view raw input (R code)  \tabularnewline
Raw Output & view raw output of R engine  \tabularnewline
Computing time & 4 seconds \tabularnewline
R Server & 'Gwilym Jenkins' @ 72.249.127.135 \tabularnewline
\hline
\end{tabular}
%Source: https://freestatistics.org/blog/index.php?pk=32723&T=0

[TABLE]
[ROW][C]Summary of computational transaction[/C][/ROW]
[ROW][C]Raw Input[/C][C]view raw input (R code) [/C][/ROW]
[ROW][C]Raw Output[/C][C]view raw output of R engine [/C][/ROW]
[ROW][C]Computing time[/C][C]4 seconds[/C][/ROW]
[ROW][C]R Server[/C][C]'Gwilym Jenkins' @ 72.249.127.135[/C][/ROW]
[/TABLE]
Source: https://freestatistics.org/blog/index.php?pk=32723&T=0

Globally Unique Identifier (entire table): ba.freestatistics.org/blog/index.php?pk=32723&T=0

As an alternative you can also use a QR Code:  

The GUIDs for individual cells are displayed in the table below:

Summary of computational transaction
Raw Inputview raw input (R code)
Raw Outputview raw output of R engine
Computing time4 seconds
R Server'Gwilym Jenkins' @ 72.249.127.135


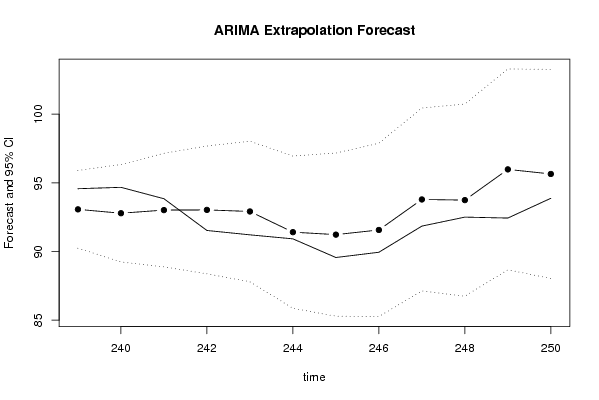
Univariate ARIMA Extrapolation Forecast
timeY[t]F[t]95% LB95% UBp-value(H0: Y[t] = F[t])P(F[t]>Y[t-1])P(F[t]>Y[t-s])P(F[t]>Y[238])
22697.588-------
22793.942-------
22893.656-------
22993.365-------
23092.881-------
23193.12-------
23291.063-------
23390.93-------
23491.946-------
23594.624-------
23695.484-------
23795.862-------
23895.53-------
23994.57493.071490.239295.90360.14920.04440.27340.0444
24094.67792.788889.242996.33470.14830.16190.31580.0649
24193.84593.017788.879497.1560.34760.2160.43470.117
24291.53393.030988.375197.68680.26420.36590.52520.1464
24391.21492.917387.795998.03860.25720.70190.46910.1587
24490.92291.409885.861996.95780.43160.52760.54880.0728
24589.56391.229985.285997.1740.29130.54040.53940.0781
24689.94591.569485.254297.88470.30710.73330.45350.1095
24791.8593.792887.1269100.45870.28390.87110.40350.3047
24892.50593.744886.7458100.74380.36420.70220.31310.3086
24992.43795.982988.666103.29990.17110.82420.51290.5483
25093.87695.64988.0274103.27060.32420.79560.51220.5122

\begin{tabular}{lllllllll}
\hline
Univariate ARIMA Extrapolation Forecast \tabularnewline
time & Y[t] & F[t] & 95% LB & 95% UB & p-value(H0: Y[t] = F[t]) & P(F[t]>Y[t-1]) & P(F[t]>Y[t-s]) & P(F[t]>Y[238]) \tabularnewline
226 & 97.588 & - & - & - & - & - & - & - \tabularnewline
227 & 93.942 & - & - & - & - & - & - & - \tabularnewline
228 & 93.656 & - & - & - & - & - & - & - \tabularnewline
229 & 93.365 & - & - & - & - & - & - & - \tabularnewline
230 & 92.881 & - & - & - & - & - & - & - \tabularnewline
231 & 93.12 & - & - & - & - & - & - & - \tabularnewline
232 & 91.063 & - & - & - & - & - & - & - \tabularnewline
233 & 90.93 & - & - & - & - & - & - & - \tabularnewline
234 & 91.946 & - & - & - & - & - & - & - \tabularnewline
235 & 94.624 & - & - & - & - & - & - & - \tabularnewline
236 & 95.484 & - & - & - & - & - & - & - \tabularnewline
237 & 95.862 & - & - & - & - & - & - & - \tabularnewline
238 & 95.53 & - & - & - & - & - & - & - \tabularnewline
239 & 94.574 & 93.0714 & 90.2392 & 95.9036 & 0.1492 & 0.0444 & 0.2734 & 0.0444 \tabularnewline
240 & 94.677 & 92.7888 & 89.2429 & 96.3347 & 0.1483 & 0.1619 & 0.3158 & 0.0649 \tabularnewline
241 & 93.845 & 93.0177 & 88.8794 & 97.156 & 0.3476 & 0.216 & 0.4347 & 0.117 \tabularnewline
242 & 91.533 & 93.0309 & 88.3751 & 97.6868 & 0.2642 & 0.3659 & 0.5252 & 0.1464 \tabularnewline
243 & 91.214 & 92.9173 & 87.7959 & 98.0386 & 0.2572 & 0.7019 & 0.4691 & 0.1587 \tabularnewline
244 & 90.922 & 91.4098 & 85.8619 & 96.9578 & 0.4316 & 0.5276 & 0.5488 & 0.0728 \tabularnewline
245 & 89.563 & 91.2299 & 85.2859 & 97.174 & 0.2913 & 0.5404 & 0.5394 & 0.0781 \tabularnewline
246 & 89.945 & 91.5694 & 85.2542 & 97.8847 & 0.3071 & 0.7333 & 0.4535 & 0.1095 \tabularnewline
247 & 91.85 & 93.7928 & 87.1269 & 100.4587 & 0.2839 & 0.8711 & 0.4035 & 0.3047 \tabularnewline
248 & 92.505 & 93.7448 & 86.7458 & 100.7438 & 0.3642 & 0.7022 & 0.3131 & 0.3086 \tabularnewline
249 & 92.437 & 95.9829 & 88.666 & 103.2999 & 0.1711 & 0.8242 & 0.5129 & 0.5483 \tabularnewline
250 & 93.876 & 95.649 & 88.0274 & 103.2706 & 0.3242 & 0.7956 & 0.5122 & 0.5122 \tabularnewline
\hline
\end{tabular}
%Source: https://freestatistics.org/blog/index.php?pk=32723&T=1

[TABLE]
[ROW][C]Univariate ARIMA Extrapolation Forecast[/C][/ROW]
[ROW][C]time[/C][C]Y[t][/C][C]F[t][/C][C]95% LB[/C][C]95% UB[/C][C]p-value(H0: Y[t] = F[t])[/C][C]P(F[t]>Y[t-1])[/C][C]P(F[t]>Y[t-s])[/C][C]P(F[t]>Y[238])[/C][/ROW]
[ROW][C]226[/C][C]97.588[/C][C]-[/C][C]-[/C][C]-[/C][C]-[/C][C]-[/C][C]-[/C][C]-[/C][/ROW]
[ROW][C]227[/C][C]93.942[/C][C]-[/C][C]-[/C][C]-[/C][C]-[/C][C]-[/C][C]-[/C][C]-[/C][/ROW]
[ROW][C]228[/C][C]93.656[/C][C]-[/C][C]-[/C][C]-[/C][C]-[/C][C]-[/C][C]-[/C][C]-[/C][/ROW]
[ROW][C]229[/C][C]93.365[/C][C]-[/C][C]-[/C][C]-[/C][C]-[/C][C]-[/C][C]-[/C][C]-[/C][/ROW]
[ROW][C]230[/C][C]92.881[/C][C]-[/C][C]-[/C][C]-[/C][C]-[/C][C]-[/C][C]-[/C][C]-[/C][/ROW]
[ROW][C]231[/C][C]93.12[/C][C]-[/C][C]-[/C][C]-[/C][C]-[/C][C]-[/C][C]-[/C][C]-[/C][/ROW]
[ROW][C]232[/C][C]91.063[/C][C]-[/C][C]-[/C][C]-[/C][C]-[/C][C]-[/C][C]-[/C][C]-[/C][/ROW]
[ROW][C]233[/C][C]90.93[/C][C]-[/C][C]-[/C][C]-[/C][C]-[/C][C]-[/C][C]-[/C][C]-[/C][/ROW]
[ROW][C]234[/C][C]91.946[/C][C]-[/C][C]-[/C][C]-[/C][C]-[/C][C]-[/C][C]-[/C][C]-[/C][/ROW]
[ROW][C]235[/C][C]94.624[/C][C]-[/C][C]-[/C][C]-[/C][C]-[/C][C]-[/C][C]-[/C][C]-[/C][/ROW]
[ROW][C]236[/C][C]95.484[/C][C]-[/C][C]-[/C][C]-[/C][C]-[/C][C]-[/C][C]-[/C][C]-[/C][/ROW]
[ROW][C]237[/C][C]95.862[/C][C]-[/C][C]-[/C][C]-[/C][C]-[/C][C]-[/C][C]-[/C][C]-[/C][/ROW]
[ROW][C]238[/C][C]95.53[/C][C]-[/C][C]-[/C][C]-[/C][C]-[/C][C]-[/C][C]-[/C][C]-[/C][/ROW]
[ROW][C]239[/C][C]94.574[/C][C]93.0714[/C][C]90.2392[/C][C]95.9036[/C][C]0.1492[/C][C]0.0444[/C][C]0.2734[/C][C]0.0444[/C][/ROW]
[ROW][C]240[/C][C]94.677[/C][C]92.7888[/C][C]89.2429[/C][C]96.3347[/C][C]0.1483[/C][C]0.1619[/C][C]0.3158[/C][C]0.0649[/C][/ROW]
[ROW][C]241[/C][C]93.845[/C][C]93.0177[/C][C]88.8794[/C][C]97.156[/C][C]0.3476[/C][C]0.216[/C][C]0.4347[/C][C]0.117[/C][/ROW]
[ROW][C]242[/C][C]91.533[/C][C]93.0309[/C][C]88.3751[/C][C]97.6868[/C][C]0.2642[/C][C]0.3659[/C][C]0.5252[/C][C]0.1464[/C][/ROW]
[ROW][C]243[/C][C]91.214[/C][C]92.9173[/C][C]87.7959[/C][C]98.0386[/C][C]0.2572[/C][C]0.7019[/C][C]0.4691[/C][C]0.1587[/C][/ROW]
[ROW][C]244[/C][C]90.922[/C][C]91.4098[/C][C]85.8619[/C][C]96.9578[/C][C]0.4316[/C][C]0.5276[/C][C]0.5488[/C][C]0.0728[/C][/ROW]
[ROW][C]245[/C][C]89.563[/C][C]91.2299[/C][C]85.2859[/C][C]97.174[/C][C]0.2913[/C][C]0.5404[/C][C]0.5394[/C][C]0.0781[/C][/ROW]
[ROW][C]246[/C][C]89.945[/C][C]91.5694[/C][C]85.2542[/C][C]97.8847[/C][C]0.3071[/C][C]0.7333[/C][C]0.4535[/C][C]0.1095[/C][/ROW]
[ROW][C]247[/C][C]91.85[/C][C]93.7928[/C][C]87.1269[/C][C]100.4587[/C][C]0.2839[/C][C]0.8711[/C][C]0.4035[/C][C]0.3047[/C][/ROW]
[ROW][C]248[/C][C]92.505[/C][C]93.7448[/C][C]86.7458[/C][C]100.7438[/C][C]0.3642[/C][C]0.7022[/C][C]0.3131[/C][C]0.3086[/C][/ROW]
[ROW][C]249[/C][C]92.437[/C][C]95.9829[/C][C]88.666[/C][C]103.2999[/C][C]0.1711[/C][C]0.8242[/C][C]0.5129[/C][C]0.5483[/C][/ROW]
[ROW][C]250[/C][C]93.876[/C][C]95.649[/C][C]88.0274[/C][C]103.2706[/C][C]0.3242[/C][C]0.7956[/C][C]0.5122[/C][C]0.5122[/C][/ROW]
[/TABLE]
Source: https://freestatistics.org/blog/index.php?pk=32723&T=1

Globally Unique Identifier (entire table): ba.freestatistics.org/blog/index.php?pk=32723&T=1

As an alternative you can also use a QR Code:  

The GUIDs for individual cells are displayed in the table below:

Univariate ARIMA Extrapolation Forecast
timeY[t]F[t]95% LB95% UBp-value(H0: Y[t] = F[t])P(F[t]>Y[t-1])P(F[t]>Y[t-s])P(F[t]>Y[238])
22697.588-------
22793.942-------
22893.656-------
22993.365-------
23092.881-------
23193.12-------
23291.063-------
23390.93-------
23491.946-------
23594.624-------
23695.484-------
23795.862-------
23895.53-------
23994.57493.071490.239295.90360.14920.04440.27340.0444
24094.67792.788889.242996.33470.14830.16190.31580.0649
24193.84593.017788.879497.1560.34760.2160.43470.117
24291.53393.030988.375197.68680.26420.36590.52520.1464
24391.21492.917387.795998.03860.25720.70190.46910.1587
24490.92291.409885.861996.95780.43160.52760.54880.0728
24589.56391.229985.285997.1740.29130.54040.53940.0781
24689.94591.569485.254297.88470.30710.73330.45350.1095
24791.8593.792887.1269100.45870.28390.87110.40350.3047
24892.50593.744886.7458100.74380.36420.70220.31310.3086
24992.43795.982988.666103.29990.17110.82420.51290.5483
25093.87695.64988.0274103.27060.32420.79560.51220.5122


Univariate ARIMA Extrapolation Forecast Performance
time% S.E.PEMAPESq.EMSERMSE
2390.01550.01610.00132.25790.18820.4338
2400.01950.02030.00173.56530.29710.5451
2410.02270.00897e-040.68440.0570.2388
2420.0255-0.01610.00132.24380.1870.4324
2430.0281-0.01830.00152.90110.24180.4917
2440.031-0.00534e-040.2380.01980.1408
2450.0332-0.01830.00152.77870.23160.4812
2460.0352-0.01770.00152.63880.21990.4689
2470.0363-0.02070.00173.77430.31450.5608
2480.0381-0.01320.00111.53710.12810.3579
2490.0389-0.03690.003112.57371.04781.0236
2500.0407-0.01850.00153.14360.2620.5118

\begin{tabular}{lllllllll}
\hline
Univariate ARIMA Extrapolation Forecast Performance \tabularnewline
time & % S.E. & PE & MAPE & Sq.E & MSE & RMSE \tabularnewline
239 & 0.0155 & 0.0161 & 0.0013 & 2.2579 & 0.1882 & 0.4338 \tabularnewline
240 & 0.0195 & 0.0203 & 0.0017 & 3.5653 & 0.2971 & 0.5451 \tabularnewline
241 & 0.0227 & 0.0089 & 7e-04 & 0.6844 & 0.057 & 0.2388 \tabularnewline
242 & 0.0255 & -0.0161 & 0.0013 & 2.2438 & 0.187 & 0.4324 \tabularnewline
243 & 0.0281 & -0.0183 & 0.0015 & 2.9011 & 0.2418 & 0.4917 \tabularnewline
244 & 0.031 & -0.0053 & 4e-04 & 0.238 & 0.0198 & 0.1408 \tabularnewline
245 & 0.0332 & -0.0183 & 0.0015 & 2.7787 & 0.2316 & 0.4812 \tabularnewline
246 & 0.0352 & -0.0177 & 0.0015 & 2.6388 & 0.2199 & 0.4689 \tabularnewline
247 & 0.0363 & -0.0207 & 0.0017 & 3.7743 & 0.3145 & 0.5608 \tabularnewline
248 & 0.0381 & -0.0132 & 0.0011 & 1.5371 & 0.1281 & 0.3579 \tabularnewline
249 & 0.0389 & -0.0369 & 0.0031 & 12.5737 & 1.0478 & 1.0236 \tabularnewline
250 & 0.0407 & -0.0185 & 0.0015 & 3.1436 & 0.262 & 0.5118 \tabularnewline
\hline
\end{tabular}
%Source: https://freestatistics.org/blog/index.php?pk=32723&T=2

[TABLE]
[ROW][C]Univariate ARIMA Extrapolation Forecast Performance[/C][/ROW]
[ROW][C]time[/C][C]% S.E.[/C][C]PE[/C][C]MAPE[/C][C]Sq.E[/C][C]MSE[/C][C]RMSE[/C][/ROW]
[ROW][C]239[/C][C]0.0155[/C][C]0.0161[/C][C]0.0013[/C][C]2.2579[/C][C]0.1882[/C][C]0.4338[/C][/ROW]
[ROW][C]240[/C][C]0.0195[/C][C]0.0203[/C][C]0.0017[/C][C]3.5653[/C][C]0.2971[/C][C]0.5451[/C][/ROW]
[ROW][C]241[/C][C]0.0227[/C][C]0.0089[/C][C]7e-04[/C][C]0.6844[/C][C]0.057[/C][C]0.2388[/C][/ROW]
[ROW][C]242[/C][C]0.0255[/C][C]-0.0161[/C][C]0.0013[/C][C]2.2438[/C][C]0.187[/C][C]0.4324[/C][/ROW]
[ROW][C]243[/C][C]0.0281[/C][C]-0.0183[/C][C]0.0015[/C][C]2.9011[/C][C]0.2418[/C][C]0.4917[/C][/ROW]
[ROW][C]244[/C][C]0.031[/C][C]-0.0053[/C][C]4e-04[/C][C]0.238[/C][C]0.0198[/C][C]0.1408[/C][/ROW]
[ROW][C]245[/C][C]0.0332[/C][C]-0.0183[/C][C]0.0015[/C][C]2.7787[/C][C]0.2316[/C][C]0.4812[/C][/ROW]
[ROW][C]246[/C][C]0.0352[/C][C]-0.0177[/C][C]0.0015[/C][C]2.6388[/C][C]0.2199[/C][C]0.4689[/C][/ROW]
[ROW][C]247[/C][C]0.0363[/C][C]-0.0207[/C][C]0.0017[/C][C]3.7743[/C][C]0.3145[/C][C]0.5608[/C][/ROW]
[ROW][C]248[/C][C]0.0381[/C][C]-0.0132[/C][C]0.0011[/C][C]1.5371[/C][C]0.1281[/C][C]0.3579[/C][/ROW]
[ROW][C]249[/C][C]0.0389[/C][C]-0.0369[/C][C]0.0031[/C][C]12.5737[/C][C]1.0478[/C][C]1.0236[/C][/ROW]
[ROW][C]250[/C][C]0.0407[/C][C]-0.0185[/C][C]0.0015[/C][C]3.1436[/C][C]0.262[/C][C]0.5118[/C][/ROW]
[/TABLE]
Source: https://freestatistics.org/blog/index.php?pk=32723&T=2

Globally Unique Identifier (entire table): ba.freestatistics.org/blog/index.php?pk=32723&T=2

As an alternative you can also use a QR Code:  

The GUIDs for individual cells are displayed in the table below:

Univariate ARIMA Extrapolation Forecast Performance
time% S.E.PEMAPESq.EMSERMSE
2390.01550.01610.00132.25790.18820.4338
2400.01950.02030.00173.56530.29710.5451
2410.02270.00897e-040.68440.0570.2388
2420.0255-0.01610.00132.24380.1870.4324
2430.0281-0.01830.00152.90110.24180.4917
2440.031-0.00534e-040.2380.01980.1408
2450.0332-0.01830.00152.77870.23160.4812
2460.0352-0.01770.00152.63880.21990.4689
2470.0363-0.02070.00173.77430.31450.5608
2480.0381-0.01320.00111.53710.12810.3579
2490.0389-0.03690.003112.57371.04781.0236
2500.0407-0.01850.00153.14360.2620.5118


Parameters (Session):
par1 = 1 ; par2 = Include Monthly Dummies ; par3 = Linear Trend ;
Parameters (R input):
par1 = 12 ; par2 = 1 ; par3 = 1 ; par4 = 1 ; par5 = 12 ; par6 = 0 ; par7 = 1 ; par8 = 1 ; par9 = 1 ; par10 = FALSE ;
R code (references can be found in the software module):
par1 <- as.numeric(par1) #cut off periods
par2 <- as.numeric(par2) #lambda
par3 <- as.numeric(par3) #degree of non-seasonal differencing
par4 <- as.numeric(par4) #degree of seasonal differencing
par5 <- as.numeric(par5) #seasonal period
par6 <- as.numeric(par6) #p
par7 <- as.numeric(par7) #q
par8 <- as.numeric(par8) #P
par9 <- as.numeric(par9) #Q
if (par10 == 'TRUE') par10 <- TRUE
if (par10 == 'FALSE') par10 <- FALSE
if (par2 == 0) x <- log(x)
if (par2 != 0) x <- x^par2
lx <- length(x)
first <- lx - 2*par1
nx <- lx - par1
nx1 <- nx + 1
fx <- lx - nx
if (fx < 1) {
fx <- par5
nx1 <- lx + fx - 1
first <- lx - 2*fx
}
first <- 1
if (fx < 3) fx <- round(lx/10,0)
(arima.out <- arima(x[1:nx], order=c(par6,par3,par7), seasonal=list(order=c(par8,par4,par9), period=par5), include.mean=par10, method='ML'))
(forecast <- predict(arima.out,fx))
(lb <- forecast$pred - 1.96 * forecast$se)
(ub <- forecast$pred + 1.96 * forecast$se)
if (par2 == 0) {
x <- exp(x)
forecast$pred <- exp(forecast$pred)
lb <- exp(lb)
ub <- exp(ub)
}
if (par2 != 0) {
x <- x^(1/par2)
forecast$pred <- forecast$pred^(1/par2)
lb <- lb^(1/par2)
ub <- ub^(1/par2)
}
if (par2 < 0) {
olb <- lb
lb <- ub
ub <- olb
}
(actandfor <- c(x[1:nx], forecast$pred))
(perc.se <- (ub-forecast$pred)/1.96/forecast$pred)
bitmap(file='test1.png')
opar <- par(mar=c(4,4,2,2),las=1)
ylim <- c( min(x[first:nx],lb), max(x[first:nx],ub))
plot(x,ylim=ylim,type='n',xlim=c(first,lx))
usr <- par('usr')
rect(usr[1],usr[3],nx+1,usr[4],border=NA,col='lemonchiffon')
rect(nx1,usr[3],usr[2],usr[4],border=NA,col='lavender')
abline(h= (-3:3)*2 , col ='gray', lty =3)
polygon( c(nx1:lx,lx:nx1), c(lb,rev(ub)), col = 'orange', lty=2,border=NA)
lines(nx1:lx, lb , lty=2)
lines(nx1:lx, ub , lty=2)
lines(x, lwd=2)
lines(nx1:lx, forecast$pred , lwd=2 , col ='white')
box()
par(opar)
dev.off()
prob.dec <- array(NA, dim=fx)
prob.sdec <- array(NA, dim=fx)
prob.ldec <- array(NA, dim=fx)
prob.pval <- array(NA, dim=fx)
perf.pe <- array(0, dim=fx)
perf.mape <- array(0, dim=fx)
perf.se <- array(0, dim=fx)
perf.mse <- array(0, dim=fx)
perf.rmse <- array(0, dim=fx)
for (i in 1:fx) {
locSD <- (ub[i] - forecast$pred[i]) / 1.96
perf.pe[i] = (x[nx+i] - forecast$pred[i]) / forecast$pred[i]
perf.mape[i] = perf.mape[i] + abs(perf.pe[i])
perf.se[i] = (x[nx+i] - forecast$pred[i])^2
perf.mse[i] = perf.mse[i] + perf.se[i]
prob.dec[i] = pnorm((x[nx+i-1] - forecast$pred[i]) / locSD)
prob.sdec[i] = pnorm((x[nx+i-par5] - forecast$pred[i]) / locSD)
prob.ldec[i] = pnorm((x[nx] - forecast$pred[i]) / locSD)
prob.pval[i] = pnorm(abs(x[nx+i] - forecast$pred[i]) / locSD)
}
perf.mape = perf.mape / fx
perf.mse = perf.mse / fx
perf.rmse = sqrt(perf.mse)
bitmap(file='test2.png')
plot(forecast$pred, pch=19, type='b',main='ARIMA Extrapolation Forecast', ylab='Forecast and 95% CI', xlab='time',ylim=c(min(lb),max(ub)))
dum <- forecast$pred
dum[1:12] <- x[(nx+1):lx]
lines(dum, lty=1)
lines(ub,lty=3)
lines(lb,lty=3)
dev.off()
load(file='createtable')
a<-table.start()
a<-table.row.start(a)
a<-table.element(a,'Univariate ARIMA Extrapolation Forecast',9,TRUE)
a<-table.row.end(a)
a<-table.row.start(a)
a<-table.element(a,'time',1,header=TRUE)
a<-table.element(a,'Y[t]',1,header=TRUE)
a<-table.element(a,'F[t]',1,header=TRUE)
a<-table.element(a,'95% LB',1,header=TRUE)
a<-table.element(a,'95% UB',1,header=TRUE)
a<-table.element(a,'p-value
(H0: Y[t] = F[t])',1,header=TRUE)
a<-table.element(a,'P(F[t]>Y[t-1])',1,header=TRUE)
a<-table.element(a,'P(F[t]>Y[t-s])',1,header=TRUE)
mylab <- paste('P(F[t]>Y[',nx,sep='')
mylab <- paste(mylab,'])',sep='')
a<-table.element(a,mylab,1,header=TRUE)
a<-table.row.end(a)
for (i in (nx-par5):nx) {
a<-table.row.start(a)
a<-table.element(a,i,header=TRUE)
a<-table.element(a,x[i])
a<-table.element(a,'-')
a<-table.row.end(a)
}
for (i in 1:fx) {
a<-table.row.start(a)
a<-table.element(a,nx+i,header=TRUE)
a<-table.element(a,round(x[nx+i],4))
a<-table.element(a,round(forecast$pred[i],4))
a<-table.element(a,round(lb[i],4))
a<-table.element(a,round(ub[i],4))
a<-table.element(a,round((1-prob.pval[i]),4))
a<-table.element(a,round((1-prob.dec[i]),4))
a<-table.element(a,round((1-prob.sdec[i]),4))
a<-table.element(a,round((1-prob.ldec[i]),4))
a<-table.row.end(a)
}
a<-table.end(a)
table.save(a,file='mytable.tab')
a<-table.start()
a<-table.row.start(a)
a<-table.element(a,'Univariate ARIMA Extrapolation Forecast Performance',7,TRUE)
a<-table.row.end(a)
a<-table.row.start(a)
a<-table.element(a,'time',1,header=TRUE)
a<-table.element(a,'% S.E.',1,header=TRUE)
a<-table.element(a,'PE',1,header=TRUE)
a<-table.element(a,'MAPE',1,header=TRUE)
a<-table.element(a,'Sq.E',1,header=TRUE)
a<-table.element(a,'MSE',1,header=TRUE)
a<-table.element(a,'RMSE',1,header=TRUE)
a<-table.row.end(a)
for (i in 1:fx) {
a<-table.row.start(a)
a<-table.element(a,nx+i,header=TRUE)
a<-table.element(a,round(perc.se[i],4))
a<-table.element(a,round(perf.pe[i],4))
a<-table.element(a,round(perf.mape[i],4))
a<-table.element(a,round(perf.se[i],4))
a<-table.element(a,round(perf.mse[i],4))
a<-table.element(a,round(perf.rmse[i],4))
a<-table.row.end(a)
}
a<-table.end(a)
table.save(a,file='mytable1.tab')