Free Statistics

of Irreproducible Research!

Author's title

Author*The author of this computation has been verified*
R Software Modulerwasp_autocorrelation.wasp
Title produced by software(Partial) Autocorrelation Function
Date of computationFri, 12 Dec 2008 06:30:07 -0700
Cite this page as followsStatistical Computations at FreeStatistics.org, Office for Research Development and Education, URL https://freestatistics.org/blog/index.php?v=date/2008/Dec/12/t1229088636w980s8xja88mf62.htm/, Retrieved Sun, 19 May 2024 04:26:32 +0000
Statistical Computations at FreeStatistics.org, Office for Research Development and Education, URL https://freestatistics.org/blog/index.php?pk=32708, Retrieved Sun, 19 May 2024 04:26:32 +0000
QR Codes:

Original text written by user:
IsPrivate?No (this computation is public)
User-defined keywords
Estimated Impact217
Family? (F = Feedback message, R = changed R code, M = changed R Module, P = changed Parameters, D = changed Data)
-     [Univariate Data Series] [Uitvoer.Nederland] [2008-12-03 15:11:10] [988ab43f527fc78aae41c84649095267]
-   P   [Univariate Data Series] [Export From Belgi...] [2008-12-03 15:52:29] [988ab43f527fc78aae41c84649095267]
- RMP     [(Partial) Autocorrelation Function] [Partial Autocorre...] [2008-12-03 16:01:07] [988ab43f527fc78aae41c84649095267]
-    D      [(Partial) Autocorrelation Function] [Partial Autocorre...] [2008-12-11 17:24:10] [988ab43f527fc78aae41c84649095267]
-   P           [(Partial) Autocorrelation Function] [Partial Autocorre...] [2008-12-12 13:30:07] [5d823194959040fa9b19b8c8302177e6] [Current]
Feedback Forum

Post a new message
Dataseries X:
13807.9
14101.7
16010.3
14633.1
14478.5
15327.3
14179.5
11398.2
16111.5
15887.4
14529.3
13923.1
13960.2
14807.8
17511.5
15845.9
14594.2
17252.2
14832.8
13132.1
17665.9
16913
17318.8
16224.2
15469.6
16557.5
19414.8
17335
16525.2
18160.4
15553.8
15262.2
18581
17564.1
18948.6
17187.8
17564.8
17668.4
20811.7
17257.8
18984.2
20532.6
17082.3
16894.9
20274.9
20078.6
19900.9
17012.2
19642.9
19024
21691
18835.9
19873.4
21468.2
19406.8
18385.3
20739.3
22268.3
21569
17514.8


Summary of computational transaction
Raw Inputview raw input (R code)
Raw Outputview raw output of R engine
Computing time1 seconds
R Server'Gwilym Jenkins' @ 72.249.127.135

\begin{tabular}{lllllllll}
\hline
Summary of computational transaction \tabularnewline
Raw Input & view raw input (R code)  \tabularnewline
Raw Output & view raw output of R engine  \tabularnewline
Computing time & 1 seconds \tabularnewline
R Server & 'Gwilym Jenkins' @ 72.249.127.135 \tabularnewline
\hline
\end{tabular}
%Source: https://freestatistics.org/blog/index.php?pk=32708&T=0

[TABLE]
[ROW][C]Summary of computational transaction[/C][/ROW]
[ROW][C]Raw Input[/C][C]view raw input (R code) [/C][/ROW]
[ROW][C]Raw Output[/C][C]view raw output of R engine [/C][/ROW]
[ROW][C]Computing time[/C][C]1 seconds[/C][/ROW]
[ROW][C]R Server[/C][C]'Gwilym Jenkins' @ 72.249.127.135[/C][/ROW]
[/TABLE]
Source: https://freestatistics.org/blog/index.php?pk=32708&T=0

Globally Unique Identifier (entire table): ba.freestatistics.org/blog/index.php?pk=32708&T=0

As an alternative you can also use a QR Code:  

The GUIDs for individual cells are displayed in the table below:

Summary of computational transaction
Raw Inputview raw input (R code)
Raw Outputview raw output of R engine
Computing time1 seconds
R Server'Gwilym Jenkins' @ 72.249.127.135


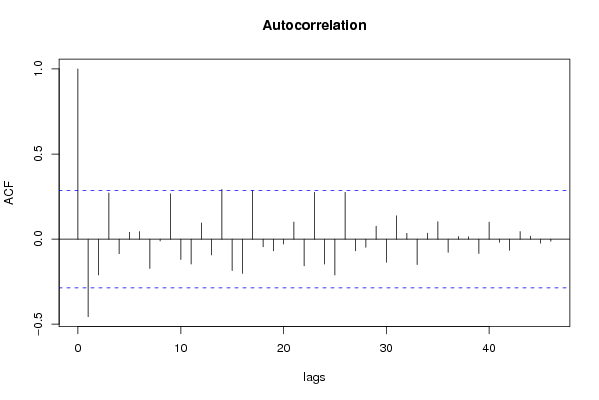
Autocorrelation Function
Time lag kACF(k)T-STATP-value
1-0.455532-3.1230.001531
2-0.210093-1.44030.078202
30.2713281.86010.034566
4-0.085186-0.5840.281004
50.0402460.27590.391912
60.0446580.30620.380416
7-0.172122-1.180.121967
8-0.0105-0.0720.47146
90.2666031.82770.03697
10-0.119247-0.81750.208879
11-0.14687-1.00690.159572
120.0948220.65010.259407
13-0.09278-0.63610.26391
140.2916791.99960.025668
15-0.184758-1.26660.105763
16-0.201514-1.38150.086827
170.2868941.96680.02756
18-0.044873-0.30760.379859
19-0.068891-0.47230.319452
20-0.02916-0.19990.421207
210.1000350.68580.248102
22-0.156725-1.07450.144052
230.2750821.88590.032751
24-0.146309-1.0030.160487
25-0.211258-1.44830.077084
260.2752631.88710.032665
27-0.068659-0.47070.320016
28-0.048123-0.32990.371466
290.0759520.52070.30251
30-0.136209-0.93380.177589
310.1370250.93940.176166
320.0339750.23290.408418
33-0.149394-1.02420.155493
340.0349450.23960.405853
350.1024270.70220.243008
36-0.077557-0.53170.298718
370.0159850.10960.456601
380.0133320.09140.463782
39-0.084452-0.5790.282685
400.0999260.68510.248335
41-0.018992-0.13020.448481
42-0.066001-0.45250.326503
430.0446630.30620.380406
440.017320.11870.452995
45-0.024178-0.16580.43453
46-0.012774-0.08760.465293
47NANANA
48NANANA

\begin{tabular}{lllllllll}
\hline
Autocorrelation Function \tabularnewline
Time lag k & ACF(k) & T-STAT & P-value \tabularnewline
1 & -0.455532 & -3.123 & 0.001531 \tabularnewline
2 & -0.210093 & -1.4403 & 0.078202 \tabularnewline
3 & 0.271328 & 1.8601 & 0.034566 \tabularnewline
4 & -0.085186 & -0.584 & 0.281004 \tabularnewline
5 & 0.040246 & 0.2759 & 0.391912 \tabularnewline
6 & 0.044658 & 0.3062 & 0.380416 \tabularnewline
7 & -0.172122 & -1.18 & 0.121967 \tabularnewline
8 & -0.0105 & -0.072 & 0.47146 \tabularnewline
9 & 0.266603 & 1.8277 & 0.03697 \tabularnewline
10 & -0.119247 & -0.8175 & 0.208879 \tabularnewline
11 & -0.14687 & -1.0069 & 0.159572 \tabularnewline
12 & 0.094822 & 0.6501 & 0.259407 \tabularnewline
13 & -0.09278 & -0.6361 & 0.26391 \tabularnewline
14 & 0.291679 & 1.9996 & 0.025668 \tabularnewline
15 & -0.184758 & -1.2666 & 0.105763 \tabularnewline
16 & -0.201514 & -1.3815 & 0.086827 \tabularnewline
17 & 0.286894 & 1.9668 & 0.02756 \tabularnewline
18 & -0.044873 & -0.3076 & 0.379859 \tabularnewline
19 & -0.068891 & -0.4723 & 0.319452 \tabularnewline
20 & -0.02916 & -0.1999 & 0.421207 \tabularnewline
21 & 0.100035 & 0.6858 & 0.248102 \tabularnewline
22 & -0.156725 & -1.0745 & 0.144052 \tabularnewline
23 & 0.275082 & 1.8859 & 0.032751 \tabularnewline
24 & -0.146309 & -1.003 & 0.160487 \tabularnewline
25 & -0.211258 & -1.4483 & 0.077084 \tabularnewline
26 & 0.275263 & 1.8871 & 0.032665 \tabularnewline
27 & -0.068659 & -0.4707 & 0.320016 \tabularnewline
28 & -0.048123 & -0.3299 & 0.371466 \tabularnewline
29 & 0.075952 & 0.5207 & 0.30251 \tabularnewline
30 & -0.136209 & -0.9338 & 0.177589 \tabularnewline
31 & 0.137025 & 0.9394 & 0.176166 \tabularnewline
32 & 0.033975 & 0.2329 & 0.408418 \tabularnewline
33 & -0.149394 & -1.0242 & 0.155493 \tabularnewline
34 & 0.034945 & 0.2396 & 0.405853 \tabularnewline
35 & 0.102427 & 0.7022 & 0.243008 \tabularnewline
36 & -0.077557 & -0.5317 & 0.298718 \tabularnewline
37 & 0.015985 & 0.1096 & 0.456601 \tabularnewline
38 & 0.013332 & 0.0914 & 0.463782 \tabularnewline
39 & -0.084452 & -0.579 & 0.282685 \tabularnewline
40 & 0.099926 & 0.6851 & 0.248335 \tabularnewline
41 & -0.018992 & -0.1302 & 0.448481 \tabularnewline
42 & -0.066001 & -0.4525 & 0.326503 \tabularnewline
43 & 0.044663 & 0.3062 & 0.380406 \tabularnewline
44 & 0.01732 & 0.1187 & 0.452995 \tabularnewline
45 & -0.024178 & -0.1658 & 0.43453 \tabularnewline
46 & -0.012774 & -0.0876 & 0.465293 \tabularnewline
47 & NA & NA & NA \tabularnewline
48 & NA & NA & NA \tabularnewline
\hline
\end{tabular}
%Source: https://freestatistics.org/blog/index.php?pk=32708&T=1

[TABLE]
[ROW][C]Autocorrelation Function[/C][/ROW]
[ROW][C]Time lag k[/C][C]ACF(k)[/C][C]T-STAT[/C][C]P-value[/C][/ROW]
[ROW][C]1[/C][C]-0.455532[/C][C]-3.123[/C][C]0.001531[/C][/ROW]
[ROW][C]2[/C][C]-0.210093[/C][C]-1.4403[/C][C]0.078202[/C][/ROW]
[ROW][C]3[/C][C]0.271328[/C][C]1.8601[/C][C]0.034566[/C][/ROW]
[ROW][C]4[/C][C]-0.085186[/C][C]-0.584[/C][C]0.281004[/C][/ROW]
[ROW][C]5[/C][C]0.040246[/C][C]0.2759[/C][C]0.391912[/C][/ROW]
[ROW][C]6[/C][C]0.044658[/C][C]0.3062[/C][C]0.380416[/C][/ROW]
[ROW][C]7[/C][C]-0.172122[/C][C]-1.18[/C][C]0.121967[/C][/ROW]
[ROW][C]8[/C][C]-0.0105[/C][C]-0.072[/C][C]0.47146[/C][/ROW]
[ROW][C]9[/C][C]0.266603[/C][C]1.8277[/C][C]0.03697[/C][/ROW]
[ROW][C]10[/C][C]-0.119247[/C][C]-0.8175[/C][C]0.208879[/C][/ROW]
[ROW][C]11[/C][C]-0.14687[/C][C]-1.0069[/C][C]0.159572[/C][/ROW]
[ROW][C]12[/C][C]0.094822[/C][C]0.6501[/C][C]0.259407[/C][/ROW]
[ROW][C]13[/C][C]-0.09278[/C][C]-0.6361[/C][C]0.26391[/C][/ROW]
[ROW][C]14[/C][C]0.291679[/C][C]1.9996[/C][C]0.025668[/C][/ROW]
[ROW][C]15[/C][C]-0.184758[/C][C]-1.2666[/C][C]0.105763[/C][/ROW]
[ROW][C]16[/C][C]-0.201514[/C][C]-1.3815[/C][C]0.086827[/C][/ROW]
[ROW][C]17[/C][C]0.286894[/C][C]1.9668[/C][C]0.02756[/C][/ROW]
[ROW][C]18[/C][C]-0.044873[/C][C]-0.3076[/C][C]0.379859[/C][/ROW]
[ROW][C]19[/C][C]-0.068891[/C][C]-0.4723[/C][C]0.319452[/C][/ROW]
[ROW][C]20[/C][C]-0.02916[/C][C]-0.1999[/C][C]0.421207[/C][/ROW]
[ROW][C]21[/C][C]0.100035[/C][C]0.6858[/C][C]0.248102[/C][/ROW]
[ROW][C]22[/C][C]-0.156725[/C][C]-1.0745[/C][C]0.144052[/C][/ROW]
[ROW][C]23[/C][C]0.275082[/C][C]1.8859[/C][C]0.032751[/C][/ROW]
[ROW][C]24[/C][C]-0.146309[/C][C]-1.003[/C][C]0.160487[/C][/ROW]
[ROW][C]25[/C][C]-0.211258[/C][C]-1.4483[/C][C]0.077084[/C][/ROW]
[ROW][C]26[/C][C]0.275263[/C][C]1.8871[/C][C]0.032665[/C][/ROW]
[ROW][C]27[/C][C]-0.068659[/C][C]-0.4707[/C][C]0.320016[/C][/ROW]
[ROW][C]28[/C][C]-0.048123[/C][C]-0.3299[/C][C]0.371466[/C][/ROW]
[ROW][C]29[/C][C]0.075952[/C][C]0.5207[/C][C]0.30251[/C][/ROW]
[ROW][C]30[/C][C]-0.136209[/C][C]-0.9338[/C][C]0.177589[/C][/ROW]
[ROW][C]31[/C][C]0.137025[/C][C]0.9394[/C][C]0.176166[/C][/ROW]
[ROW][C]32[/C][C]0.033975[/C][C]0.2329[/C][C]0.408418[/C][/ROW]
[ROW][C]33[/C][C]-0.149394[/C][C]-1.0242[/C][C]0.155493[/C][/ROW]
[ROW][C]34[/C][C]0.034945[/C][C]0.2396[/C][C]0.405853[/C][/ROW]
[ROW][C]35[/C][C]0.102427[/C][C]0.7022[/C][C]0.243008[/C][/ROW]
[ROW][C]36[/C][C]-0.077557[/C][C]-0.5317[/C][C]0.298718[/C][/ROW]
[ROW][C]37[/C][C]0.015985[/C][C]0.1096[/C][C]0.456601[/C][/ROW]
[ROW][C]38[/C][C]0.013332[/C][C]0.0914[/C][C]0.463782[/C][/ROW]
[ROW][C]39[/C][C]-0.084452[/C][C]-0.579[/C][C]0.282685[/C][/ROW]
[ROW][C]40[/C][C]0.099926[/C][C]0.6851[/C][C]0.248335[/C][/ROW]
[ROW][C]41[/C][C]-0.018992[/C][C]-0.1302[/C][C]0.448481[/C][/ROW]
[ROW][C]42[/C][C]-0.066001[/C][C]-0.4525[/C][C]0.326503[/C][/ROW]
[ROW][C]43[/C][C]0.044663[/C][C]0.3062[/C][C]0.380406[/C][/ROW]
[ROW][C]44[/C][C]0.01732[/C][C]0.1187[/C][C]0.452995[/C][/ROW]
[ROW][C]45[/C][C]-0.024178[/C][C]-0.1658[/C][C]0.43453[/C][/ROW]
[ROW][C]46[/C][C]-0.012774[/C][C]-0.0876[/C][C]0.465293[/C][/ROW]
[ROW][C]47[/C][C]NA[/C][C]NA[/C][C]NA[/C][/ROW]
[ROW][C]48[/C][C]NA[/C][C]NA[/C][C]NA[/C][/ROW]
[/TABLE]
Source: https://freestatistics.org/blog/index.php?pk=32708&T=1

Globally Unique Identifier (entire table): ba.freestatistics.org/blog/index.php?pk=32708&T=1

As an alternative you can also use a QR Code:  

The GUIDs for individual cells are displayed in the table below:

Autocorrelation Function
Time lag kACF(k)T-STATP-value
1-0.455532-3.1230.001531
2-0.210093-1.44030.078202
30.2713281.86010.034566
4-0.085186-0.5840.281004
50.0402460.27590.391912
60.0446580.30620.380416
7-0.172122-1.180.121967
8-0.0105-0.0720.47146
90.2666031.82770.03697
10-0.119247-0.81750.208879
11-0.14687-1.00690.159572
120.0948220.65010.259407
13-0.09278-0.63610.26391
140.2916791.99960.025668
15-0.184758-1.26660.105763
16-0.201514-1.38150.086827
170.2868941.96680.02756
18-0.044873-0.30760.379859
19-0.068891-0.47230.319452
20-0.02916-0.19990.421207
210.1000350.68580.248102
22-0.156725-1.07450.144052
230.2750821.88590.032751
24-0.146309-1.0030.160487
25-0.211258-1.44830.077084
260.2752631.88710.032665
27-0.068659-0.47070.320016
28-0.048123-0.32990.371466
290.0759520.52070.30251
30-0.136209-0.93380.177589
310.1370250.93940.176166
320.0339750.23290.408418
33-0.149394-1.02420.155493
340.0349450.23960.405853
350.1024270.70220.243008
36-0.077557-0.53170.298718
370.0159850.10960.456601
380.0133320.09140.463782
39-0.084452-0.5790.282685
400.0999260.68510.248335
41-0.018992-0.13020.448481
42-0.066001-0.45250.326503
430.0446630.30620.380406
440.017320.11870.452995
45-0.024178-0.16580.43453
46-0.012774-0.08760.465293
47NANANA
48NANANA


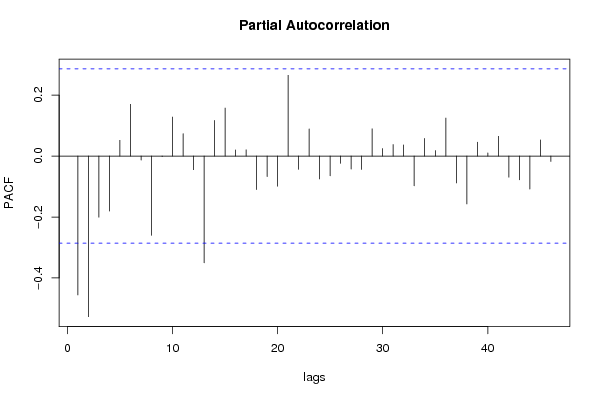
Partial Autocorrelation Function
Time lag kPACF(k)T-STATP-value
1-0.455532-3.1230.001531
2-0.52695-3.61260.000368
3-0.200635-1.37550.087751
4-0.180555-1.23780.110965
50.0519260.3560.361723
60.1697051.16340.125262
7-0.013098-0.08980.464416
8-0.260042-1.78280.040543
9-0.001708-0.01170.495355
100.1282130.8790.191941
110.0735730.50440.308171
12-0.044583-0.30560.380611
13-0.350254-2.40120.010175
140.1168280.80090.213601
150.1575541.08010.142796
160.0199770.1370.445826
170.0205910.14120.444172
18-0.109793-0.75270.22769
19-0.067289-0.46130.323351
20-0.098864-0.67780.250619
210.2650361.8170.037798
22-0.043619-0.2990.383116
230.0892330.61170.271826
24-0.075179-0.51540.304345
25-0.064786-0.44410.329487
26-0.023885-0.16370.435317
27-0.042784-0.29330.385289
28-0.043766-0.30.382732
290.0895310.61380.271156
300.0244590.16770.433775
310.0376240.25790.398791
320.0366190.2510.401436
33-0.097799-0.67050.252917
340.057860.39670.346703
350.0181860.12470.450654
360.1246820.85480.198506
37-0.088305-0.60540.273917
38-0.15716-1.07740.143393
390.0456960.31330.377728
400.0101250.06940.472477
410.0649510.44530.32908
42-0.069164-0.47420.31879
43-0.077934-0.53430.297829
44-0.108437-0.74340.230469
450.0528220.36210.35944
46-0.017811-0.12210.451667
47NANANA
48NANANA

\begin{tabular}{lllllllll}
\hline
Partial Autocorrelation Function \tabularnewline
Time lag k & PACF(k) & T-STAT & P-value \tabularnewline
1 & -0.455532 & -3.123 & 0.001531 \tabularnewline
2 & -0.52695 & -3.6126 & 0.000368 \tabularnewline
3 & -0.200635 & -1.3755 & 0.087751 \tabularnewline
4 & -0.180555 & -1.2378 & 0.110965 \tabularnewline
5 & 0.051926 & 0.356 & 0.361723 \tabularnewline
6 & 0.169705 & 1.1634 & 0.125262 \tabularnewline
7 & -0.013098 & -0.0898 & 0.464416 \tabularnewline
8 & -0.260042 & -1.7828 & 0.040543 \tabularnewline
9 & -0.001708 & -0.0117 & 0.495355 \tabularnewline
10 & 0.128213 & 0.879 & 0.191941 \tabularnewline
11 & 0.073573 & 0.5044 & 0.308171 \tabularnewline
12 & -0.044583 & -0.3056 & 0.380611 \tabularnewline
13 & -0.350254 & -2.4012 & 0.010175 \tabularnewline
14 & 0.116828 & 0.8009 & 0.213601 \tabularnewline
15 & 0.157554 & 1.0801 & 0.142796 \tabularnewline
16 & 0.019977 & 0.137 & 0.445826 \tabularnewline
17 & 0.020591 & 0.1412 & 0.444172 \tabularnewline
18 & -0.109793 & -0.7527 & 0.22769 \tabularnewline
19 & -0.067289 & -0.4613 & 0.323351 \tabularnewline
20 & -0.098864 & -0.6778 & 0.250619 \tabularnewline
21 & 0.265036 & 1.817 & 0.037798 \tabularnewline
22 & -0.043619 & -0.299 & 0.383116 \tabularnewline
23 & 0.089233 & 0.6117 & 0.271826 \tabularnewline
24 & -0.075179 & -0.5154 & 0.304345 \tabularnewline
25 & -0.064786 & -0.4441 & 0.329487 \tabularnewline
26 & -0.023885 & -0.1637 & 0.435317 \tabularnewline
27 & -0.042784 & -0.2933 & 0.385289 \tabularnewline
28 & -0.043766 & -0.3 & 0.382732 \tabularnewline
29 & 0.089531 & 0.6138 & 0.271156 \tabularnewline
30 & 0.024459 & 0.1677 & 0.433775 \tabularnewline
31 & 0.037624 & 0.2579 & 0.398791 \tabularnewline
32 & 0.036619 & 0.251 & 0.401436 \tabularnewline
33 & -0.097799 & -0.6705 & 0.252917 \tabularnewline
34 & 0.05786 & 0.3967 & 0.346703 \tabularnewline
35 & 0.018186 & 0.1247 & 0.450654 \tabularnewline
36 & 0.124682 & 0.8548 & 0.198506 \tabularnewline
37 & -0.088305 & -0.6054 & 0.273917 \tabularnewline
38 & -0.15716 & -1.0774 & 0.143393 \tabularnewline
39 & 0.045696 & 0.3133 & 0.377728 \tabularnewline
40 & 0.010125 & 0.0694 & 0.472477 \tabularnewline
41 & 0.064951 & 0.4453 & 0.32908 \tabularnewline
42 & -0.069164 & -0.4742 & 0.31879 \tabularnewline
43 & -0.077934 & -0.5343 & 0.297829 \tabularnewline
44 & -0.108437 & -0.7434 & 0.230469 \tabularnewline
45 & 0.052822 & 0.3621 & 0.35944 \tabularnewline
46 & -0.017811 & -0.1221 & 0.451667 \tabularnewline
47 & NA & NA & NA \tabularnewline
48 & NA & NA & NA \tabularnewline
\hline
\end{tabular}
%Source: https://freestatistics.org/blog/index.php?pk=32708&T=2

[TABLE]
[ROW][C]Partial Autocorrelation Function[/C][/ROW]
[ROW][C]Time lag k[/C][C]PACF(k)[/C][C]T-STAT[/C][C]P-value[/C][/ROW]
[ROW][C]1[/C][C]-0.455532[/C][C]-3.123[/C][C]0.001531[/C][/ROW]
[ROW][C]2[/C][C]-0.52695[/C][C]-3.6126[/C][C]0.000368[/C][/ROW]
[ROW][C]3[/C][C]-0.200635[/C][C]-1.3755[/C][C]0.087751[/C][/ROW]
[ROW][C]4[/C][C]-0.180555[/C][C]-1.2378[/C][C]0.110965[/C][/ROW]
[ROW][C]5[/C][C]0.051926[/C][C]0.356[/C][C]0.361723[/C][/ROW]
[ROW][C]6[/C][C]0.169705[/C][C]1.1634[/C][C]0.125262[/C][/ROW]
[ROW][C]7[/C][C]-0.013098[/C][C]-0.0898[/C][C]0.464416[/C][/ROW]
[ROW][C]8[/C][C]-0.260042[/C][C]-1.7828[/C][C]0.040543[/C][/ROW]
[ROW][C]9[/C][C]-0.001708[/C][C]-0.0117[/C][C]0.495355[/C][/ROW]
[ROW][C]10[/C][C]0.128213[/C][C]0.879[/C][C]0.191941[/C][/ROW]
[ROW][C]11[/C][C]0.073573[/C][C]0.5044[/C][C]0.308171[/C][/ROW]
[ROW][C]12[/C][C]-0.044583[/C][C]-0.3056[/C][C]0.380611[/C][/ROW]
[ROW][C]13[/C][C]-0.350254[/C][C]-2.4012[/C][C]0.010175[/C][/ROW]
[ROW][C]14[/C][C]0.116828[/C][C]0.8009[/C][C]0.213601[/C][/ROW]
[ROW][C]15[/C][C]0.157554[/C][C]1.0801[/C][C]0.142796[/C][/ROW]
[ROW][C]16[/C][C]0.019977[/C][C]0.137[/C][C]0.445826[/C][/ROW]
[ROW][C]17[/C][C]0.020591[/C][C]0.1412[/C][C]0.444172[/C][/ROW]
[ROW][C]18[/C][C]-0.109793[/C][C]-0.7527[/C][C]0.22769[/C][/ROW]
[ROW][C]19[/C][C]-0.067289[/C][C]-0.4613[/C][C]0.323351[/C][/ROW]
[ROW][C]20[/C][C]-0.098864[/C][C]-0.6778[/C][C]0.250619[/C][/ROW]
[ROW][C]21[/C][C]0.265036[/C][C]1.817[/C][C]0.037798[/C][/ROW]
[ROW][C]22[/C][C]-0.043619[/C][C]-0.299[/C][C]0.383116[/C][/ROW]
[ROW][C]23[/C][C]0.089233[/C][C]0.6117[/C][C]0.271826[/C][/ROW]
[ROW][C]24[/C][C]-0.075179[/C][C]-0.5154[/C][C]0.304345[/C][/ROW]
[ROW][C]25[/C][C]-0.064786[/C][C]-0.4441[/C][C]0.329487[/C][/ROW]
[ROW][C]26[/C][C]-0.023885[/C][C]-0.1637[/C][C]0.435317[/C][/ROW]
[ROW][C]27[/C][C]-0.042784[/C][C]-0.2933[/C][C]0.385289[/C][/ROW]
[ROW][C]28[/C][C]-0.043766[/C][C]-0.3[/C][C]0.382732[/C][/ROW]
[ROW][C]29[/C][C]0.089531[/C][C]0.6138[/C][C]0.271156[/C][/ROW]
[ROW][C]30[/C][C]0.024459[/C][C]0.1677[/C][C]0.433775[/C][/ROW]
[ROW][C]31[/C][C]0.037624[/C][C]0.2579[/C][C]0.398791[/C][/ROW]
[ROW][C]32[/C][C]0.036619[/C][C]0.251[/C][C]0.401436[/C][/ROW]
[ROW][C]33[/C][C]-0.097799[/C][C]-0.6705[/C][C]0.252917[/C][/ROW]
[ROW][C]34[/C][C]0.05786[/C][C]0.3967[/C][C]0.346703[/C][/ROW]
[ROW][C]35[/C][C]0.018186[/C][C]0.1247[/C][C]0.450654[/C][/ROW]
[ROW][C]36[/C][C]0.124682[/C][C]0.8548[/C][C]0.198506[/C][/ROW]
[ROW][C]37[/C][C]-0.088305[/C][C]-0.6054[/C][C]0.273917[/C][/ROW]
[ROW][C]38[/C][C]-0.15716[/C][C]-1.0774[/C][C]0.143393[/C][/ROW]
[ROW][C]39[/C][C]0.045696[/C][C]0.3133[/C][C]0.377728[/C][/ROW]
[ROW][C]40[/C][C]0.010125[/C][C]0.0694[/C][C]0.472477[/C][/ROW]
[ROW][C]41[/C][C]0.064951[/C][C]0.4453[/C][C]0.32908[/C][/ROW]
[ROW][C]42[/C][C]-0.069164[/C][C]-0.4742[/C][C]0.31879[/C][/ROW]
[ROW][C]43[/C][C]-0.077934[/C][C]-0.5343[/C][C]0.297829[/C][/ROW]
[ROW][C]44[/C][C]-0.108437[/C][C]-0.7434[/C][C]0.230469[/C][/ROW]
[ROW][C]45[/C][C]0.052822[/C][C]0.3621[/C][C]0.35944[/C][/ROW]
[ROW][C]46[/C][C]-0.017811[/C][C]-0.1221[/C][C]0.451667[/C][/ROW]
[ROW][C]47[/C][C]NA[/C][C]NA[/C][C]NA[/C][/ROW]
[ROW][C]48[/C][C]NA[/C][C]NA[/C][C]NA[/C][/ROW]
[/TABLE]
Source: https://freestatistics.org/blog/index.php?pk=32708&T=2

Globally Unique Identifier (entire table): ba.freestatistics.org/blog/index.php?pk=32708&T=2

As an alternative you can also use a QR Code:  

The GUIDs for individual cells are displayed in the table below:

Partial Autocorrelation Function
Time lag kPACF(k)T-STATP-value
1-0.455532-3.1230.001531
2-0.52695-3.61260.000368
3-0.200635-1.37550.087751
4-0.180555-1.23780.110965
50.0519260.3560.361723
60.1697051.16340.125262
7-0.013098-0.08980.464416
8-0.260042-1.78280.040543
9-0.001708-0.01170.495355
100.1282130.8790.191941
110.0735730.50440.308171
12-0.044583-0.30560.380611
13-0.350254-2.40120.010175
140.1168280.80090.213601
150.1575541.08010.142796
160.0199770.1370.445826
170.0205910.14120.444172
18-0.109793-0.75270.22769
19-0.067289-0.46130.323351
20-0.098864-0.67780.250619
210.2650361.8170.037798
22-0.043619-0.2990.383116
230.0892330.61170.271826
24-0.075179-0.51540.304345
25-0.064786-0.44410.329487
26-0.023885-0.16370.435317
27-0.042784-0.29330.385289
28-0.043766-0.30.382732
290.0895310.61380.271156
300.0244590.16770.433775
310.0376240.25790.398791
320.0366190.2510.401436
33-0.097799-0.67050.252917
340.057860.39670.346703
350.0181860.12470.450654
360.1246820.85480.198506
37-0.088305-0.60540.273917
38-0.15716-1.07740.143393
390.0456960.31330.377728
400.0101250.06940.472477
410.0649510.44530.32908
42-0.069164-0.47420.31879
43-0.077934-0.53430.297829
44-0.108437-0.74340.230469
450.0528220.36210.35944
46-0.017811-0.12210.451667
47NANANA
48NANANA


Parameters (Session):
par1 = 12 ;
Parameters (R input):
par1 = 48 ; par2 = 1 ; par3 = 1 ; par4 = 1 ; par5 = 12 ;
R code (references can be found in the software module):
if (par1 == 'Default') {
par1 = 10*log10(length(x))
} else {
par1 <- as.numeric(par1)
}
par2 <- as.numeric(par2)
par3 <- as.numeric(par3)
par4 <- as.numeric(par4)
par5 <- as.numeric(par5)
if (par2 == 0) {
x <- log(x)
} else {
x <- (x ^ par2 - 1) / par2
}
if (par3 > 0) x <- diff(x,lag=1,difference=par3)
if (par4 > 0) x <- diff(x,lag=par5,difference=par4)
bitmap(file='pic1.png')
racf <- acf(x,par1,main='Autocorrelation',xlab='lags',ylab='ACF')
dev.off()
bitmap(file='pic2.png')
rpacf <- pacf(x,par1,main='Partial Autocorrelation',xlab='lags',ylab='PACF')
dev.off()
(myacf <- c(racf$acf))
(mypacf <- c(rpacf$acf))
lengthx <- length(x)
sqrtn <- sqrt(lengthx)
load(file='createtable')
a<-table.start()
a<-table.row.start(a)
a<-table.element(a,'Autocorrelation Function',4,TRUE)
a<-table.row.end(a)
a<-table.row.start(a)
a<-table.element(a,'Time lag k',header=TRUE)
a<-table.element(a,hyperlink('basics.htm','ACF(k)','click here for more information about the Autocorrelation Function'),header=TRUE)
a<-table.element(a,'T-STAT',header=TRUE)
a<-table.element(a,'P-value',header=TRUE)
a<-table.row.end(a)
for (i in 2:(par1+1)) {
a<-table.row.start(a)
a<-table.element(a,i-1,header=TRUE)
a<-table.element(a,round(myacf[i],6))
mytstat <- myacf[i]*sqrtn
a<-table.element(a,round(mytstat,4))
a<-table.element(a,round(1-pt(abs(mytstat),lengthx),6))
a<-table.row.end(a)
}
a<-table.end(a)
table.save(a,file='mytable.tab')
a<-table.start()
a<-table.row.start(a)
a<-table.element(a,'Partial Autocorrelation Function',4,TRUE)
a<-table.row.end(a)
a<-table.row.start(a)
a<-table.element(a,'Time lag k',header=TRUE)
a<-table.element(a,hyperlink('basics.htm','PACF(k)','click here for more information about the Partial Autocorrelation Function'),header=TRUE)
a<-table.element(a,'T-STAT',header=TRUE)
a<-table.element(a,'P-value',header=TRUE)
a<-table.row.end(a)
for (i in 1:par1) {
a<-table.row.start(a)
a<-table.element(a,i,header=TRUE)
a<-table.element(a,round(mypacf[i],6))
mytstat <- mypacf[i]*sqrtn
a<-table.element(a,round(mytstat,4))
a<-table.element(a,round(1-pt(abs(mytstat),lengthx),6))
a<-table.row.end(a)
}
a<-table.end(a)
table.save(a,file='mytable1.tab')