Free Statistics

of Irreproducible Research!

Author's title

Author*The author of this computation has been verified*
R Software Modulerwasp_autocorrelation.wasp
Title produced by software(Partial) Autocorrelation Function
Date of computationFri, 12 Dec 2008 06:27:42 -0700
Cite this page as followsStatistical Computations at FreeStatistics.org, Office for Research Development and Education, URL https://freestatistics.org/blog/index.php?v=date/2008/Dec/12/t1229088513rzit2xzkgxpn96h.htm/, Retrieved Sun, 19 May 2024 07:19:48 +0000
Statistical Computations at FreeStatistics.org, Office for Research Development and Education, URL https://freestatistics.org/blog/index.php?pk=32704, Retrieved Sun, 19 May 2024 07:19:48 +0000
QR Codes:

Original text written by user:
IsPrivate?No (this computation is public)
User-defined keywords
Estimated Impact201
Family? (F = Feedback message, R = changed R code, M = changed R Module, P = changed Parameters, D = changed Data)
-     [Univariate Data Series] [Uitvoer.Nederland] [2008-12-03 15:11:10] [988ab43f527fc78aae41c84649095267]
-   P   [Univariate Data Series] [Export From Belgi...] [2008-12-03 15:52:29] [988ab43f527fc78aae41c84649095267]
- RMP     [(Partial) Autocorrelation Function] [Partial Autocorre...] [2008-12-03 16:01:07] [988ab43f527fc78aae41c84649095267]
-    D      [(Partial) Autocorrelation Function] [Partial Autocorre...] [2008-12-11 17:24:10] [988ab43f527fc78aae41c84649095267]
-   P           [(Partial) Autocorrelation Function] [Partial Autocorre...] [2008-12-12 13:27:42] [5d823194959040fa9b19b8c8302177e6] [Current]
Feedback Forum

Post a new message
Dataseries X:
13807.9
14101.7
16010.3
14633.1
14478.5
15327.3
14179.5
11398.2
16111.5
15887.4
14529.3
13923.1
13960.2
14807.8
17511.5
15845.9
14594.2
17252.2
14832.8
13132.1
17665.9
16913
17318.8
16224.2
15469.6
16557.5
19414.8
17335
16525.2
18160.4
15553.8
15262.2
18581
17564.1
18948.6
17187.8
17564.8
17668.4
20811.7
17257.8
18984.2
20532.6
17082.3
16894.9
20274.9
20078.6
19900.9
17012.2
19642.9
19024
21691
18835.9
19873.4
21468.2
19406.8
18385.3
20739.3
22268.3
21569
17514.8


Summary of computational transaction
Raw Inputview raw input (R code)
Raw Outputview raw output of R engine
Computing time1 seconds
R Server'Gwilym Jenkins' @ 72.249.127.135

\begin{tabular}{lllllllll}
\hline
Summary of computational transaction \tabularnewline
Raw Input & view raw input (R code)  \tabularnewline
Raw Output & view raw output of R engine  \tabularnewline
Computing time & 1 seconds \tabularnewline
R Server & 'Gwilym Jenkins' @ 72.249.127.135 \tabularnewline
\hline
\end{tabular}
%Source: https://freestatistics.org/blog/index.php?pk=32704&T=0

[TABLE]
[ROW][C]Summary of computational transaction[/C][/ROW]
[ROW][C]Raw Input[/C][C]view raw input (R code) [/C][/ROW]
[ROW][C]Raw Output[/C][C]view raw output of R engine [/C][/ROW]
[ROW][C]Computing time[/C][C]1 seconds[/C][/ROW]
[ROW][C]R Server[/C][C]'Gwilym Jenkins' @ 72.249.127.135[/C][/ROW]
[/TABLE]
Source: https://freestatistics.org/blog/index.php?pk=32704&T=0

Globally Unique Identifier (entire table): ba.freestatistics.org/blog/index.php?pk=32704&T=0

As an alternative you can also use a QR Code:  

The GUIDs for individual cells are displayed in the table below:

Summary of computational transaction
Raw Inputview raw input (R code)
Raw Outputview raw output of R engine
Computing time1 seconds
R Server'Gwilym Jenkins' @ 72.249.127.135


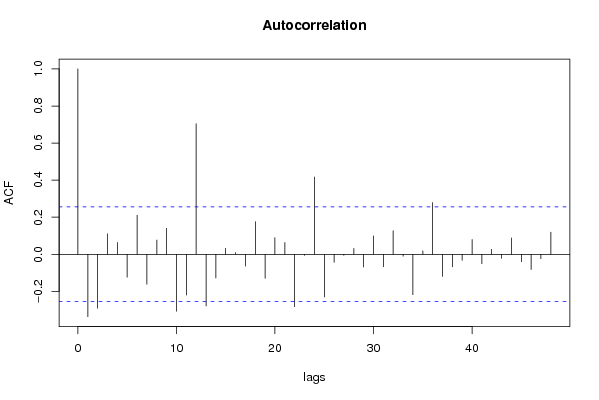
Autocorrelation Function
Time lag kACF(k)T-STATP-value
1-0.336637-2.58580.006103
2-0.291218-2.23690.014543
30.1104230.84820.199885
40.0635640.48820.313592
5-0.123693-0.95010.172967
60.2111931.62220.055046
7-0.16151-1.24060.109835
80.0769320.59090.278413
90.1402981.07760.142788
10-0.306925-2.35750.010866
11-0.220035-1.69010.048141
120.7048525.41411e-06
13-0.279093-2.14380.018092
14-0.127751-0.98130.165232
150.0321170.24670.403002
160.0082530.06340.474833
17-0.063746-0.48960.313101
180.1758181.35050.091009
19-0.129557-0.99510.161865
200.0896480.68860.246887
210.0629620.48360.315222
22-0.282823-2.17240.016927
23-0.005773-0.04430.48239
240.4165143.19930.001109
25-0.230096-1.76740.041166
26-0.043729-0.33590.369072
27-0.00558-0.04290.482978
280.031390.24110.405154
29-0.068048-0.52270.301576
300.0988890.75960.225264
31-0.067283-0.51680.303611
320.1269460.97510.166748
33-0.010339-0.07940.468486
34-0.217965-1.67420.04969
350.0183270.14080.444265
360.279252.1450.018042
37-0.11968-0.91930.180846
38-0.067973-0.52210.301773
39-0.032931-0.25290.400594
400.0796750.6120.271446
41-0.050623-0.38880.349396
420.0265220.20370.419636
43-0.02204-0.16930.433074
440.0880410.67630.250759
45-0.040379-0.31020.378767
46-0.082161-0.63110.26521
47-0.024179-0.18570.426649
480.1192570.9160.18169

\begin{tabular}{lllllllll}
\hline
Autocorrelation Function \tabularnewline
Time lag k & ACF(k) & T-STAT & P-value \tabularnewline
1 & -0.336637 & -2.5858 & 0.006103 \tabularnewline
2 & -0.291218 & -2.2369 & 0.014543 \tabularnewline
3 & 0.110423 & 0.8482 & 0.199885 \tabularnewline
4 & 0.063564 & 0.4882 & 0.313592 \tabularnewline
5 & -0.123693 & -0.9501 & 0.172967 \tabularnewline
6 & 0.211193 & 1.6222 & 0.055046 \tabularnewline
7 & -0.16151 & -1.2406 & 0.109835 \tabularnewline
8 & 0.076932 & 0.5909 & 0.278413 \tabularnewline
9 & 0.140298 & 1.0776 & 0.142788 \tabularnewline
10 & -0.306925 & -2.3575 & 0.010866 \tabularnewline
11 & -0.220035 & -1.6901 & 0.048141 \tabularnewline
12 & 0.704852 & 5.4141 & 1e-06 \tabularnewline
13 & -0.279093 & -2.1438 & 0.018092 \tabularnewline
14 & -0.127751 & -0.9813 & 0.165232 \tabularnewline
15 & 0.032117 & 0.2467 & 0.403002 \tabularnewline
16 & 0.008253 & 0.0634 & 0.474833 \tabularnewline
17 & -0.063746 & -0.4896 & 0.313101 \tabularnewline
18 & 0.175818 & 1.3505 & 0.091009 \tabularnewline
19 & -0.129557 & -0.9951 & 0.161865 \tabularnewline
20 & 0.089648 & 0.6886 & 0.246887 \tabularnewline
21 & 0.062962 & 0.4836 & 0.315222 \tabularnewline
22 & -0.282823 & -2.1724 & 0.016927 \tabularnewline
23 & -0.005773 & -0.0443 & 0.48239 \tabularnewline
24 & 0.416514 & 3.1993 & 0.001109 \tabularnewline
25 & -0.230096 & -1.7674 & 0.041166 \tabularnewline
26 & -0.043729 & -0.3359 & 0.369072 \tabularnewline
27 & -0.00558 & -0.0429 & 0.482978 \tabularnewline
28 & 0.03139 & 0.2411 & 0.405154 \tabularnewline
29 & -0.068048 & -0.5227 & 0.301576 \tabularnewline
30 & 0.098889 & 0.7596 & 0.225264 \tabularnewline
31 & -0.067283 & -0.5168 & 0.303611 \tabularnewline
32 & 0.126946 & 0.9751 & 0.166748 \tabularnewline
33 & -0.010339 & -0.0794 & 0.468486 \tabularnewline
34 & -0.217965 & -1.6742 & 0.04969 \tabularnewline
35 & 0.018327 & 0.1408 & 0.444265 \tabularnewline
36 & 0.27925 & 2.145 & 0.018042 \tabularnewline
37 & -0.11968 & -0.9193 & 0.180846 \tabularnewline
38 & -0.067973 & -0.5221 & 0.301773 \tabularnewline
39 & -0.032931 & -0.2529 & 0.400594 \tabularnewline
40 & 0.079675 & 0.612 & 0.271446 \tabularnewline
41 & -0.050623 & -0.3888 & 0.349396 \tabularnewline
42 & 0.026522 & 0.2037 & 0.419636 \tabularnewline
43 & -0.02204 & -0.1693 & 0.433074 \tabularnewline
44 & 0.088041 & 0.6763 & 0.250759 \tabularnewline
45 & -0.040379 & -0.3102 & 0.378767 \tabularnewline
46 & -0.082161 & -0.6311 & 0.26521 \tabularnewline
47 & -0.024179 & -0.1857 & 0.426649 \tabularnewline
48 & 0.119257 & 0.916 & 0.18169 \tabularnewline
\hline
\end{tabular}
%Source: https://freestatistics.org/blog/index.php?pk=32704&T=1

[TABLE]
[ROW][C]Autocorrelation Function[/C][/ROW]
[ROW][C]Time lag k[/C][C]ACF(k)[/C][C]T-STAT[/C][C]P-value[/C][/ROW]
[ROW][C]1[/C][C]-0.336637[/C][C]-2.5858[/C][C]0.006103[/C][/ROW]
[ROW][C]2[/C][C]-0.291218[/C][C]-2.2369[/C][C]0.014543[/C][/ROW]
[ROW][C]3[/C][C]0.110423[/C][C]0.8482[/C][C]0.199885[/C][/ROW]
[ROW][C]4[/C][C]0.063564[/C][C]0.4882[/C][C]0.313592[/C][/ROW]
[ROW][C]5[/C][C]-0.123693[/C][C]-0.9501[/C][C]0.172967[/C][/ROW]
[ROW][C]6[/C][C]0.211193[/C][C]1.6222[/C][C]0.055046[/C][/ROW]
[ROW][C]7[/C][C]-0.16151[/C][C]-1.2406[/C][C]0.109835[/C][/ROW]
[ROW][C]8[/C][C]0.076932[/C][C]0.5909[/C][C]0.278413[/C][/ROW]
[ROW][C]9[/C][C]0.140298[/C][C]1.0776[/C][C]0.142788[/C][/ROW]
[ROW][C]10[/C][C]-0.306925[/C][C]-2.3575[/C][C]0.010866[/C][/ROW]
[ROW][C]11[/C][C]-0.220035[/C][C]-1.6901[/C][C]0.048141[/C][/ROW]
[ROW][C]12[/C][C]0.704852[/C][C]5.4141[/C][C]1e-06[/C][/ROW]
[ROW][C]13[/C][C]-0.279093[/C][C]-2.1438[/C][C]0.018092[/C][/ROW]
[ROW][C]14[/C][C]-0.127751[/C][C]-0.9813[/C][C]0.165232[/C][/ROW]
[ROW][C]15[/C][C]0.032117[/C][C]0.2467[/C][C]0.403002[/C][/ROW]
[ROW][C]16[/C][C]0.008253[/C][C]0.0634[/C][C]0.474833[/C][/ROW]
[ROW][C]17[/C][C]-0.063746[/C][C]-0.4896[/C][C]0.313101[/C][/ROW]
[ROW][C]18[/C][C]0.175818[/C][C]1.3505[/C][C]0.091009[/C][/ROW]
[ROW][C]19[/C][C]-0.129557[/C][C]-0.9951[/C][C]0.161865[/C][/ROW]
[ROW][C]20[/C][C]0.089648[/C][C]0.6886[/C][C]0.246887[/C][/ROW]
[ROW][C]21[/C][C]0.062962[/C][C]0.4836[/C][C]0.315222[/C][/ROW]
[ROW][C]22[/C][C]-0.282823[/C][C]-2.1724[/C][C]0.016927[/C][/ROW]
[ROW][C]23[/C][C]-0.005773[/C][C]-0.0443[/C][C]0.48239[/C][/ROW]
[ROW][C]24[/C][C]0.416514[/C][C]3.1993[/C][C]0.001109[/C][/ROW]
[ROW][C]25[/C][C]-0.230096[/C][C]-1.7674[/C][C]0.041166[/C][/ROW]
[ROW][C]26[/C][C]-0.043729[/C][C]-0.3359[/C][C]0.369072[/C][/ROW]
[ROW][C]27[/C][C]-0.00558[/C][C]-0.0429[/C][C]0.482978[/C][/ROW]
[ROW][C]28[/C][C]0.03139[/C][C]0.2411[/C][C]0.405154[/C][/ROW]
[ROW][C]29[/C][C]-0.068048[/C][C]-0.5227[/C][C]0.301576[/C][/ROW]
[ROW][C]30[/C][C]0.098889[/C][C]0.7596[/C][C]0.225264[/C][/ROW]
[ROW][C]31[/C][C]-0.067283[/C][C]-0.5168[/C][C]0.303611[/C][/ROW]
[ROW][C]32[/C][C]0.126946[/C][C]0.9751[/C][C]0.166748[/C][/ROW]
[ROW][C]33[/C][C]-0.010339[/C][C]-0.0794[/C][C]0.468486[/C][/ROW]
[ROW][C]34[/C][C]-0.217965[/C][C]-1.6742[/C][C]0.04969[/C][/ROW]
[ROW][C]35[/C][C]0.018327[/C][C]0.1408[/C][C]0.444265[/C][/ROW]
[ROW][C]36[/C][C]0.27925[/C][C]2.145[/C][C]0.018042[/C][/ROW]
[ROW][C]37[/C][C]-0.11968[/C][C]-0.9193[/C][C]0.180846[/C][/ROW]
[ROW][C]38[/C][C]-0.067973[/C][C]-0.5221[/C][C]0.301773[/C][/ROW]
[ROW][C]39[/C][C]-0.032931[/C][C]-0.2529[/C][C]0.400594[/C][/ROW]
[ROW][C]40[/C][C]0.079675[/C][C]0.612[/C][C]0.271446[/C][/ROW]
[ROW][C]41[/C][C]-0.050623[/C][C]-0.3888[/C][C]0.349396[/C][/ROW]
[ROW][C]42[/C][C]0.026522[/C][C]0.2037[/C][C]0.419636[/C][/ROW]
[ROW][C]43[/C][C]-0.02204[/C][C]-0.1693[/C][C]0.433074[/C][/ROW]
[ROW][C]44[/C][C]0.088041[/C][C]0.6763[/C][C]0.250759[/C][/ROW]
[ROW][C]45[/C][C]-0.040379[/C][C]-0.3102[/C][C]0.378767[/C][/ROW]
[ROW][C]46[/C][C]-0.082161[/C][C]-0.6311[/C][C]0.26521[/C][/ROW]
[ROW][C]47[/C][C]-0.024179[/C][C]-0.1857[/C][C]0.426649[/C][/ROW]
[ROW][C]48[/C][C]0.119257[/C][C]0.916[/C][C]0.18169[/C][/ROW]
[/TABLE]
Source: https://freestatistics.org/blog/index.php?pk=32704&T=1

Globally Unique Identifier (entire table): ba.freestatistics.org/blog/index.php?pk=32704&T=1

As an alternative you can also use a QR Code:  

The GUIDs for individual cells are displayed in the table below:

Autocorrelation Function
Time lag kACF(k)T-STATP-value
1-0.336637-2.58580.006103
2-0.291218-2.23690.014543
30.1104230.84820.199885
40.0635640.48820.313592
5-0.123693-0.95010.172967
60.2111931.62220.055046
7-0.16151-1.24060.109835
80.0769320.59090.278413
90.1402981.07760.142788
10-0.306925-2.35750.010866
11-0.220035-1.69010.048141
120.7048525.41411e-06
13-0.279093-2.14380.018092
14-0.127751-0.98130.165232
150.0321170.24670.403002
160.0082530.06340.474833
17-0.063746-0.48960.313101
180.1758181.35050.091009
19-0.129557-0.99510.161865
200.0896480.68860.246887
210.0629620.48360.315222
22-0.282823-2.17240.016927
23-0.005773-0.04430.48239
240.4165143.19930.001109
25-0.230096-1.76740.041166
26-0.043729-0.33590.369072
27-0.00558-0.04290.482978
280.031390.24110.405154
29-0.068048-0.52270.301576
300.0988890.75960.225264
31-0.067283-0.51680.303611
320.1269460.97510.166748
33-0.010339-0.07940.468486
34-0.217965-1.67420.04969
350.0183270.14080.444265
360.279252.1450.018042
37-0.11968-0.91930.180846
38-0.067973-0.52210.301773
39-0.032931-0.25290.400594
400.0796750.6120.271446
41-0.050623-0.38880.349396
420.0265220.20370.419636
43-0.02204-0.16930.433074
440.0880410.67630.250759
45-0.040379-0.31020.378767
46-0.082161-0.63110.26521
47-0.024179-0.18570.426649
480.1192570.9160.18169


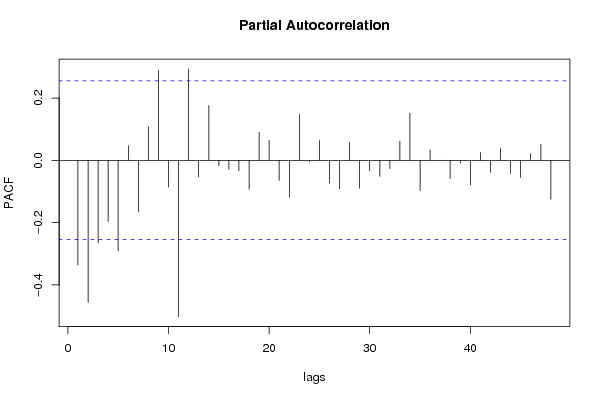
Partial Autocorrelation Function
Time lag kPACF(k)T-STATP-value
1-0.336637-2.58580.006103
2-0.456246-3.50450.00044
3-0.264818-2.03410.023222
4-0.197257-1.51520.067535
5-0.291135-2.23630.014565
60.0473620.36380.358657
7-0.165695-1.27270.104054
80.1066230.8190.208046
90.2891542.2210.0151
10-0.086189-0.6620.255265
11-0.502299-3.85820.000143
120.2934052.25370.013973
13-0.052755-0.40520.343392
140.1762921.35410.090431
15-0.01751-0.13450.446735
16-0.029223-0.22450.411586
17-0.033778-0.25950.398095
18-0.09332-0.71680.238161
190.0899340.69080.246201
200.0636090.48860.313471
21-0.06491-0.49860.309963
22-0.118054-0.90680.184103
230.1473011.13140.131224
24-0.005515-0.04240.483178
250.0638570.49050.312803
26-0.072848-0.55960.288951
27-0.091444-0.70240.242598
280.0572530.43980.330854
29-0.089663-0.68870.246851
30-0.033572-0.25790.398702
31-0.051563-0.39610.346744
32-0.026601-0.20430.419402
330.061270.47060.319823
340.1513271.16240.124884
35-0.096697-0.74270.230292
360.0331170.25440.400045
370.0008730.00670.497337
38-0.058336-0.44810.327866
39-0.008884-0.06820.472914
40-0.079777-0.61280.271188
410.0246250.18910.425314
42-0.038981-0.29940.382837
430.0380520.29230.385548
44-0.04234-0.32520.373083
45-0.054555-0.4190.338352
460.0214190.16450.434942
470.0517590.39760.346193
48-0.125157-0.96130.17015

\begin{tabular}{lllllllll}
\hline
Partial Autocorrelation Function \tabularnewline
Time lag k & PACF(k) & T-STAT & P-value \tabularnewline
1 & -0.336637 & -2.5858 & 0.006103 \tabularnewline
2 & -0.456246 & -3.5045 & 0.00044 \tabularnewline
3 & -0.264818 & -2.0341 & 0.023222 \tabularnewline
4 & -0.197257 & -1.5152 & 0.067535 \tabularnewline
5 & -0.291135 & -2.2363 & 0.014565 \tabularnewline
6 & 0.047362 & 0.3638 & 0.358657 \tabularnewline
7 & -0.165695 & -1.2727 & 0.104054 \tabularnewline
8 & 0.106623 & 0.819 & 0.208046 \tabularnewline
9 & 0.289154 & 2.221 & 0.0151 \tabularnewline
10 & -0.086189 & -0.662 & 0.255265 \tabularnewline
11 & -0.502299 & -3.8582 & 0.000143 \tabularnewline
12 & 0.293405 & 2.2537 & 0.013973 \tabularnewline
13 & -0.052755 & -0.4052 & 0.343392 \tabularnewline
14 & 0.176292 & 1.3541 & 0.090431 \tabularnewline
15 & -0.01751 & -0.1345 & 0.446735 \tabularnewline
16 & -0.029223 & -0.2245 & 0.411586 \tabularnewline
17 & -0.033778 & -0.2595 & 0.398095 \tabularnewline
18 & -0.09332 & -0.7168 & 0.238161 \tabularnewline
19 & 0.089934 & 0.6908 & 0.246201 \tabularnewline
20 & 0.063609 & 0.4886 & 0.313471 \tabularnewline
21 & -0.06491 & -0.4986 & 0.309963 \tabularnewline
22 & -0.118054 & -0.9068 & 0.184103 \tabularnewline
23 & 0.147301 & 1.1314 & 0.131224 \tabularnewline
24 & -0.005515 & -0.0424 & 0.483178 \tabularnewline
25 & 0.063857 & 0.4905 & 0.312803 \tabularnewline
26 & -0.072848 & -0.5596 & 0.288951 \tabularnewline
27 & -0.091444 & -0.7024 & 0.242598 \tabularnewline
28 & 0.057253 & 0.4398 & 0.330854 \tabularnewline
29 & -0.089663 & -0.6887 & 0.246851 \tabularnewline
30 & -0.033572 & -0.2579 & 0.398702 \tabularnewline
31 & -0.051563 & -0.3961 & 0.346744 \tabularnewline
32 & -0.026601 & -0.2043 & 0.419402 \tabularnewline
33 & 0.06127 & 0.4706 & 0.319823 \tabularnewline
34 & 0.151327 & 1.1624 & 0.124884 \tabularnewline
35 & -0.096697 & -0.7427 & 0.230292 \tabularnewline
36 & 0.033117 & 0.2544 & 0.400045 \tabularnewline
37 & 0.000873 & 0.0067 & 0.497337 \tabularnewline
38 & -0.058336 & -0.4481 & 0.327866 \tabularnewline
39 & -0.008884 & -0.0682 & 0.472914 \tabularnewline
40 & -0.079777 & -0.6128 & 0.271188 \tabularnewline
41 & 0.024625 & 0.1891 & 0.425314 \tabularnewline
42 & -0.038981 & -0.2994 & 0.382837 \tabularnewline
43 & 0.038052 & 0.2923 & 0.385548 \tabularnewline
44 & -0.04234 & -0.3252 & 0.373083 \tabularnewline
45 & -0.054555 & -0.419 & 0.338352 \tabularnewline
46 & 0.021419 & 0.1645 & 0.434942 \tabularnewline
47 & 0.051759 & 0.3976 & 0.346193 \tabularnewline
48 & -0.125157 & -0.9613 & 0.17015 \tabularnewline
\hline
\end{tabular}
%Source: https://freestatistics.org/blog/index.php?pk=32704&T=2

[TABLE]
[ROW][C]Partial Autocorrelation Function[/C][/ROW]
[ROW][C]Time lag k[/C][C]PACF(k)[/C][C]T-STAT[/C][C]P-value[/C][/ROW]
[ROW][C]1[/C][C]-0.336637[/C][C]-2.5858[/C][C]0.006103[/C][/ROW]
[ROW][C]2[/C][C]-0.456246[/C][C]-3.5045[/C][C]0.00044[/C][/ROW]
[ROW][C]3[/C][C]-0.264818[/C][C]-2.0341[/C][C]0.023222[/C][/ROW]
[ROW][C]4[/C][C]-0.197257[/C][C]-1.5152[/C][C]0.067535[/C][/ROW]
[ROW][C]5[/C][C]-0.291135[/C][C]-2.2363[/C][C]0.014565[/C][/ROW]
[ROW][C]6[/C][C]0.047362[/C][C]0.3638[/C][C]0.358657[/C][/ROW]
[ROW][C]7[/C][C]-0.165695[/C][C]-1.2727[/C][C]0.104054[/C][/ROW]
[ROW][C]8[/C][C]0.106623[/C][C]0.819[/C][C]0.208046[/C][/ROW]
[ROW][C]9[/C][C]0.289154[/C][C]2.221[/C][C]0.0151[/C][/ROW]
[ROW][C]10[/C][C]-0.086189[/C][C]-0.662[/C][C]0.255265[/C][/ROW]
[ROW][C]11[/C][C]-0.502299[/C][C]-3.8582[/C][C]0.000143[/C][/ROW]
[ROW][C]12[/C][C]0.293405[/C][C]2.2537[/C][C]0.013973[/C][/ROW]
[ROW][C]13[/C][C]-0.052755[/C][C]-0.4052[/C][C]0.343392[/C][/ROW]
[ROW][C]14[/C][C]0.176292[/C][C]1.3541[/C][C]0.090431[/C][/ROW]
[ROW][C]15[/C][C]-0.01751[/C][C]-0.1345[/C][C]0.446735[/C][/ROW]
[ROW][C]16[/C][C]-0.029223[/C][C]-0.2245[/C][C]0.411586[/C][/ROW]
[ROW][C]17[/C][C]-0.033778[/C][C]-0.2595[/C][C]0.398095[/C][/ROW]
[ROW][C]18[/C][C]-0.09332[/C][C]-0.7168[/C][C]0.238161[/C][/ROW]
[ROW][C]19[/C][C]0.089934[/C][C]0.6908[/C][C]0.246201[/C][/ROW]
[ROW][C]20[/C][C]0.063609[/C][C]0.4886[/C][C]0.313471[/C][/ROW]
[ROW][C]21[/C][C]-0.06491[/C][C]-0.4986[/C][C]0.309963[/C][/ROW]
[ROW][C]22[/C][C]-0.118054[/C][C]-0.9068[/C][C]0.184103[/C][/ROW]
[ROW][C]23[/C][C]0.147301[/C][C]1.1314[/C][C]0.131224[/C][/ROW]
[ROW][C]24[/C][C]-0.005515[/C][C]-0.0424[/C][C]0.483178[/C][/ROW]
[ROW][C]25[/C][C]0.063857[/C][C]0.4905[/C][C]0.312803[/C][/ROW]
[ROW][C]26[/C][C]-0.072848[/C][C]-0.5596[/C][C]0.288951[/C][/ROW]
[ROW][C]27[/C][C]-0.091444[/C][C]-0.7024[/C][C]0.242598[/C][/ROW]
[ROW][C]28[/C][C]0.057253[/C][C]0.4398[/C][C]0.330854[/C][/ROW]
[ROW][C]29[/C][C]-0.089663[/C][C]-0.6887[/C][C]0.246851[/C][/ROW]
[ROW][C]30[/C][C]-0.033572[/C][C]-0.2579[/C][C]0.398702[/C][/ROW]
[ROW][C]31[/C][C]-0.051563[/C][C]-0.3961[/C][C]0.346744[/C][/ROW]
[ROW][C]32[/C][C]-0.026601[/C][C]-0.2043[/C][C]0.419402[/C][/ROW]
[ROW][C]33[/C][C]0.06127[/C][C]0.4706[/C][C]0.319823[/C][/ROW]
[ROW][C]34[/C][C]0.151327[/C][C]1.1624[/C][C]0.124884[/C][/ROW]
[ROW][C]35[/C][C]-0.096697[/C][C]-0.7427[/C][C]0.230292[/C][/ROW]
[ROW][C]36[/C][C]0.033117[/C][C]0.2544[/C][C]0.400045[/C][/ROW]
[ROW][C]37[/C][C]0.000873[/C][C]0.0067[/C][C]0.497337[/C][/ROW]
[ROW][C]38[/C][C]-0.058336[/C][C]-0.4481[/C][C]0.327866[/C][/ROW]
[ROW][C]39[/C][C]-0.008884[/C][C]-0.0682[/C][C]0.472914[/C][/ROW]
[ROW][C]40[/C][C]-0.079777[/C][C]-0.6128[/C][C]0.271188[/C][/ROW]
[ROW][C]41[/C][C]0.024625[/C][C]0.1891[/C][C]0.425314[/C][/ROW]
[ROW][C]42[/C][C]-0.038981[/C][C]-0.2994[/C][C]0.382837[/C][/ROW]
[ROW][C]43[/C][C]0.038052[/C][C]0.2923[/C][C]0.385548[/C][/ROW]
[ROW][C]44[/C][C]-0.04234[/C][C]-0.3252[/C][C]0.373083[/C][/ROW]
[ROW][C]45[/C][C]-0.054555[/C][C]-0.419[/C][C]0.338352[/C][/ROW]
[ROW][C]46[/C][C]0.021419[/C][C]0.1645[/C][C]0.434942[/C][/ROW]
[ROW][C]47[/C][C]0.051759[/C][C]0.3976[/C][C]0.346193[/C][/ROW]
[ROW][C]48[/C][C]-0.125157[/C][C]-0.9613[/C][C]0.17015[/C][/ROW]
[/TABLE]
Source: https://freestatistics.org/blog/index.php?pk=32704&T=2

Globally Unique Identifier (entire table): ba.freestatistics.org/blog/index.php?pk=32704&T=2

As an alternative you can also use a QR Code:  

The GUIDs for individual cells are displayed in the table below:

Partial Autocorrelation Function
Time lag kPACF(k)T-STATP-value
1-0.336637-2.58580.006103
2-0.456246-3.50450.00044
3-0.264818-2.03410.023222
4-0.197257-1.51520.067535
5-0.291135-2.23630.014565
60.0473620.36380.358657
7-0.165695-1.27270.104054
80.1066230.8190.208046
90.2891542.2210.0151
10-0.086189-0.6620.255265
11-0.502299-3.85820.000143
120.2934052.25370.013973
13-0.052755-0.40520.343392
140.1762921.35410.090431
15-0.01751-0.13450.446735
16-0.029223-0.22450.411586
17-0.033778-0.25950.398095
18-0.09332-0.71680.238161
190.0899340.69080.246201
200.0636090.48860.313471
21-0.06491-0.49860.309963
22-0.118054-0.90680.184103
230.1473011.13140.131224
24-0.005515-0.04240.483178
250.0638570.49050.312803
26-0.072848-0.55960.288951
27-0.091444-0.70240.242598
280.0572530.43980.330854
29-0.089663-0.68870.246851
30-0.033572-0.25790.398702
31-0.051563-0.39610.346744
32-0.026601-0.20430.419402
330.061270.47060.319823
340.1513271.16240.124884
35-0.096697-0.74270.230292
360.0331170.25440.400045
370.0008730.00670.497337
38-0.058336-0.44810.327866
39-0.008884-0.06820.472914
40-0.079777-0.61280.271188
410.0246250.18910.425314
42-0.038981-0.29940.382837
430.0380520.29230.385548
44-0.04234-0.32520.373083
45-0.054555-0.4190.338352
460.0214190.16450.434942
470.0517590.39760.346193
48-0.125157-0.96130.17015


Parameters (Session):
par1 = 12 ;
Parameters (R input):
par1 = 48 ; par2 = 1 ; par3 = 1 ; par4 = 0 ; par5 = 12 ;
R code (references can be found in the software module):
if (par1 == 'Default') {
par1 = 10*log10(length(x))
} else {
par1 <- as.numeric(par1)
}
par2 <- as.numeric(par2)
par3 <- as.numeric(par3)
par4 <- as.numeric(par4)
par5 <- as.numeric(par5)
if (par2 == 0) {
x <- log(x)
} else {
x <- (x ^ par2 - 1) / par2
}
if (par3 > 0) x <- diff(x,lag=1,difference=par3)
if (par4 > 0) x <- diff(x,lag=par5,difference=par4)
bitmap(file='pic1.png')
racf <- acf(x,par1,main='Autocorrelation',xlab='lags',ylab='ACF')
dev.off()
bitmap(file='pic2.png')
rpacf <- pacf(x,par1,main='Partial Autocorrelation',xlab='lags',ylab='PACF')
dev.off()
(myacf <- c(racf$acf))
(mypacf <- c(rpacf$acf))
lengthx <- length(x)
sqrtn <- sqrt(lengthx)
load(file='createtable')
a<-table.start()
a<-table.row.start(a)
a<-table.element(a,'Autocorrelation Function',4,TRUE)
a<-table.row.end(a)
a<-table.row.start(a)
a<-table.element(a,'Time lag k',header=TRUE)
a<-table.element(a,hyperlink('basics.htm','ACF(k)','click here for more information about the Autocorrelation Function'),header=TRUE)
a<-table.element(a,'T-STAT',header=TRUE)
a<-table.element(a,'P-value',header=TRUE)
a<-table.row.end(a)
for (i in 2:(par1+1)) {
a<-table.row.start(a)
a<-table.element(a,i-1,header=TRUE)
a<-table.element(a,round(myacf[i],6))
mytstat <- myacf[i]*sqrtn
a<-table.element(a,round(mytstat,4))
a<-table.element(a,round(1-pt(abs(mytstat),lengthx),6))
a<-table.row.end(a)
}
a<-table.end(a)
table.save(a,file='mytable.tab')
a<-table.start()
a<-table.row.start(a)
a<-table.element(a,'Partial Autocorrelation Function',4,TRUE)
a<-table.row.end(a)
a<-table.row.start(a)
a<-table.element(a,'Time lag k',header=TRUE)
a<-table.element(a,hyperlink('basics.htm','PACF(k)','click here for more information about the Partial Autocorrelation Function'),header=TRUE)
a<-table.element(a,'T-STAT',header=TRUE)
a<-table.element(a,'P-value',header=TRUE)
a<-table.row.end(a)
for (i in 1:par1) {
a<-table.row.start(a)
a<-table.element(a,i,header=TRUE)
a<-table.element(a,round(mypacf[i],6))
mytstat <- mypacf[i]*sqrtn
a<-table.element(a,round(mytstat,4))
a<-table.element(a,round(1-pt(abs(mytstat),lengthx),6))
a<-table.row.end(a)
}
a<-table.end(a)
table.save(a,file='mytable1.tab')