Free Statistics

of Irreproducible Research!

Author's title

Author*The author of this computation has been verified*
R Software Modulerwasp_autocorrelation.wasp
Title produced by software(Partial) Autocorrelation Function
Date of computationFri, 12 Dec 2008 06:17:27 -0700
Cite this page as followsStatistical Computations at FreeStatistics.org, Office for Research Development and Education, URL https://freestatistics.org/blog/index.php?v=date/2008/Dec/12/t12290879646nthzvnqip2oa15.htm/, Retrieved Sun, 19 May 2024 05:37:06 +0000
Statistical Computations at FreeStatistics.org, Office for Research Development and Education, URL https://freestatistics.org/blog/index.php?pk=32686, Retrieved Sun, 19 May 2024 05:37:06 +0000
QR Codes:

Original text written by user:
IsPrivate?No (this computation is public)
User-defined keywords
Estimated Impact208
Family? (F = Feedback message, R = changed R code, M = changed R Module, P = changed Parameters, D = changed Data)
-     [Univariate Data Series] [Uitvoer.Nederland] [2008-12-03 15:11:10] [988ab43f527fc78aae41c84649095267]
-   P   [Univariate Data Series] [Export From Belgi...] [2008-12-03 15:52:29] [988ab43f527fc78aae41c84649095267]
- RMP     [(Partial) Autocorrelation Function] [Partial Autocorre...] [2008-12-03 16:01:07] [988ab43f527fc78aae41c84649095267]
-    D      [(Partial) Autocorrelation Function] [Partial Autocorre...] [2008-12-11 17:24:10] [988ab43f527fc78aae41c84649095267]
-   PD          [(Partial) Autocorrelation Function] [Partial Autocorre...] [2008-12-12 13:17:27] [5d823194959040fa9b19b8c8302177e6] [Current]
Feedback Forum

Post a new message
Dataseries X:
3258.1
3140.1
3627.4
3279.4
3204
3515.6
3146.6
2271.7
3627.9
3553.4
3018.3
3355.4
3242
3311.1
4125.2
3423
3120.3
3863
3240.8
2837.4
3945
3684.1
3659.6
3769.6
3592.7
3754
4507.8
3853.2
3817.2
3958.4
3428.9
3125.7
3977
3983.3
4299.6
4306.9
4259.5
3986
4755.6
3925.6
4206.5
4323.4
3816.1
3410.7
4227.4
4296.9
4351.7
3800
4277
4100.2
4672.5
4189.9
4231.9
4654.9
4298.5
3635.9
4505.1
4891.9
4894.2
4093.2


Summary of computational transaction
Raw Inputview raw input (R code)
Raw Outputview raw output of R engine
Computing time3 seconds
R Server'Herman Ole Andreas Wold' @ 193.190.124.10:1001

\begin{tabular}{lllllllll}
\hline
Summary of computational transaction \tabularnewline
Raw Input & view raw input (R code)  \tabularnewline
Raw Output & view raw output of R engine  \tabularnewline
Computing time & 3 seconds \tabularnewline
R Server & 'Herman Ole Andreas Wold' @ 193.190.124.10:1001 \tabularnewline
\hline
\end{tabular}
%Source: https://freestatistics.org/blog/index.php?pk=32686&T=0

[TABLE]
[ROW][C]Summary of computational transaction[/C][/ROW]
[ROW][C]Raw Input[/C][C]view raw input (R code) [/C][/ROW]
[ROW][C]Raw Output[/C][C]view raw output of R engine [/C][/ROW]
[ROW][C]Computing time[/C][C]3 seconds[/C][/ROW]
[ROW][C]R Server[/C][C]'Herman Ole Andreas Wold' @ 193.190.124.10:1001[/C][/ROW]
[/TABLE]
Source: https://freestatistics.org/blog/index.php?pk=32686&T=0

Globally Unique Identifier (entire table): ba.freestatistics.org/blog/index.php?pk=32686&T=0

As an alternative you can also use a QR Code:  

The GUIDs for individual cells are displayed in the table below:

Summary of computational transaction
Raw Inputview raw input (R code)
Raw Outputview raw output of R engine
Computing time3 seconds
R Server'Herman Ole Andreas Wold' @ 193.190.124.10:1001


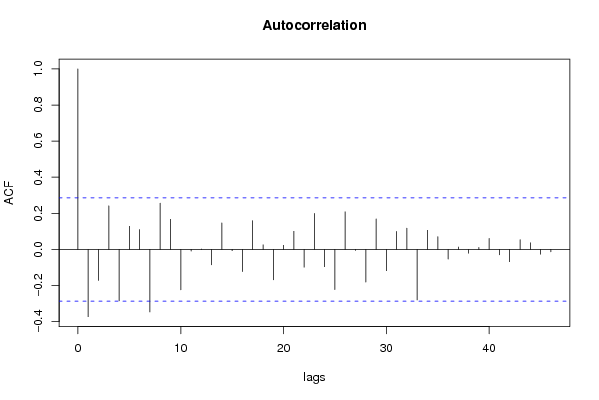
Autocorrelation Function
Time lag kACF(k)T-STATP-value
1-0.372543-2.5540.006975
2-0.17206-1.17960.122051
30.2413091.65430.052362
4-0.284607-1.95120.028506
50.1281340.87840.192086
60.1098530.75310.227569
7-0.346333-2.37430.010858
80.2558651.75410.042964
90.1668021.14350.129303
10-0.224104-1.53640.065576
11-0.009088-0.06230.475291
120.0022480.01540.493884
13-0.085016-0.58280.281393
140.1465291.00460.160128
15-0.00717-0.04920.480503
16-0.122512-0.83990.202609
170.1593061.09210.140168
180.0257290.17640.430374
19-0.168327-1.1540.127169
200.023110.15840.437396
210.1002920.68760.247553
22-0.098349-0.67420.251728
230.1992181.36580.089256
24-0.095732-0.65630.257414
25-0.222213-1.52340.067178
260.2087011.43080.079554
27-0.005822-0.03990.484164
28-0.180913-1.24030.110514
290.1689771.15840.126267
30-0.117527-0.80570.212229
310.0999290.68510.248329
320.1173920.80480.212495
33-0.279742-1.91780.030611
340.1061330.72760.235231
350.0704970.48330.315562
36-0.053773-0.36860.357022
370.0128260.08790.465154
38-0.021-0.1440.44307
390.010750.07370.470781
400.0605350.4150.340012
41-0.0302-0.2070.418437
42-0.068158-0.46730.321233
430.05370.36810.357208
440.0368010.25230.400956
45-0.026318-0.18040.428796
46-0.013128-0.090.464335
47NANANA
48NANANA

\begin{tabular}{lllllllll}
\hline
Autocorrelation Function \tabularnewline
Time lag k & ACF(k) & T-STAT & P-value \tabularnewline
1 & -0.372543 & -2.554 & 0.006975 \tabularnewline
2 & -0.17206 & -1.1796 & 0.122051 \tabularnewline
3 & 0.241309 & 1.6543 & 0.052362 \tabularnewline
4 & -0.284607 & -1.9512 & 0.028506 \tabularnewline
5 & 0.128134 & 0.8784 & 0.192086 \tabularnewline
6 & 0.109853 & 0.7531 & 0.227569 \tabularnewline
7 & -0.346333 & -2.3743 & 0.010858 \tabularnewline
8 & 0.255865 & 1.7541 & 0.042964 \tabularnewline
9 & 0.166802 & 1.1435 & 0.129303 \tabularnewline
10 & -0.224104 & -1.5364 & 0.065576 \tabularnewline
11 & -0.009088 & -0.0623 & 0.475291 \tabularnewline
12 & 0.002248 & 0.0154 & 0.493884 \tabularnewline
13 & -0.085016 & -0.5828 & 0.281393 \tabularnewline
14 & 0.146529 & 1.0046 & 0.160128 \tabularnewline
15 & -0.00717 & -0.0492 & 0.480503 \tabularnewline
16 & -0.122512 & -0.8399 & 0.202609 \tabularnewline
17 & 0.159306 & 1.0921 & 0.140168 \tabularnewline
18 & 0.025729 & 0.1764 & 0.430374 \tabularnewline
19 & -0.168327 & -1.154 & 0.127169 \tabularnewline
20 & 0.02311 & 0.1584 & 0.437396 \tabularnewline
21 & 0.100292 & 0.6876 & 0.247553 \tabularnewline
22 & -0.098349 & -0.6742 & 0.251728 \tabularnewline
23 & 0.199218 & 1.3658 & 0.089256 \tabularnewline
24 & -0.095732 & -0.6563 & 0.257414 \tabularnewline
25 & -0.222213 & -1.5234 & 0.067178 \tabularnewline
26 & 0.208701 & 1.4308 & 0.079554 \tabularnewline
27 & -0.005822 & -0.0399 & 0.484164 \tabularnewline
28 & -0.180913 & -1.2403 & 0.110514 \tabularnewline
29 & 0.168977 & 1.1584 & 0.126267 \tabularnewline
30 & -0.117527 & -0.8057 & 0.212229 \tabularnewline
31 & 0.099929 & 0.6851 & 0.248329 \tabularnewline
32 & 0.117392 & 0.8048 & 0.212495 \tabularnewline
33 & -0.279742 & -1.9178 & 0.030611 \tabularnewline
34 & 0.106133 & 0.7276 & 0.235231 \tabularnewline
35 & 0.070497 & 0.4833 & 0.315562 \tabularnewline
36 & -0.053773 & -0.3686 & 0.357022 \tabularnewline
37 & 0.012826 & 0.0879 & 0.465154 \tabularnewline
38 & -0.021 & -0.144 & 0.44307 \tabularnewline
39 & 0.01075 & 0.0737 & 0.470781 \tabularnewline
40 & 0.060535 & 0.415 & 0.340012 \tabularnewline
41 & -0.0302 & -0.207 & 0.418437 \tabularnewline
42 & -0.068158 & -0.4673 & 0.321233 \tabularnewline
43 & 0.0537 & 0.3681 & 0.357208 \tabularnewline
44 & 0.036801 & 0.2523 & 0.400956 \tabularnewline
45 & -0.026318 & -0.1804 & 0.428796 \tabularnewline
46 & -0.013128 & -0.09 & 0.464335 \tabularnewline
47 & NA & NA & NA \tabularnewline
48 & NA & NA & NA \tabularnewline
\hline
\end{tabular}
%Source: https://freestatistics.org/blog/index.php?pk=32686&T=1

[TABLE]
[ROW][C]Autocorrelation Function[/C][/ROW]
[ROW][C]Time lag k[/C][C]ACF(k)[/C][C]T-STAT[/C][C]P-value[/C][/ROW]
[ROW][C]1[/C][C]-0.372543[/C][C]-2.554[/C][C]0.006975[/C][/ROW]
[ROW][C]2[/C][C]-0.17206[/C][C]-1.1796[/C][C]0.122051[/C][/ROW]
[ROW][C]3[/C][C]0.241309[/C][C]1.6543[/C][C]0.052362[/C][/ROW]
[ROW][C]4[/C][C]-0.284607[/C][C]-1.9512[/C][C]0.028506[/C][/ROW]
[ROW][C]5[/C][C]0.128134[/C][C]0.8784[/C][C]0.192086[/C][/ROW]
[ROW][C]6[/C][C]0.109853[/C][C]0.7531[/C][C]0.227569[/C][/ROW]
[ROW][C]7[/C][C]-0.346333[/C][C]-2.3743[/C][C]0.010858[/C][/ROW]
[ROW][C]8[/C][C]0.255865[/C][C]1.7541[/C][C]0.042964[/C][/ROW]
[ROW][C]9[/C][C]0.166802[/C][C]1.1435[/C][C]0.129303[/C][/ROW]
[ROW][C]10[/C][C]-0.224104[/C][C]-1.5364[/C][C]0.065576[/C][/ROW]
[ROW][C]11[/C][C]-0.009088[/C][C]-0.0623[/C][C]0.475291[/C][/ROW]
[ROW][C]12[/C][C]0.002248[/C][C]0.0154[/C][C]0.493884[/C][/ROW]
[ROW][C]13[/C][C]-0.085016[/C][C]-0.5828[/C][C]0.281393[/C][/ROW]
[ROW][C]14[/C][C]0.146529[/C][C]1.0046[/C][C]0.160128[/C][/ROW]
[ROW][C]15[/C][C]-0.00717[/C][C]-0.0492[/C][C]0.480503[/C][/ROW]
[ROW][C]16[/C][C]-0.122512[/C][C]-0.8399[/C][C]0.202609[/C][/ROW]
[ROW][C]17[/C][C]0.159306[/C][C]1.0921[/C][C]0.140168[/C][/ROW]
[ROW][C]18[/C][C]0.025729[/C][C]0.1764[/C][C]0.430374[/C][/ROW]
[ROW][C]19[/C][C]-0.168327[/C][C]-1.154[/C][C]0.127169[/C][/ROW]
[ROW][C]20[/C][C]0.02311[/C][C]0.1584[/C][C]0.437396[/C][/ROW]
[ROW][C]21[/C][C]0.100292[/C][C]0.6876[/C][C]0.247553[/C][/ROW]
[ROW][C]22[/C][C]-0.098349[/C][C]-0.6742[/C][C]0.251728[/C][/ROW]
[ROW][C]23[/C][C]0.199218[/C][C]1.3658[/C][C]0.089256[/C][/ROW]
[ROW][C]24[/C][C]-0.095732[/C][C]-0.6563[/C][C]0.257414[/C][/ROW]
[ROW][C]25[/C][C]-0.222213[/C][C]-1.5234[/C][C]0.067178[/C][/ROW]
[ROW][C]26[/C][C]0.208701[/C][C]1.4308[/C][C]0.079554[/C][/ROW]
[ROW][C]27[/C][C]-0.005822[/C][C]-0.0399[/C][C]0.484164[/C][/ROW]
[ROW][C]28[/C][C]-0.180913[/C][C]-1.2403[/C][C]0.110514[/C][/ROW]
[ROW][C]29[/C][C]0.168977[/C][C]1.1584[/C][C]0.126267[/C][/ROW]
[ROW][C]30[/C][C]-0.117527[/C][C]-0.8057[/C][C]0.212229[/C][/ROW]
[ROW][C]31[/C][C]0.099929[/C][C]0.6851[/C][C]0.248329[/C][/ROW]
[ROW][C]32[/C][C]0.117392[/C][C]0.8048[/C][C]0.212495[/C][/ROW]
[ROW][C]33[/C][C]-0.279742[/C][C]-1.9178[/C][C]0.030611[/C][/ROW]
[ROW][C]34[/C][C]0.106133[/C][C]0.7276[/C][C]0.235231[/C][/ROW]
[ROW][C]35[/C][C]0.070497[/C][C]0.4833[/C][C]0.315562[/C][/ROW]
[ROW][C]36[/C][C]-0.053773[/C][C]-0.3686[/C][C]0.357022[/C][/ROW]
[ROW][C]37[/C][C]0.012826[/C][C]0.0879[/C][C]0.465154[/C][/ROW]
[ROW][C]38[/C][C]-0.021[/C][C]-0.144[/C][C]0.44307[/C][/ROW]
[ROW][C]39[/C][C]0.01075[/C][C]0.0737[/C][C]0.470781[/C][/ROW]
[ROW][C]40[/C][C]0.060535[/C][C]0.415[/C][C]0.340012[/C][/ROW]
[ROW][C]41[/C][C]-0.0302[/C][C]-0.207[/C][C]0.418437[/C][/ROW]
[ROW][C]42[/C][C]-0.068158[/C][C]-0.4673[/C][C]0.321233[/C][/ROW]
[ROW][C]43[/C][C]0.0537[/C][C]0.3681[/C][C]0.357208[/C][/ROW]
[ROW][C]44[/C][C]0.036801[/C][C]0.2523[/C][C]0.400956[/C][/ROW]
[ROW][C]45[/C][C]-0.026318[/C][C]-0.1804[/C][C]0.428796[/C][/ROW]
[ROW][C]46[/C][C]-0.013128[/C][C]-0.09[/C][C]0.464335[/C][/ROW]
[ROW][C]47[/C][C]NA[/C][C]NA[/C][C]NA[/C][/ROW]
[ROW][C]48[/C][C]NA[/C][C]NA[/C][C]NA[/C][/ROW]
[/TABLE]
Source: https://freestatistics.org/blog/index.php?pk=32686&T=1

Globally Unique Identifier (entire table): ba.freestatistics.org/blog/index.php?pk=32686&T=1

As an alternative you can also use a QR Code:  

The GUIDs for individual cells are displayed in the table below:

Autocorrelation Function
Time lag kACF(k)T-STATP-value
1-0.372543-2.5540.006975
2-0.17206-1.17960.122051
30.2413091.65430.052362
4-0.284607-1.95120.028506
50.1281340.87840.192086
60.1098530.75310.227569
7-0.346333-2.37430.010858
80.2558651.75410.042964
90.1668021.14350.129303
10-0.224104-1.53640.065576
11-0.009088-0.06230.475291
120.0022480.01540.493884
13-0.085016-0.58280.281393
140.1465291.00460.160128
15-0.00717-0.04920.480503
16-0.122512-0.83990.202609
170.1593061.09210.140168
180.0257290.17640.430374
19-0.168327-1.1540.127169
200.023110.15840.437396
210.1002920.68760.247553
22-0.098349-0.67420.251728
230.1992181.36580.089256
24-0.095732-0.65630.257414
25-0.222213-1.52340.067178
260.2087011.43080.079554
27-0.005822-0.03990.484164
28-0.180913-1.24030.110514
290.1689771.15840.126267
30-0.117527-0.80570.212229
310.0999290.68510.248329
320.1173920.80480.212495
33-0.279742-1.91780.030611
340.1061330.72760.235231
350.0704970.48330.315562
36-0.053773-0.36860.357022
370.0128260.08790.465154
38-0.021-0.1440.44307
390.010750.07370.470781
400.0605350.4150.340012
41-0.0302-0.2070.418437
42-0.068158-0.46730.321233
430.05370.36810.357208
440.0368010.25230.400956
45-0.026318-0.18040.428796
46-0.013128-0.090.464335
47NANANA
48NANANA


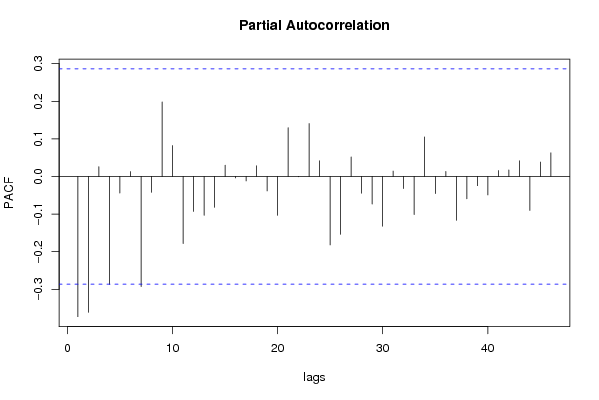
Partial Autocorrelation Function
Time lag kPACF(k)T-STATP-value
1-0.372543-2.5540.006975
2-0.360943-2.47450.008504
30.0261770.17950.429175
4-0.286719-1.96560.027632
5-0.044028-0.30180.382054
60.0129770.0890.464745
7-0.292632-2.00620.025305
8-0.041948-0.28760.387466
90.198141.35840.090414
100.0822560.56390.287746
11-0.178231-1.22190.113921
12-0.092957-0.63730.263518
13-0.103137-0.70710.241506
14-0.081883-0.56140.288609
150.0299960.20560.418979
16-0.003727-0.02560.489862
17-0.01188-0.08140.467717
180.0283160.19410.423457
19-0.038395-0.26320.396764
20-0.103068-0.70660.241652
210.1296920.88910.189233
22-0.000714-0.00490.498056
230.1408510.96560.169587
240.041630.28540.388294
25-0.181856-1.24670.109335
26-0.153529-1.05250.148966
270.0518880.35570.361818
28-0.04426-0.30340.38145
29-0.073112-0.50120.309275
30-0.131965-0.90470.185117
310.0144240.09890.460826
32-0.032203-0.22080.413112
33-0.101316-0.69460.245367
340.105010.71990.237572
35-0.04548-0.31180.378289
360.0133380.09140.463765
37-0.1164-0.7980.214442
38-0.059159-0.40560.343448
39-0.024589-0.16860.433428
40-0.049099-0.33660.368956
410.0158880.10890.456864
420.0174820.11980.452557
430.0418210.28670.387797
44-0.090332-0.61930.26936
450.0382510.26220.397142
460.0628680.4310.33422
47NANANA
48NANANA

\begin{tabular}{lllllllll}
\hline
Partial Autocorrelation Function \tabularnewline
Time lag k & PACF(k) & T-STAT & P-value \tabularnewline
1 & -0.372543 & -2.554 & 0.006975 \tabularnewline
2 & -0.360943 & -2.4745 & 0.008504 \tabularnewline
3 & 0.026177 & 0.1795 & 0.429175 \tabularnewline
4 & -0.286719 & -1.9656 & 0.027632 \tabularnewline
5 & -0.044028 & -0.3018 & 0.382054 \tabularnewline
6 & 0.012977 & 0.089 & 0.464745 \tabularnewline
7 & -0.292632 & -2.0062 & 0.025305 \tabularnewline
8 & -0.041948 & -0.2876 & 0.387466 \tabularnewline
9 & 0.19814 & 1.3584 & 0.090414 \tabularnewline
10 & 0.082256 & 0.5639 & 0.287746 \tabularnewline
11 & -0.178231 & -1.2219 & 0.113921 \tabularnewline
12 & -0.092957 & -0.6373 & 0.263518 \tabularnewline
13 & -0.103137 & -0.7071 & 0.241506 \tabularnewline
14 & -0.081883 & -0.5614 & 0.288609 \tabularnewline
15 & 0.029996 & 0.2056 & 0.418979 \tabularnewline
16 & -0.003727 & -0.0256 & 0.489862 \tabularnewline
17 & -0.01188 & -0.0814 & 0.467717 \tabularnewline
18 & 0.028316 & 0.1941 & 0.423457 \tabularnewline
19 & -0.038395 & -0.2632 & 0.396764 \tabularnewline
20 & -0.103068 & -0.7066 & 0.241652 \tabularnewline
21 & 0.129692 & 0.8891 & 0.189233 \tabularnewline
22 & -0.000714 & -0.0049 & 0.498056 \tabularnewline
23 & 0.140851 & 0.9656 & 0.169587 \tabularnewline
24 & 0.04163 & 0.2854 & 0.388294 \tabularnewline
25 & -0.181856 & -1.2467 & 0.109335 \tabularnewline
26 & -0.153529 & -1.0525 & 0.148966 \tabularnewline
27 & 0.051888 & 0.3557 & 0.361818 \tabularnewline
28 & -0.04426 & -0.3034 & 0.38145 \tabularnewline
29 & -0.073112 & -0.5012 & 0.309275 \tabularnewline
30 & -0.131965 & -0.9047 & 0.185117 \tabularnewline
31 & 0.014424 & 0.0989 & 0.460826 \tabularnewline
32 & -0.032203 & -0.2208 & 0.413112 \tabularnewline
33 & -0.101316 & -0.6946 & 0.245367 \tabularnewline
34 & 0.10501 & 0.7199 & 0.237572 \tabularnewline
35 & -0.04548 & -0.3118 & 0.378289 \tabularnewline
36 & 0.013338 & 0.0914 & 0.463765 \tabularnewline
37 & -0.1164 & -0.798 & 0.214442 \tabularnewline
38 & -0.059159 & -0.4056 & 0.343448 \tabularnewline
39 & -0.024589 & -0.1686 & 0.433428 \tabularnewline
40 & -0.049099 & -0.3366 & 0.368956 \tabularnewline
41 & 0.015888 & 0.1089 & 0.456864 \tabularnewline
42 & 0.017482 & 0.1198 & 0.452557 \tabularnewline
43 & 0.041821 & 0.2867 & 0.387797 \tabularnewline
44 & -0.090332 & -0.6193 & 0.26936 \tabularnewline
45 & 0.038251 & 0.2622 & 0.397142 \tabularnewline
46 & 0.062868 & 0.431 & 0.33422 \tabularnewline
47 & NA & NA & NA \tabularnewline
48 & NA & NA & NA \tabularnewline
\hline
\end{tabular}
%Source: https://freestatistics.org/blog/index.php?pk=32686&T=2

[TABLE]
[ROW][C]Partial Autocorrelation Function[/C][/ROW]
[ROW][C]Time lag k[/C][C]PACF(k)[/C][C]T-STAT[/C][C]P-value[/C][/ROW]
[ROW][C]1[/C][C]-0.372543[/C][C]-2.554[/C][C]0.006975[/C][/ROW]
[ROW][C]2[/C][C]-0.360943[/C][C]-2.4745[/C][C]0.008504[/C][/ROW]
[ROW][C]3[/C][C]0.026177[/C][C]0.1795[/C][C]0.429175[/C][/ROW]
[ROW][C]4[/C][C]-0.286719[/C][C]-1.9656[/C][C]0.027632[/C][/ROW]
[ROW][C]5[/C][C]-0.044028[/C][C]-0.3018[/C][C]0.382054[/C][/ROW]
[ROW][C]6[/C][C]0.012977[/C][C]0.089[/C][C]0.464745[/C][/ROW]
[ROW][C]7[/C][C]-0.292632[/C][C]-2.0062[/C][C]0.025305[/C][/ROW]
[ROW][C]8[/C][C]-0.041948[/C][C]-0.2876[/C][C]0.387466[/C][/ROW]
[ROW][C]9[/C][C]0.19814[/C][C]1.3584[/C][C]0.090414[/C][/ROW]
[ROW][C]10[/C][C]0.082256[/C][C]0.5639[/C][C]0.287746[/C][/ROW]
[ROW][C]11[/C][C]-0.178231[/C][C]-1.2219[/C][C]0.113921[/C][/ROW]
[ROW][C]12[/C][C]-0.092957[/C][C]-0.6373[/C][C]0.263518[/C][/ROW]
[ROW][C]13[/C][C]-0.103137[/C][C]-0.7071[/C][C]0.241506[/C][/ROW]
[ROW][C]14[/C][C]-0.081883[/C][C]-0.5614[/C][C]0.288609[/C][/ROW]
[ROW][C]15[/C][C]0.029996[/C][C]0.2056[/C][C]0.418979[/C][/ROW]
[ROW][C]16[/C][C]-0.003727[/C][C]-0.0256[/C][C]0.489862[/C][/ROW]
[ROW][C]17[/C][C]-0.01188[/C][C]-0.0814[/C][C]0.467717[/C][/ROW]
[ROW][C]18[/C][C]0.028316[/C][C]0.1941[/C][C]0.423457[/C][/ROW]
[ROW][C]19[/C][C]-0.038395[/C][C]-0.2632[/C][C]0.396764[/C][/ROW]
[ROW][C]20[/C][C]-0.103068[/C][C]-0.7066[/C][C]0.241652[/C][/ROW]
[ROW][C]21[/C][C]0.129692[/C][C]0.8891[/C][C]0.189233[/C][/ROW]
[ROW][C]22[/C][C]-0.000714[/C][C]-0.0049[/C][C]0.498056[/C][/ROW]
[ROW][C]23[/C][C]0.140851[/C][C]0.9656[/C][C]0.169587[/C][/ROW]
[ROW][C]24[/C][C]0.04163[/C][C]0.2854[/C][C]0.388294[/C][/ROW]
[ROW][C]25[/C][C]-0.181856[/C][C]-1.2467[/C][C]0.109335[/C][/ROW]
[ROW][C]26[/C][C]-0.153529[/C][C]-1.0525[/C][C]0.148966[/C][/ROW]
[ROW][C]27[/C][C]0.051888[/C][C]0.3557[/C][C]0.361818[/C][/ROW]
[ROW][C]28[/C][C]-0.04426[/C][C]-0.3034[/C][C]0.38145[/C][/ROW]
[ROW][C]29[/C][C]-0.073112[/C][C]-0.5012[/C][C]0.309275[/C][/ROW]
[ROW][C]30[/C][C]-0.131965[/C][C]-0.9047[/C][C]0.185117[/C][/ROW]
[ROW][C]31[/C][C]0.014424[/C][C]0.0989[/C][C]0.460826[/C][/ROW]
[ROW][C]32[/C][C]-0.032203[/C][C]-0.2208[/C][C]0.413112[/C][/ROW]
[ROW][C]33[/C][C]-0.101316[/C][C]-0.6946[/C][C]0.245367[/C][/ROW]
[ROW][C]34[/C][C]0.10501[/C][C]0.7199[/C][C]0.237572[/C][/ROW]
[ROW][C]35[/C][C]-0.04548[/C][C]-0.3118[/C][C]0.378289[/C][/ROW]
[ROW][C]36[/C][C]0.013338[/C][C]0.0914[/C][C]0.463765[/C][/ROW]
[ROW][C]37[/C][C]-0.1164[/C][C]-0.798[/C][C]0.214442[/C][/ROW]
[ROW][C]38[/C][C]-0.059159[/C][C]-0.4056[/C][C]0.343448[/C][/ROW]
[ROW][C]39[/C][C]-0.024589[/C][C]-0.1686[/C][C]0.433428[/C][/ROW]
[ROW][C]40[/C][C]-0.049099[/C][C]-0.3366[/C][C]0.368956[/C][/ROW]
[ROW][C]41[/C][C]0.015888[/C][C]0.1089[/C][C]0.456864[/C][/ROW]
[ROW][C]42[/C][C]0.017482[/C][C]0.1198[/C][C]0.452557[/C][/ROW]
[ROW][C]43[/C][C]0.041821[/C][C]0.2867[/C][C]0.387797[/C][/ROW]
[ROW][C]44[/C][C]-0.090332[/C][C]-0.6193[/C][C]0.26936[/C][/ROW]
[ROW][C]45[/C][C]0.038251[/C][C]0.2622[/C][C]0.397142[/C][/ROW]
[ROW][C]46[/C][C]0.062868[/C][C]0.431[/C][C]0.33422[/C][/ROW]
[ROW][C]47[/C][C]NA[/C][C]NA[/C][C]NA[/C][/ROW]
[ROW][C]48[/C][C]NA[/C][C]NA[/C][C]NA[/C][/ROW]
[/TABLE]
Source: https://freestatistics.org/blog/index.php?pk=32686&T=2

Globally Unique Identifier (entire table): ba.freestatistics.org/blog/index.php?pk=32686&T=2

As an alternative you can also use a QR Code:  

The GUIDs for individual cells are displayed in the table below:

Partial Autocorrelation Function
Time lag kPACF(k)T-STATP-value
1-0.372543-2.5540.006975
2-0.360943-2.47450.008504
30.0261770.17950.429175
4-0.286719-1.96560.027632
5-0.044028-0.30180.382054
60.0129770.0890.464745
7-0.292632-2.00620.025305
8-0.041948-0.28760.387466
90.198141.35840.090414
100.0822560.56390.287746
11-0.178231-1.22190.113921
12-0.092957-0.63730.263518
13-0.103137-0.70710.241506
14-0.081883-0.56140.288609
150.0299960.20560.418979
16-0.003727-0.02560.489862
17-0.01188-0.08140.467717
180.0283160.19410.423457
19-0.038395-0.26320.396764
20-0.103068-0.70660.241652
210.1296920.88910.189233
22-0.000714-0.00490.498056
230.1408510.96560.169587
240.041630.28540.388294
25-0.181856-1.24670.109335
26-0.153529-1.05250.148966
270.0518880.35570.361818
28-0.04426-0.30340.38145
29-0.073112-0.50120.309275
30-0.131965-0.90470.185117
310.0144240.09890.460826
32-0.032203-0.22080.413112
33-0.101316-0.69460.245367
340.105010.71990.237572
35-0.04548-0.31180.378289
360.0133380.09140.463765
37-0.1164-0.7980.214442
38-0.059159-0.40560.343448
39-0.024589-0.16860.433428
40-0.049099-0.33660.368956
410.0158880.10890.456864
420.0174820.11980.452557
430.0418210.28670.387797
44-0.090332-0.61930.26936
450.0382510.26220.397142
460.0628680.4310.33422
47NANANA
48NANANA


Parameters (Session):
par1 = 12 ;
Parameters (R input):
par1 = 48 ; par2 = 1 ; par3 = 1 ; par4 = 1 ; par5 = 12 ;
R code (references can be found in the software module):
if (par1 == 'Default') {
par1 = 10*log10(length(x))
} else {
par1 <- as.numeric(par1)
}
par2 <- as.numeric(par2)
par3 <- as.numeric(par3)
par4 <- as.numeric(par4)
par5 <- as.numeric(par5)
if (par2 == 0) {
x <- log(x)
} else {
x <- (x ^ par2 - 1) / par2
}
if (par3 > 0) x <- diff(x,lag=1,difference=par3)
if (par4 > 0) x <- diff(x,lag=par5,difference=par4)
bitmap(file='pic1.png')
racf <- acf(x,par1,main='Autocorrelation',xlab='lags',ylab='ACF')
dev.off()
bitmap(file='pic2.png')
rpacf <- pacf(x,par1,main='Partial Autocorrelation',xlab='lags',ylab='PACF')
dev.off()
(myacf <- c(racf$acf))
(mypacf <- c(rpacf$acf))
lengthx <- length(x)
sqrtn <- sqrt(lengthx)
load(file='createtable')
a<-table.start()
a<-table.row.start(a)
a<-table.element(a,'Autocorrelation Function',4,TRUE)
a<-table.row.end(a)
a<-table.row.start(a)
a<-table.element(a,'Time lag k',header=TRUE)
a<-table.element(a,hyperlink('basics.htm','ACF(k)','click here for more information about the Autocorrelation Function'),header=TRUE)
a<-table.element(a,'T-STAT',header=TRUE)
a<-table.element(a,'P-value',header=TRUE)
a<-table.row.end(a)
for (i in 2:(par1+1)) {
a<-table.row.start(a)
a<-table.element(a,i-1,header=TRUE)
a<-table.element(a,round(myacf[i],6))
mytstat <- myacf[i]*sqrtn
a<-table.element(a,round(mytstat,4))
a<-table.element(a,round(1-pt(abs(mytstat),lengthx),6))
a<-table.row.end(a)
}
a<-table.end(a)
table.save(a,file='mytable.tab')
a<-table.start()
a<-table.row.start(a)
a<-table.element(a,'Partial Autocorrelation Function',4,TRUE)
a<-table.row.end(a)
a<-table.row.start(a)
a<-table.element(a,'Time lag k',header=TRUE)
a<-table.element(a,hyperlink('basics.htm','PACF(k)','click here for more information about the Partial Autocorrelation Function'),header=TRUE)
a<-table.element(a,'T-STAT',header=TRUE)
a<-table.element(a,'P-value',header=TRUE)
a<-table.row.end(a)
for (i in 1:par1) {
a<-table.row.start(a)
a<-table.element(a,i,header=TRUE)
a<-table.element(a,round(mypacf[i],6))
mytstat <- mypacf[i]*sqrtn
a<-table.element(a,round(mytstat,4))
a<-table.element(a,round(1-pt(abs(mytstat),lengthx),6))
a<-table.row.end(a)
}
a<-table.end(a)
table.save(a,file='mytable1.tab')