Free Statistics

of Irreproducible Research!

Author's title

H2: cross correlation function - France & The Netherlands (d=0 D=1 // d=0 D...

Author*The author of this computation has been verified*
R Software Modulerwasp_cross.wasp
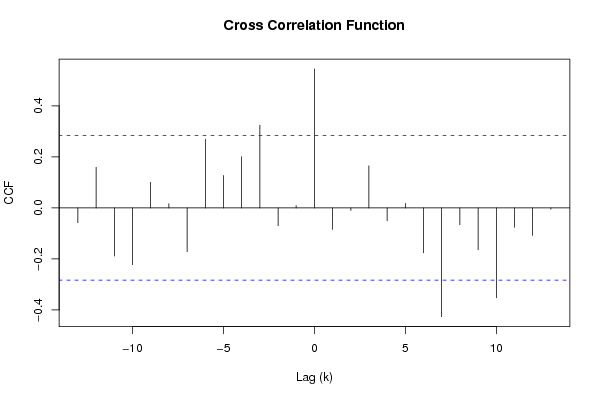
Title produced by softwareCross Correlation Function
Date of computationFri, 12 Dec 2008 04:05:08 -0700
Cite this page as followsStatistical Computations at FreeStatistics.org, Office for Research Development and Education, URL https://freestatistics.org/blog/index.php?v=date/2008/Dec/12/t1229080930deshppwjncb5in1.htm/, Retrieved Sun, 19 May 2024 05:11:47 +0000
Statistical Computations at FreeStatistics.org, Office for Research Development and Education, URL https://freestatistics.org/blog/index.php?pk=32560, Retrieved Sun, 19 May 2024 05:11:47 +0000
QR Codes:

Original text written by user:
IsPrivate?No (this computation is public)
User-defined keywords
Estimated Impact193
Family? (F = Feedback message, R = changed R code, M = changed R Module, P = changed Parameters, D = changed Data)
-     [Cross Correlation Function] [H2: cross correla...] [2008-12-04 17:29:14] [1e1d8320a8a1170c475bf6e4ce119de6]
-   P     [Cross Correlation Function] [H2: cross correla...] [2008-12-12 11:05:08] [fdd69703d301fae09456f660b2f52997] [Current]
- RMPD      [(Partial) Autocorrelation Function] [H2: PACF France] [2008-12-13 18:19:29] [1e1d8320a8a1170c475bf6e4ce119de6]
Feedback Forum

Post a new message
Dataseries X:
3258.1
3140.1
3627.4
3279.4
3204
3515.6
3146.6
2271.7
3627.9
3553.4
3018.3
3355.4
3242
3311.1
4125.2
3423
3120.3
3863
3240.8
2837.4
3945
3684.1
3659.6
3769.6
3592.7
3754
4507.8
3853.2
3817.2
3958.4
3428.9
3125.7
3977
3983.3
4299.6
4306.9
4259.5
3986
4755.6
3925.6
4206.5
4323.4
3816.1
3410.7
4227.4
4296.9
4351.7
3800
4277
4100.2
4672.5
4189.9
4231.9
4654.9
4298.5
3635.9
4505.1
4891.9
4894.2
4093.2
Dataseries Y:
2236
2084.9
2409.5
2199.3
2203.5
2254.1
1975.8
1742.2
2520.6
2438.1
2126.3
2267.5
2201.1
2128.5
2596
2458.2
2210.5
2621.2
2231.4
2103.6
2685.8
2539.3
2462.4
2693.3
2307.7
2385.9
2737.6
2653.9
2545.4
2848.8
2359.5
2488.3
2861.1
2717.9
2844
2749
2652.9
2660.2
3187.1
2774.1
3158.2
3244.6
2665.5
2820.8
2983.4
3077.4
3024.8
2731.8
3046.2
2834.8
3292.8
2946.1
3196.9
3284.2
3003
2979
3137.4
3630.2
3270.7
2942.3


Summary of computational transaction
Raw Inputview raw input (R code)
Raw Outputview raw output of R engine
Computing time1 seconds
R Server'Gwilym Jenkins' @ 72.249.127.135

\begin{tabular}{lllllllll}
\hline
Summary of computational transaction \tabularnewline
Raw Input & view raw input (R code)  \tabularnewline
Raw Output & view raw output of R engine  \tabularnewline
Computing time & 1 seconds \tabularnewline
R Server & 'Gwilym Jenkins' @ 72.249.127.135 \tabularnewline
\hline
\end{tabular}
%Source: https://freestatistics.org/blog/index.php?pk=32560&T=0

[TABLE]
[ROW][C]Summary of computational transaction[/C][/ROW]
[ROW][C]Raw Input[/C][C]view raw input (R code) [/C][/ROW]
[ROW][C]Raw Output[/C][C]view raw output of R engine [/C][/ROW]
[ROW][C]Computing time[/C][C]1 seconds[/C][/ROW]
[ROW][C]R Server[/C][C]'Gwilym Jenkins' @ 72.249.127.135[/C][/ROW]
[/TABLE]
Source: https://freestatistics.org/blog/index.php?pk=32560&T=0

Globally Unique Identifier (entire table): ba.freestatistics.org/blog/index.php?pk=32560&T=0

As an alternative you can also use a QR Code:  

The GUIDs for individual cells are displayed in the table below:

Summary of computational transaction
Raw Inputview raw input (R code)
Raw Outputview raw output of R engine
Computing time1 seconds
R Server'Gwilym Jenkins' @ 72.249.127.135


Cross Correlation Function
ParameterValue
Box-Cox transformation parameter (lambda) of X series1
Degree of non-seasonal differencing (d) of X series0
Degree of seasonal differencing (D) of X series1
Seasonal Period (s)12
Box-Cox transformation parameter (lambda) of Y series1
Degree of non-seasonal differencing (d) of Y series0
Degree of seasonal differencing (D) of Y series1
krho(Y[t],X[t+k])
-13-0.0580980336004133
-120.158980345519078
-11-0.188562303702112
-10-0.222730630669005
-90.100337608913473
-80.0166327618667554
-7-0.171597543316492
-60.269428163691561
-50.127267906034811
-40.200903500174508
-30.324178486977437
-2-0.0697726315973241
-10.00918274989249554
00.544428300706769
1-0.0845859976367944
2-0.0100944226177530
30.165069377972691
4-0.0508118983640809
50.0172784364101373
6-0.175981642501063
7-0.426093437550577
8-0.0664818654219484
9-0.164063413416647
10-0.352480164798691
11-0.0761729183961277
12-0.108053412158608
13-0.00511698377747107

\begin{tabular}{lllllllll}
\hline
Cross Correlation Function \tabularnewline
Parameter & Value \tabularnewline
Box-Cox transformation parameter (lambda) of X series & 1 \tabularnewline
Degree of non-seasonal differencing (d) of X series & 0 \tabularnewline
Degree of seasonal differencing (D) of X series & 1 \tabularnewline
Seasonal Period (s) & 12 \tabularnewline
Box-Cox transformation parameter (lambda) of Y series & 1 \tabularnewline
Degree of non-seasonal differencing (d) of Y series & 0 \tabularnewline
Degree of seasonal differencing (D) of Y series & 1 \tabularnewline
k & rho(Y[t],X[t+k]) \tabularnewline
-13 & -0.0580980336004133 \tabularnewline
-12 & 0.158980345519078 \tabularnewline
-11 & -0.188562303702112 \tabularnewline
-10 & -0.222730630669005 \tabularnewline
-9 & 0.100337608913473 \tabularnewline
-8 & 0.0166327618667554 \tabularnewline
-7 & -0.171597543316492 \tabularnewline
-6 & 0.269428163691561 \tabularnewline
-5 & 0.127267906034811 \tabularnewline
-4 & 0.200903500174508 \tabularnewline
-3 & 0.324178486977437 \tabularnewline
-2 & -0.0697726315973241 \tabularnewline
-1 & 0.00918274989249554 \tabularnewline
0 & 0.544428300706769 \tabularnewline
1 & -0.0845859976367944 \tabularnewline
2 & -0.0100944226177530 \tabularnewline
3 & 0.165069377972691 \tabularnewline
4 & -0.0508118983640809 \tabularnewline
5 & 0.0172784364101373 \tabularnewline
6 & -0.175981642501063 \tabularnewline
7 & -0.426093437550577 \tabularnewline
8 & -0.0664818654219484 \tabularnewline
9 & -0.164063413416647 \tabularnewline
10 & -0.352480164798691 \tabularnewline
11 & -0.0761729183961277 \tabularnewline
12 & -0.108053412158608 \tabularnewline
13 & -0.00511698377747107 \tabularnewline
\hline
\end{tabular}
%Source: https://freestatistics.org/blog/index.php?pk=32560&T=1

[TABLE]
[ROW][C]Cross Correlation Function[/C][/ROW]
[ROW][C]Parameter[/C][C]Value[/C][/ROW]
[ROW][C]Box-Cox transformation parameter (lambda) of X series[/C][C]1[/C][/ROW]
[ROW][C]Degree of non-seasonal differencing (d) of X series[/C][C]0[/C][/ROW]
[ROW][C]Degree of seasonal differencing (D) of X series[/C][C]1[/C][/ROW]
[ROW][C]Seasonal Period (s)[/C][C]12[/C][/ROW]
[ROW][C]Box-Cox transformation parameter (lambda) of Y series[/C][C]1[/C][/ROW]
[ROW][C]Degree of non-seasonal differencing (d) of Y series[/C][C]0[/C][/ROW]
[ROW][C]Degree of seasonal differencing (D) of Y series[/C][C]1[/C][/ROW]
[ROW][C]k[/C][C]rho(Y[t],X[t+k])[/C][/ROW]
[ROW][C]-13[/C][C]-0.0580980336004133[/C][/ROW]
[ROW][C]-12[/C][C]0.158980345519078[/C][/ROW]
[ROW][C]-11[/C][C]-0.188562303702112[/C][/ROW]
[ROW][C]-10[/C][C]-0.222730630669005[/C][/ROW]
[ROW][C]-9[/C][C]0.100337608913473[/C][/ROW]
[ROW][C]-8[/C][C]0.0166327618667554[/C][/ROW]
[ROW][C]-7[/C][C]-0.171597543316492[/C][/ROW]
[ROW][C]-6[/C][C]0.269428163691561[/C][/ROW]
[ROW][C]-5[/C][C]0.127267906034811[/C][/ROW]
[ROW][C]-4[/C][C]0.200903500174508[/C][/ROW]
[ROW][C]-3[/C][C]0.324178486977437[/C][/ROW]
[ROW][C]-2[/C][C]-0.0697726315973241[/C][/ROW]
[ROW][C]-1[/C][C]0.00918274989249554[/C][/ROW]
[ROW][C]0[/C][C]0.544428300706769[/C][/ROW]
[ROW][C]1[/C][C]-0.0845859976367944[/C][/ROW]
[ROW][C]2[/C][C]-0.0100944226177530[/C][/ROW]
[ROW][C]3[/C][C]0.165069377972691[/C][/ROW]
[ROW][C]4[/C][C]-0.0508118983640809[/C][/ROW]
[ROW][C]5[/C][C]0.0172784364101373[/C][/ROW]
[ROW][C]6[/C][C]-0.175981642501063[/C][/ROW]
[ROW][C]7[/C][C]-0.426093437550577[/C][/ROW]
[ROW][C]8[/C][C]-0.0664818654219484[/C][/ROW]
[ROW][C]9[/C][C]-0.164063413416647[/C][/ROW]
[ROW][C]10[/C][C]-0.352480164798691[/C][/ROW]
[ROW][C]11[/C][C]-0.0761729183961277[/C][/ROW]
[ROW][C]12[/C][C]-0.108053412158608[/C][/ROW]
[ROW][C]13[/C][C]-0.00511698377747107[/C][/ROW]
[/TABLE]
Source: https://freestatistics.org/blog/index.php?pk=32560&T=1

Globally Unique Identifier (entire table): ba.freestatistics.org/blog/index.php?pk=32560&T=1

As an alternative you can also use a QR Code:  

The GUIDs for individual cells are displayed in the table below:

Cross Correlation Function
ParameterValue
Box-Cox transformation parameter (lambda) of X series1
Degree of non-seasonal differencing (d) of X series0
Degree of seasonal differencing (D) of X series1
Seasonal Period (s)12
Box-Cox transformation parameter (lambda) of Y series1
Degree of non-seasonal differencing (d) of Y series0
Degree of seasonal differencing (D) of Y series1
krho(Y[t],X[t+k])
-13-0.0580980336004133
-120.158980345519078
-11-0.188562303702112
-10-0.222730630669005
-90.100337608913473
-80.0166327618667554
-7-0.171597543316492
-60.269428163691561
-50.127267906034811
-40.200903500174508
-30.324178486977437
-2-0.0697726315973241
-10.00918274989249554
00.544428300706769
1-0.0845859976367944
2-0.0100944226177530
30.165069377972691
4-0.0508118983640809
50.0172784364101373
6-0.175981642501063
7-0.426093437550577
8-0.0664818654219484
9-0.164063413416647
10-0.352480164798691
11-0.0761729183961277
12-0.108053412158608
13-0.00511698377747107


Parameters (Session):
par1 = 1 ; par2 = 0 ; par3 = 1 ; par4 = 12 ; par5 = 1 ; par6 = 0 ; par7 = 1 ;
Parameters (R input):
par1 = 1 ; par2 = 0 ; par3 = 1 ; par4 = 12 ; par5 = 1 ; par6 = 0 ; par7 = 1 ;
R code (references can be found in the software module):
par1 <- as.numeric(par1)
par2 <- as.numeric(par2)
par3 <- as.numeric(par3)
par4 <- as.numeric(par4)
par5 <- as.numeric(par5)
par6 <- as.numeric(par6)
par7 <- as.numeric(par7)
if (par1 == 0) {
x <- log(x)
} else {
x <- (x ^ par1 - 1) / par1
}
if (par5 == 0) {
y <- log(y)
} else {
y <- (y ^ par5 - 1) / par5
}
if (par2 > 0) x <- diff(x,lag=1,difference=par2)
if (par6 > 0) y <- diff(y,lag=1,difference=par6)
if (par3 > 0) x <- diff(x,lag=par4,difference=par3)
if (par7 > 0) y <- diff(y,lag=par4,difference=par7)
x
y
bitmap(file='test1.png')
(r <- ccf(x,y,main='Cross Correlation Function',ylab='CCF',xlab='Lag (k)'))
dev.off()
load(file='createtable')
a<-table.start()
a<-table.row.start(a)
a<-table.element(a,'Cross Correlation Function',2,TRUE)
a<-table.row.end(a)
a<-table.row.start(a)
a<-table.element(a,'Parameter',header=TRUE)
a<-table.element(a,'Value',header=TRUE)
a<-table.row.end(a)
a<-table.row.start(a)
a<-table.element(a,'Box-Cox transformation parameter (lambda) of X series',header=TRUE)
a<-table.element(a,par1)
a<-table.row.end(a)
a<-table.row.start(a)
a<-table.element(a,'Degree of non-seasonal differencing (d) of X series',header=TRUE)
a<-table.element(a,par2)
a<-table.row.end(a)
a<-table.row.start(a)
a<-table.element(a,'Degree of seasonal differencing (D) of X series',header=TRUE)
a<-table.element(a,par3)
a<-table.row.end(a)
a<-table.row.start(a)
a<-table.element(a,'Seasonal Period (s)',header=TRUE)
a<-table.element(a,par4)
a<-table.row.end(a)
a<-table.row.start(a)
a<-table.element(a,'Box-Cox transformation parameter (lambda) of Y series',header=TRUE)
a<-table.element(a,par5)
a<-table.row.end(a)
a<-table.row.start(a)
a<-table.element(a,'Degree of non-seasonal differencing (d) of Y series',header=TRUE)
a<-table.element(a,par6)
a<-table.row.end(a)
a<-table.row.start(a)
a<-table.element(a,'Degree of seasonal differencing (D) of Y series',header=TRUE)
a<-table.element(a,par7)
a<-table.row.end(a)
a<-table.row.start(a)
a<-table.element(a,'k',header=TRUE)
a<-table.element(a,'rho(Y[t],X[t+k])',header=TRUE)
a<-table.row.end(a)
mylength <- length(r$acf)
myhalf <- floor((mylength-1)/2)
for (i in 1:mylength) {
a<-table.row.start(a)
a<-table.element(a,i-myhalf-1,header=TRUE)
a<-table.element(a,r$acf[i])
a<-table.row.end(a)
}
a<-table.end(a)
table.save(a,file='mytable.tab')