Free Statistics

of Irreproducible Research!

Author's title

Author*The author of this computation has been verified*
R Software Modulerwasp_arimaforecasting.wasp
Title produced by softwareARIMA Forecasting
Date of computationFri, 12 Dec 2008 03:54:46 -0700
Cite this page as followsStatistical Computations at FreeStatistics.org, Office for Research Development and Education, URL https://freestatistics.org/blog/index.php?v=date/2008/Dec/12/t1229079382gl45cnppdb41moc.htm/, Retrieved Sun, 19 May 2024 04:00:16 +0000
Statistical Computations at FreeStatistics.org, Office for Research Development and Education, URL https://freestatistics.org/blog/index.php?pk=32534, Retrieved Sun, 19 May 2024 04:00:16 +0000
QR Codes:

Original text written by user:
IsPrivate?No (this computation is public)
User-defined keywords
Estimated Impact172
Family? (F = Feedback message, R = changed R code, M = changed R Module, P = changed Parameters, D = changed Data)
F       [ARIMA Forecasting] [ARIMA Forecasting...] [2008-12-12 10:54:46] [7957bb37a64ed417bbed8444b0b0ea8a] [Current]
Feedback Forum
2008-12-18 12:42:50 [Ken Van den Heuvel] [reply
Step 2:

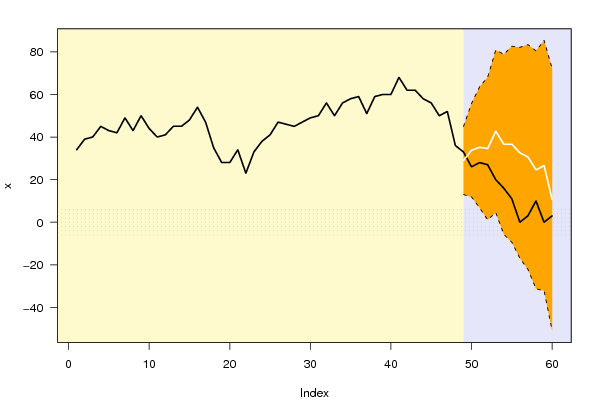
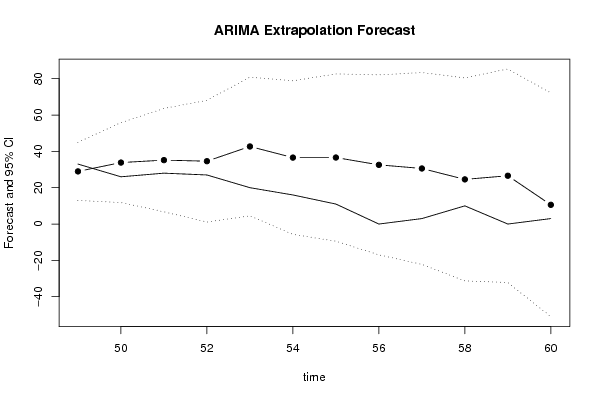
Een opmerking. Je stelt: 'De voorspelde waarden liggen telkens mooi in het midden, tussen de onder- en bovengrens.'

Dit is logisch en zal altijd het geval zijn. De grenzen duiden de verwachte fluctuatie aan van de voorspelling. Je moet dus enkel kijken op de werkelijke waarden tussen het interval van de voorspellingen liggen.

De p-waarde interpreteer je verkeerd. Als nullhypothese wordt er gesteld dat Ho: Yt = Ft.
Als de p-waarde kleiner is dan 5% dan is er minder dan 5% kans dat het resultaat aan toeval te wijten is. M.a.w., dan is de data significant verschillend van Ho en zal Yt = Ft (wat we zouden willen bereiken) niet van toepassing zijn. Een hoge p-waarde zal dus niet betekenen dat we de Ho verwerpen!
2008-12-18 12:47:07 [Ken Van den Heuvel] [reply
Step 4:

Deze vraag loste ge niet op bij mijn weten.

Kijken we terug naar de eerste tabel, meer bepaald de 7de, 8ste en 9de kolom.

De 7de kolom geeft P(F[t]>Y[t-1]). Dit is de stijgingskans 1 periode vooruit.
De 8ste kolom is P(F[t]>Y[t-s]). Dit is de stijgingskans tegenover dezelfde maand van het jaar voordien.
De 9de kolom is P(F[t]>Y[48]). Dit is de kans op stijging, berekend tegenover de laatst gekende waarde.

Post a new message
Dataseries X:
34
39
40
45
43
42
49
43
50
44
40
41
45
45
48
54
47
35
28
28
34
23
33
38
41
47
46
45
47
49
50
56
50
56
58
59
51
59
60
60
68
62
62
58
56
50
52
36
33
26
28
27
20
16
11
0
3
10
0
3


Summary of computational transaction
Raw Inputview raw input (R code)
Raw Outputview raw output of R engine
Computing time1 seconds
R Server'George Udny Yule' @ 72.249.76.132

\begin{tabular}{lllllllll}
\hline
Summary of computational transaction \tabularnewline
Raw Input & view raw input (R code)  \tabularnewline
Raw Output & view raw output of R engine  \tabularnewline
Computing time & 1 seconds \tabularnewline
R Server & 'George Udny Yule' @ 72.249.76.132 \tabularnewline
\hline
\end{tabular}
%Source: https://freestatistics.org/blog/index.php?pk=32534&T=0

[TABLE]
[ROW][C]Summary of computational transaction[/C][/ROW]
[ROW][C]Raw Input[/C][C]view raw input (R code) [/C][/ROW]
[ROW][C]Raw Output[/C][C]view raw output of R engine [/C][/ROW]
[ROW][C]Computing time[/C][C]1 seconds[/C][/ROW]
[ROW][C]R Server[/C][C]'George Udny Yule' @ 72.249.76.132[/C][/ROW]
[/TABLE]
Source: https://freestatistics.org/blog/index.php?pk=32534&T=0

Globally Unique Identifier (entire table): ba.freestatistics.org/blog/index.php?pk=32534&T=0

As an alternative you can also use a QR Code:  

The GUIDs for individual cells are displayed in the table below:

Summary of computational transaction
Raw Inputview raw input (R code)
Raw Outputview raw output of R engine
Computing time1 seconds
R Server'George Udny Yule' @ 72.249.76.132


Univariate ARIMA Extrapolation Forecast
timeY[t]F[t]95% LB95% UBp-value(H0: Y[t] = F[t])P(F[t]>Y[t-1])P(F[t]>Y[t-s])P(F[t]>Y[48])
3659-------
3751-------
3859-------
3960-------
4060-------
4168-------
4262-------
4362-------
4458-------
4556-------
4650-------
4752-------
4836-------
493328.961312.97144.95170.31030.19410.00350.1941
502633.824911.841255.80850.24270.52930.01240.4231
512835.17656.740963.61220.31040.73650.04350.4774
522734.5881.090668.08540.32850.65010.06850.4671
532042.6854.534580.83560.12190.78980.09670.6344
541636.5728-5.682778.82840.170.7790.11910.5106
551136.5968-9.440782.63430.13790.80970.13970.5101
56032.5751-16.948182.09820.09870.80340.15710.4461
57330.5807-22.205583.36680.15290.87190.17260.4203
581024.5764-31.280880.43360.30450.77550.18620.3443
59026.5777-32.191585.34690.18770.70980.19830.3767
60310.5768-50.966472.120.40470.63190.20910.2091

\begin{tabular}{lllllllll}
\hline
Univariate ARIMA Extrapolation Forecast \tabularnewline
time & Y[t] & F[t] & 95% LB & 95% UB & p-value(H0: Y[t] = F[t]) & P(F[t]>Y[t-1]) & P(F[t]>Y[t-s]) & P(F[t]>Y[48]) \tabularnewline
36 & 59 & - & - & - & - & - & - & - \tabularnewline
37 & 51 & - & - & - & - & - & - & - \tabularnewline
38 & 59 & - & - & - & - & - & - & - \tabularnewline
39 & 60 & - & - & - & - & - & - & - \tabularnewline
40 & 60 & - & - & - & - & - & - & - \tabularnewline
41 & 68 & - & - & - & - & - & - & - \tabularnewline
42 & 62 & - & - & - & - & - & - & - \tabularnewline
43 & 62 & - & - & - & - & - & - & - \tabularnewline
44 & 58 & - & - & - & - & - & - & - \tabularnewline
45 & 56 & - & - & - & - & - & - & - \tabularnewline
46 & 50 & - & - & - & - & - & - & - \tabularnewline
47 & 52 & - & - & - & - & - & - & - \tabularnewline
48 & 36 & - & - & - & - & - & - & - \tabularnewline
49 & 33 & 28.9613 & 12.971 & 44.9517 & 0.3103 & 0.1941 & 0.0035 & 0.1941 \tabularnewline
50 & 26 & 33.8249 & 11.8412 & 55.8085 & 0.2427 & 0.5293 & 0.0124 & 0.4231 \tabularnewline
51 & 28 & 35.1765 & 6.7409 & 63.6122 & 0.3104 & 0.7365 & 0.0435 & 0.4774 \tabularnewline
52 & 27 & 34.588 & 1.0906 & 68.0854 & 0.3285 & 0.6501 & 0.0685 & 0.4671 \tabularnewline
53 & 20 & 42.685 & 4.5345 & 80.8356 & 0.1219 & 0.7898 & 0.0967 & 0.6344 \tabularnewline
54 & 16 & 36.5728 & -5.6827 & 78.8284 & 0.17 & 0.779 & 0.1191 & 0.5106 \tabularnewline
55 & 11 & 36.5968 & -9.4407 & 82.6343 & 0.1379 & 0.8097 & 0.1397 & 0.5101 \tabularnewline
56 & 0 & 32.5751 & -16.9481 & 82.0982 & 0.0987 & 0.8034 & 0.1571 & 0.4461 \tabularnewline
57 & 3 & 30.5807 & -22.2055 & 83.3668 & 0.1529 & 0.8719 & 0.1726 & 0.4203 \tabularnewline
58 & 10 & 24.5764 & -31.2808 & 80.4336 & 0.3045 & 0.7755 & 0.1862 & 0.3443 \tabularnewline
59 & 0 & 26.5777 & -32.1915 & 85.3469 & 0.1877 & 0.7098 & 0.1983 & 0.3767 \tabularnewline
60 & 3 & 10.5768 & -50.9664 & 72.12 & 0.4047 & 0.6319 & 0.2091 & 0.2091 \tabularnewline
\hline
\end{tabular}
%Source: https://freestatistics.org/blog/index.php?pk=32534&T=1

[TABLE]
[ROW][C]Univariate ARIMA Extrapolation Forecast[/C][/ROW]
[ROW][C]time[/C][C]Y[t][/C][C]F[t][/C][C]95% LB[/C][C]95% UB[/C][C]p-value(H0: Y[t] = F[t])[/C][C]P(F[t]>Y[t-1])[/C][C]P(F[t]>Y[t-s])[/C][C]P(F[t]>Y[48])[/C][/ROW]
[ROW][C]36[/C][C]59[/C][C]-[/C][C]-[/C][C]-[/C][C]-[/C][C]-[/C][C]-[/C][C]-[/C][/ROW]
[ROW][C]37[/C][C]51[/C][C]-[/C][C]-[/C][C]-[/C][C]-[/C][C]-[/C][C]-[/C][C]-[/C][/ROW]
[ROW][C]38[/C][C]59[/C][C]-[/C][C]-[/C][C]-[/C][C]-[/C][C]-[/C][C]-[/C][C]-[/C][/ROW]
[ROW][C]39[/C][C]60[/C][C]-[/C][C]-[/C][C]-[/C][C]-[/C][C]-[/C][C]-[/C][C]-[/C][/ROW]
[ROW][C]40[/C][C]60[/C][C]-[/C][C]-[/C][C]-[/C][C]-[/C][C]-[/C][C]-[/C][C]-[/C][/ROW]
[ROW][C]41[/C][C]68[/C][C]-[/C][C]-[/C][C]-[/C][C]-[/C][C]-[/C][C]-[/C][C]-[/C][/ROW]
[ROW][C]42[/C][C]62[/C][C]-[/C][C]-[/C][C]-[/C][C]-[/C][C]-[/C][C]-[/C][C]-[/C][/ROW]
[ROW][C]43[/C][C]62[/C][C]-[/C][C]-[/C][C]-[/C][C]-[/C][C]-[/C][C]-[/C][C]-[/C][/ROW]
[ROW][C]44[/C][C]58[/C][C]-[/C][C]-[/C][C]-[/C][C]-[/C][C]-[/C][C]-[/C][C]-[/C][/ROW]
[ROW][C]45[/C][C]56[/C][C]-[/C][C]-[/C][C]-[/C][C]-[/C][C]-[/C][C]-[/C][C]-[/C][/ROW]
[ROW][C]46[/C][C]50[/C][C]-[/C][C]-[/C][C]-[/C][C]-[/C][C]-[/C][C]-[/C][C]-[/C][/ROW]
[ROW][C]47[/C][C]52[/C][C]-[/C][C]-[/C][C]-[/C][C]-[/C][C]-[/C][C]-[/C][C]-[/C][/ROW]
[ROW][C]48[/C][C]36[/C][C]-[/C][C]-[/C][C]-[/C][C]-[/C][C]-[/C][C]-[/C][C]-[/C][/ROW]
[ROW][C]49[/C][C]33[/C][C]28.9613[/C][C]12.971[/C][C]44.9517[/C][C]0.3103[/C][C]0.1941[/C][C]0.0035[/C][C]0.1941[/C][/ROW]
[ROW][C]50[/C][C]26[/C][C]33.8249[/C][C]11.8412[/C][C]55.8085[/C][C]0.2427[/C][C]0.5293[/C][C]0.0124[/C][C]0.4231[/C][/ROW]
[ROW][C]51[/C][C]28[/C][C]35.1765[/C][C]6.7409[/C][C]63.6122[/C][C]0.3104[/C][C]0.7365[/C][C]0.0435[/C][C]0.4774[/C][/ROW]
[ROW][C]52[/C][C]27[/C][C]34.588[/C][C]1.0906[/C][C]68.0854[/C][C]0.3285[/C][C]0.6501[/C][C]0.0685[/C][C]0.4671[/C][/ROW]
[ROW][C]53[/C][C]20[/C][C]42.685[/C][C]4.5345[/C][C]80.8356[/C][C]0.1219[/C][C]0.7898[/C][C]0.0967[/C][C]0.6344[/C][/ROW]
[ROW][C]54[/C][C]16[/C][C]36.5728[/C][C]-5.6827[/C][C]78.8284[/C][C]0.17[/C][C]0.779[/C][C]0.1191[/C][C]0.5106[/C][/ROW]
[ROW][C]55[/C][C]11[/C][C]36.5968[/C][C]-9.4407[/C][C]82.6343[/C][C]0.1379[/C][C]0.8097[/C][C]0.1397[/C][C]0.5101[/C][/ROW]
[ROW][C]56[/C][C]0[/C][C]32.5751[/C][C]-16.9481[/C][C]82.0982[/C][C]0.0987[/C][C]0.8034[/C][C]0.1571[/C][C]0.4461[/C][/ROW]
[ROW][C]57[/C][C]3[/C][C]30.5807[/C][C]-22.2055[/C][C]83.3668[/C][C]0.1529[/C][C]0.8719[/C][C]0.1726[/C][C]0.4203[/C][/ROW]
[ROW][C]58[/C][C]10[/C][C]24.5764[/C][C]-31.2808[/C][C]80.4336[/C][C]0.3045[/C][C]0.7755[/C][C]0.1862[/C][C]0.3443[/C][/ROW]
[ROW][C]59[/C][C]0[/C][C]26.5777[/C][C]-32.1915[/C][C]85.3469[/C][C]0.1877[/C][C]0.7098[/C][C]0.1983[/C][C]0.3767[/C][/ROW]
[ROW][C]60[/C][C]3[/C][C]10.5768[/C][C]-50.9664[/C][C]72.12[/C][C]0.4047[/C][C]0.6319[/C][C]0.2091[/C][C]0.2091[/C][/ROW]
[/TABLE]
Source: https://freestatistics.org/blog/index.php?pk=32534&T=1

Globally Unique Identifier (entire table): ba.freestatistics.org/blog/index.php?pk=32534&T=1

As an alternative you can also use a QR Code:  

The GUIDs for individual cells are displayed in the table below:

Univariate ARIMA Extrapolation Forecast
timeY[t]F[t]95% LB95% UBp-value(H0: Y[t] = F[t])P(F[t]>Y[t-1])P(F[t]>Y[t-s])P(F[t]>Y[48])
3659-------
3751-------
3859-------
3960-------
4060-------
4168-------
4262-------
4362-------
4458-------
4556-------
4650-------
4752-------
4836-------
493328.961312.97144.95170.31030.19410.00350.1941
502633.824911.841255.80850.24270.52930.01240.4231
512835.17656.740963.61220.31040.73650.04350.4774
522734.5881.090668.08540.32850.65010.06850.4671
532042.6854.534580.83560.12190.78980.09670.6344
541636.5728-5.682778.82840.170.7790.11910.5106
551136.5968-9.440782.63430.13790.80970.13970.5101
56032.5751-16.948182.09820.09870.80340.15710.4461
57330.5807-22.205583.36680.15290.87190.17260.4203
581024.5764-31.280880.43360.30450.77550.18620.3443
59026.5777-32.191585.34690.18770.70980.19830.3767
60310.5768-50.966472.120.40470.63190.20910.2091


Univariate ARIMA Extrapolation Forecast Performance
time% S.E.PEMAPESq.EMSERMSE
490.28170.13940.011616.31071.35921.1659
500.3316-0.23130.019361.22865.10242.2588
510.4124-0.2040.01751.50264.29192.0717
520.4941-0.21940.018357.57784.79812.1905
530.456-0.53150.0443514.61142.88426.5486
540.5895-0.56250.0469423.242235.27025.9389
550.6418-0.69940.0583655.195554.59967.3892
560.7757-10.08331061.136788.42819.4036
570.8807-0.90190.0752760.692863.39117.9619
581.1596-0.59310.0494212.471817.7064.2078
591.1282-10.0833706.372158.86437.6723
602.9687-0.71640.059757.40824.7842.1872

\begin{tabular}{lllllllll}
\hline
Univariate ARIMA Extrapolation Forecast Performance \tabularnewline
time & % S.E. & PE & MAPE & Sq.E & MSE & RMSE \tabularnewline
49 & 0.2817 & 0.1394 & 0.0116 & 16.3107 & 1.3592 & 1.1659 \tabularnewline
50 & 0.3316 & -0.2313 & 0.0193 & 61.2286 & 5.1024 & 2.2588 \tabularnewline
51 & 0.4124 & -0.204 & 0.017 & 51.5026 & 4.2919 & 2.0717 \tabularnewline
52 & 0.4941 & -0.2194 & 0.0183 & 57.5778 & 4.7981 & 2.1905 \tabularnewline
53 & 0.456 & -0.5315 & 0.0443 & 514.611 & 42.8842 & 6.5486 \tabularnewline
54 & 0.5895 & -0.5625 & 0.0469 & 423.2422 & 35.2702 & 5.9389 \tabularnewline
55 & 0.6418 & -0.6994 & 0.0583 & 655.1955 & 54.5996 & 7.3892 \tabularnewline
56 & 0.7757 & -1 & 0.0833 & 1061.1367 & 88.4281 & 9.4036 \tabularnewline
57 & 0.8807 & -0.9019 & 0.0752 & 760.6928 & 63.3911 & 7.9619 \tabularnewline
58 & 1.1596 & -0.5931 & 0.0494 & 212.4718 & 17.706 & 4.2078 \tabularnewline
59 & 1.1282 & -1 & 0.0833 & 706.3721 & 58.8643 & 7.6723 \tabularnewline
60 & 2.9687 & -0.7164 & 0.0597 & 57.4082 & 4.784 & 2.1872 \tabularnewline
\hline
\end{tabular}
%Source: https://freestatistics.org/blog/index.php?pk=32534&T=2

[TABLE]
[ROW][C]Univariate ARIMA Extrapolation Forecast Performance[/C][/ROW]
[ROW][C]time[/C][C]% S.E.[/C][C]PE[/C][C]MAPE[/C][C]Sq.E[/C][C]MSE[/C][C]RMSE[/C][/ROW]
[ROW][C]49[/C][C]0.2817[/C][C]0.1394[/C][C]0.0116[/C][C]16.3107[/C][C]1.3592[/C][C]1.1659[/C][/ROW]
[ROW][C]50[/C][C]0.3316[/C][C]-0.2313[/C][C]0.0193[/C][C]61.2286[/C][C]5.1024[/C][C]2.2588[/C][/ROW]
[ROW][C]51[/C][C]0.4124[/C][C]-0.204[/C][C]0.017[/C][C]51.5026[/C][C]4.2919[/C][C]2.0717[/C][/ROW]
[ROW][C]52[/C][C]0.4941[/C][C]-0.2194[/C][C]0.0183[/C][C]57.5778[/C][C]4.7981[/C][C]2.1905[/C][/ROW]
[ROW][C]53[/C][C]0.456[/C][C]-0.5315[/C][C]0.0443[/C][C]514.611[/C][C]42.8842[/C][C]6.5486[/C][/ROW]
[ROW][C]54[/C][C]0.5895[/C][C]-0.5625[/C][C]0.0469[/C][C]423.2422[/C][C]35.2702[/C][C]5.9389[/C][/ROW]
[ROW][C]55[/C][C]0.6418[/C][C]-0.6994[/C][C]0.0583[/C][C]655.1955[/C][C]54.5996[/C][C]7.3892[/C][/ROW]
[ROW][C]56[/C][C]0.7757[/C][C]-1[/C][C]0.0833[/C][C]1061.1367[/C][C]88.4281[/C][C]9.4036[/C][/ROW]
[ROW][C]57[/C][C]0.8807[/C][C]-0.9019[/C][C]0.0752[/C][C]760.6928[/C][C]63.3911[/C][C]7.9619[/C][/ROW]
[ROW][C]58[/C][C]1.1596[/C][C]-0.5931[/C][C]0.0494[/C][C]212.4718[/C][C]17.706[/C][C]4.2078[/C][/ROW]
[ROW][C]59[/C][C]1.1282[/C][C]-1[/C][C]0.0833[/C][C]706.3721[/C][C]58.8643[/C][C]7.6723[/C][/ROW]
[ROW][C]60[/C][C]2.9687[/C][C]-0.7164[/C][C]0.0597[/C][C]57.4082[/C][C]4.784[/C][C]2.1872[/C][/ROW]
[/TABLE]
Source: https://freestatistics.org/blog/index.php?pk=32534&T=2

Globally Unique Identifier (entire table): ba.freestatistics.org/blog/index.php?pk=32534&T=2

As an alternative you can also use a QR Code:  

The GUIDs for individual cells are displayed in the table below:

Univariate ARIMA Extrapolation Forecast Performance
time% S.E.PEMAPESq.EMSERMSE
490.28170.13940.011616.31071.35921.1659
500.3316-0.23130.019361.22865.10242.2588
510.4124-0.2040.01751.50264.29192.0717
520.4941-0.21940.018357.57784.79812.1905
530.456-0.53150.0443514.61142.88426.5486
540.5895-0.56250.0469423.242235.27025.9389
550.6418-0.69940.0583655.195554.59967.3892
560.7757-10.08331061.136788.42819.4036
570.8807-0.90190.0752760.692863.39117.9619
581.1596-0.59310.0494212.471817.7064.2078
591.1282-10.0833706.372158.86437.6723
602.9687-0.71640.059757.40824.7842.1872


Parameters (Session):
par1 = 12 ; par2 = 1 ; par3 = 1 ; par4 = 1 ; par5 = 12 ; par6 = 2 ; par7 = 0 ; par8 = 0 ; par9 = 0 ; par10 = FALSE ;
Parameters (R input):
par1 = 12 ; par2 = 1 ; par3 = 1 ; par4 = 1 ; par5 = 12 ; par6 = 2 ; par7 = 0 ; par8 = 0 ; par9 = 0 ; par10 = FALSE ;
R code (references can be found in the software module):
par1 <- as.numeric(par1) #cut off periods
par2 <- as.numeric(par2) #lambda
par3 <- as.numeric(par3) #degree of non-seasonal differencing
par4 <- as.numeric(par4) #degree of seasonal differencing
par5 <- as.numeric(par5) #seasonal period
par6 <- as.numeric(par6) #p
par7 <- as.numeric(par7) #q
par8 <- as.numeric(par8) #P
par9 <- as.numeric(par9) #Q
if (par10 == 'TRUE') par10 <- TRUE
if (par10 == 'FALSE') par10 <- FALSE
if (par2 == 0) x <- log(x)
if (par2 != 0) x <- x^par2
lx <- length(x)
first <- lx - 2*par1
nx <- lx - par1
nx1 <- nx + 1
fx <- lx - nx
if (fx < 1) {
fx <- par5
nx1 <- lx + fx - 1
first <- lx - 2*fx
}
first <- 1
if (fx < 3) fx <- round(lx/10,0)
(arima.out <- arima(x[1:nx], order=c(par6,par3,par7), seasonal=list(order=c(par8,par4,par9), period=par5), include.mean=par10, method='ML'))
(forecast <- predict(arima.out,fx))
(lb <- forecast$pred - 1.96 * forecast$se)
(ub <- forecast$pred + 1.96 * forecast$se)
if (par2 == 0) {
x <- exp(x)
forecast$pred <- exp(forecast$pred)
lb <- exp(lb)
ub <- exp(ub)
}
if (par2 != 0) {
x <- x^(1/par2)
forecast$pred <- forecast$pred^(1/par2)
lb <- lb^(1/par2)
ub <- ub^(1/par2)
}
if (par2 < 0) {
olb <- lb
lb <- ub
ub <- olb
}
(actandfor <- c(x[1:nx], forecast$pred))
(perc.se <- (ub-forecast$pred)/1.96/forecast$pred)
bitmap(file='test1.png')
opar <- par(mar=c(4,4,2,2),las=1)
ylim <- c( min(x[first:nx],lb), max(x[first:nx],ub))
plot(x,ylim=ylim,type='n',xlim=c(first,lx))
usr <- par('usr')
rect(usr[1],usr[3],nx+1,usr[4],border=NA,col='lemonchiffon')
rect(nx1,usr[3],usr[2],usr[4],border=NA,col='lavender')
abline(h= (-3:3)*2 , col ='gray', lty =3)
polygon( c(nx1:lx,lx:nx1), c(lb,rev(ub)), col = 'orange', lty=2,border=NA)
lines(nx1:lx, lb , lty=2)
lines(nx1:lx, ub , lty=2)
lines(x, lwd=2)
lines(nx1:lx, forecast$pred , lwd=2 , col ='white')
box()
par(opar)
dev.off()
prob.dec <- array(NA, dim=fx)
prob.sdec <- array(NA, dim=fx)
prob.ldec <- array(NA, dim=fx)
prob.pval <- array(NA, dim=fx)
perf.pe <- array(0, dim=fx)
perf.mape <- array(0, dim=fx)
perf.se <- array(0, dim=fx)
perf.mse <- array(0, dim=fx)
perf.rmse <- array(0, dim=fx)
for (i in 1:fx) {
locSD <- (ub[i] - forecast$pred[i]) / 1.96
perf.pe[i] = (x[nx+i] - forecast$pred[i]) / forecast$pred[i]
perf.mape[i] = perf.mape[i] + abs(perf.pe[i])
perf.se[i] = (x[nx+i] - forecast$pred[i])^2
perf.mse[i] = perf.mse[i] + perf.se[i]
prob.dec[i] = pnorm((x[nx+i-1] - forecast$pred[i]) / locSD)
prob.sdec[i] = pnorm((x[nx+i-par5] - forecast$pred[i]) / locSD)
prob.ldec[i] = pnorm((x[nx] - forecast$pred[i]) / locSD)
prob.pval[i] = pnorm(abs(x[nx+i] - forecast$pred[i]) / locSD)
}
perf.mape = perf.mape / fx
perf.mse = perf.mse / fx
perf.rmse = sqrt(perf.mse)
bitmap(file='test2.png')
plot(forecast$pred, pch=19, type='b',main='ARIMA Extrapolation Forecast', ylab='Forecast and 95% CI', xlab='time',ylim=c(min(lb),max(ub)))
dum <- forecast$pred
dum[1:12] <- x[(nx+1):lx]
lines(dum, lty=1)
lines(ub,lty=3)
lines(lb,lty=3)
dev.off()
load(file='createtable')
a<-table.start()
a<-table.row.start(a)
a<-table.element(a,'Univariate ARIMA Extrapolation Forecast',9,TRUE)
a<-table.row.end(a)
a<-table.row.start(a)
a<-table.element(a,'time',1,header=TRUE)
a<-table.element(a,'Y[t]',1,header=TRUE)
a<-table.element(a,'F[t]',1,header=TRUE)
a<-table.element(a,'95% LB',1,header=TRUE)
a<-table.element(a,'95% UB',1,header=TRUE)
a<-table.element(a,'p-value
(H0: Y[t] = F[t])',1,header=TRUE)
a<-table.element(a,'P(F[t]>Y[t-1])',1,header=TRUE)
a<-table.element(a,'P(F[t]>Y[t-s])',1,header=TRUE)
mylab <- paste('P(F[t]>Y[',nx,sep='')
mylab <- paste(mylab,'])',sep='')
a<-table.element(a,mylab,1,header=TRUE)
a<-table.row.end(a)
for (i in (nx-par5):nx) {
a<-table.row.start(a)
a<-table.element(a,i,header=TRUE)
a<-table.element(a,x[i])
a<-table.element(a,'-')
a<-table.row.end(a)
}
for (i in 1:fx) {
a<-table.row.start(a)
a<-table.element(a,nx+i,header=TRUE)
a<-table.element(a,round(x[nx+i],4))
a<-table.element(a,round(forecast$pred[i],4))
a<-table.element(a,round(lb[i],4))
a<-table.element(a,round(ub[i],4))
a<-table.element(a,round((1-prob.pval[i]),4))
a<-table.element(a,round((1-prob.dec[i]),4))
a<-table.element(a,round((1-prob.sdec[i]),4))
a<-table.element(a,round((1-prob.ldec[i]),4))
a<-table.row.end(a)
}
a<-table.end(a)
table.save(a,file='mytable.tab')
a<-table.start()
a<-table.row.start(a)
a<-table.element(a,'Univariate ARIMA Extrapolation Forecast Performance',7,TRUE)
a<-table.row.end(a)
a<-table.row.start(a)
a<-table.element(a,'time',1,header=TRUE)
a<-table.element(a,'% S.E.',1,header=TRUE)
a<-table.element(a,'PE',1,header=TRUE)
a<-table.element(a,'MAPE',1,header=TRUE)
a<-table.element(a,'Sq.E',1,header=TRUE)
a<-table.element(a,'MSE',1,header=TRUE)
a<-table.element(a,'RMSE',1,header=TRUE)
a<-table.row.end(a)
for (i in 1:fx) {
a<-table.row.start(a)
a<-table.element(a,nx+i,header=TRUE)
a<-table.element(a,round(perc.se[i],4))
a<-table.element(a,round(perf.pe[i],4))
a<-table.element(a,round(perf.mape[i],4))
a<-table.element(a,round(perf.se[i],4))
a<-table.element(a,round(perf.mse[i],4))
a<-table.element(a,round(perf.rmse[i],4))
a<-table.row.end(a)
}
a<-table.end(a)
table.save(a,file='mytable1.tab')