Free Statistics

of Irreproducible Research!

Author's title

Author*Unverified author*
R Software Modulerwasp_autocorrelation.wasp
Title produced by software(Partial) Autocorrelation Function
Date of computationThu, 11 Dec 2008 15:50:18 -0700
Cite this page as followsStatistical Computations at FreeStatistics.org, Office for Research Development and Education, URL https://freestatistics.org/blog/index.php?v=date/2008/Dec/11/t1229035942p0tl9yudcdlv9b1.htm/, Retrieved Sun, 19 May 2024 06:47:09 +0000
Statistical Computations at FreeStatistics.org, Office for Research Development and Education, URL https://freestatistics.org/blog/index.php?pk=32461, Retrieved Sun, 19 May 2024 06:47:09 +0000
QR Codes:

Original text written by user:
IsPrivate?No (this computation is public)
User-defined keywords
Estimated Impact144
Family? (F = Feedback message, R = changed R code, M = changed R Module, P = changed Parameters, D = changed Data)
-       [(Partial) Autocorrelation Function] [2MAR03A_Robbe Ley...] [2008-12-11 22:50:18] [5cfda051308d8cc79b9da3748118f98f] [Current]
Feedback Forum

Post a new message
Dataseries X:
284.4   
212.8  
226.9   
308.4
262
227.9
236.1
320.4
271.9
232.8
237
313.4
261.4
226.8
249.9
314.3
286.1
226.5
260.4
311.4
294.7
232.6
257.2
339.2
279.1
249.8
269.8
345.7
293.8
254.7
277.5
363.4
313.4
272.8
300.1
369.5
330.8
287.8
305.9
386.1
335.2
288
308.3
402.3
352.8
316.1
324.9
404.8
393
318.9
327
442.3
383.1
331.6
361.4
445.9
386.6
357.2
373.6
466.2
409.6
369.8
378.6
487
419.2
376.7
392.8
506.1
458.4
387.4
426.9
565
464.8
444.5
449.5
556.1
499.6
451.9
434.9
553.8
510
432.9
453.2
547.6
485.8
452.6
456.6
565.7
514.8
464.3
430.9
588.3
503.1
442.6
448
554.5
504.5
427.3
473.1
526.2
547.5
440.2
468.7
574.5
492.6
432.6
479.8
575.7
474.6
405.3
434.6
535.1
452.6
429.5
417.2
551.8
464
416.6
422.9
553.6
458.6
427.6
429.2
534.2
481.7
416
440.2
538.7
473.8
439.9
446.8
597.5
467.2
439.4
447.4
568.5
485.9
442.1
430.5
600
464.5
423.6
437
574
443
410
420
532
432
420
411
512
449
382


Summary of computational transaction
Raw Inputview raw input (R code)
Raw Outputview raw output of R engine
Computing time2 seconds
R Server'Sir Ronald Aylmer Fisher' @ 193.190.124.24

\begin{tabular}{lllllllll}
\hline
Summary of computational transaction \tabularnewline
Raw Input & view raw input (R code)  \tabularnewline
Raw Output & view raw output of R engine  \tabularnewline
Computing time & 2 seconds \tabularnewline
R Server & 'Sir Ronald Aylmer Fisher' @ 193.190.124.24 \tabularnewline
\hline
\end{tabular}
%Source: https://freestatistics.org/blog/index.php?pk=32461&T=0

[TABLE]
[ROW][C]Summary of computational transaction[/C][/ROW]
[ROW][C]Raw Input[/C][C]view raw input (R code) [/C][/ROW]
[ROW][C]Raw Output[/C][C]view raw output of R engine [/C][/ROW]
[ROW][C]Computing time[/C][C]2 seconds[/C][/ROW]
[ROW][C]R Server[/C][C]'Sir Ronald Aylmer Fisher' @ 193.190.124.24[/C][/ROW]
[/TABLE]
Source: https://freestatistics.org/blog/index.php?pk=32461&T=0

Globally Unique Identifier (entire table): ba.freestatistics.org/blog/index.php?pk=32461&T=0

As an alternative you can also use a QR Code:  

The GUIDs for individual cells are displayed in the table below:

Summary of computational transaction
Raw Inputview raw input (R code)
Raw Outputview raw output of R engine
Computing time2 seconds
R Server'Sir Ronald Aylmer Fisher' @ 193.190.124.24


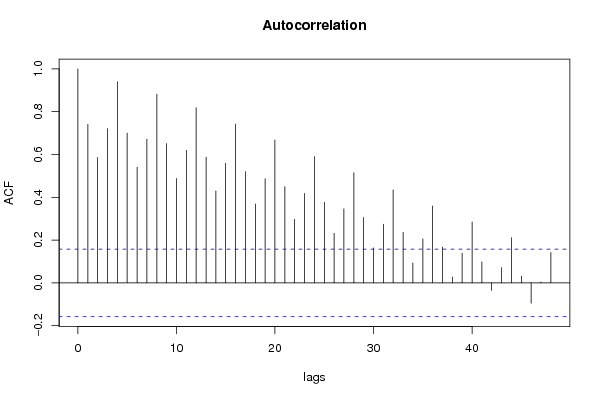
Autocorrelation Function
Time lag kACF(k)T-STATP-value
10.7406689.19150
20.5861077.27340
30.7202278.93780
40.9403211.66910
50.6992888.67790
60.5408026.71120
70.6718568.33750
80.88182110.94310
90.6510028.07870
100.4883256.060
110.6195527.68840
120.81894510.16280
130.5875457.29120
140.4293295.32780
150.5588636.93530
160.7429299.21950
170.5196436.44860
180.3686124.57445e-06
190.4867016.03980
200.6673748.28190
210.4498735.58280
220.2971233.68720.000157
230.4175715.18190
240.5895277.31580
250.3765064.67233e-06
260.2314642.87240.002324
270.3459224.29281.6e-05
280.5148746.38940
290.3058883.7960.000106
300.1635722.02990.022046
310.2742793.40370.000424
320.4346065.39330
330.2369762.94080.00189
340.0933121.1580.124335
350.2047752.54120.006018
360.3591124.45658e-06
370.1672332.07530.019811
380.0270020.33510.369007
390.1385721.71960.043754
400.2846523.53240.000272
410.0974481.20930.1142
42-0.035308-0.43820.330942
430.0705780.87580.191238
440.2106032.61350.004925
450.0315790.39190.347844
46-0.09492-1.17790.120321
470.0036620.04540.481906
480.1414791.75570.040563

\begin{tabular}{lllllllll}
\hline
Autocorrelation Function \tabularnewline
Time lag k & ACF(k) & T-STAT & P-value \tabularnewline
1 & 0.740668 & 9.1915 & 0 \tabularnewline
2 & 0.586107 & 7.2734 & 0 \tabularnewline
3 & 0.720227 & 8.9378 & 0 \tabularnewline
4 & 0.94032 & 11.6691 & 0 \tabularnewline
5 & 0.699288 & 8.6779 & 0 \tabularnewline
6 & 0.540802 & 6.7112 & 0 \tabularnewline
7 & 0.671856 & 8.3375 & 0 \tabularnewline
8 & 0.881821 & 10.9431 & 0 \tabularnewline
9 & 0.651002 & 8.0787 & 0 \tabularnewline
10 & 0.488325 & 6.06 & 0 \tabularnewline
11 & 0.619552 & 7.6884 & 0 \tabularnewline
12 & 0.818945 & 10.1628 & 0 \tabularnewline
13 & 0.587545 & 7.2912 & 0 \tabularnewline
14 & 0.429329 & 5.3278 & 0 \tabularnewline
15 & 0.558863 & 6.9353 & 0 \tabularnewline
16 & 0.742929 & 9.2195 & 0 \tabularnewline
17 & 0.519643 & 6.4486 & 0 \tabularnewline
18 & 0.368612 & 4.5744 & 5e-06 \tabularnewline
19 & 0.486701 & 6.0398 & 0 \tabularnewline
20 & 0.667374 & 8.2819 & 0 \tabularnewline
21 & 0.449873 & 5.5828 & 0 \tabularnewline
22 & 0.297123 & 3.6872 & 0.000157 \tabularnewline
23 & 0.417571 & 5.1819 & 0 \tabularnewline
24 & 0.589527 & 7.3158 & 0 \tabularnewline
25 & 0.376506 & 4.6723 & 3e-06 \tabularnewline
26 & 0.231464 & 2.8724 & 0.002324 \tabularnewline
27 & 0.345922 & 4.2928 & 1.6e-05 \tabularnewline
28 & 0.514874 & 6.3894 & 0 \tabularnewline
29 & 0.305888 & 3.796 & 0.000106 \tabularnewline
30 & 0.163572 & 2.0299 & 0.022046 \tabularnewline
31 & 0.274279 & 3.4037 & 0.000424 \tabularnewline
32 & 0.434606 & 5.3933 & 0 \tabularnewline
33 & 0.236976 & 2.9408 & 0.00189 \tabularnewline
34 & 0.093312 & 1.158 & 0.124335 \tabularnewline
35 & 0.204775 & 2.5412 & 0.006018 \tabularnewline
36 & 0.359112 & 4.4565 & 8e-06 \tabularnewline
37 & 0.167233 & 2.0753 & 0.019811 \tabularnewline
38 & 0.027002 & 0.3351 & 0.369007 \tabularnewline
39 & 0.138572 & 1.7196 & 0.043754 \tabularnewline
40 & 0.284652 & 3.5324 & 0.000272 \tabularnewline
41 & 0.097448 & 1.2093 & 0.1142 \tabularnewline
42 & -0.035308 & -0.4382 & 0.330942 \tabularnewline
43 & 0.070578 & 0.8758 & 0.191238 \tabularnewline
44 & 0.210603 & 2.6135 & 0.004925 \tabularnewline
45 & 0.031579 & 0.3919 & 0.347844 \tabularnewline
46 & -0.09492 & -1.1779 & 0.120321 \tabularnewline
47 & 0.003662 & 0.0454 & 0.481906 \tabularnewline
48 & 0.141479 & 1.7557 & 0.040563 \tabularnewline
\hline
\end{tabular}
%Source: https://freestatistics.org/blog/index.php?pk=32461&T=1

[TABLE]
[ROW][C]Autocorrelation Function[/C][/ROW]
[ROW][C]Time lag k[/C][C]ACF(k)[/C][C]T-STAT[/C][C]P-value[/C][/ROW]
[ROW][C]1[/C][C]0.740668[/C][C]9.1915[/C][C]0[/C][/ROW]
[ROW][C]2[/C][C]0.586107[/C][C]7.2734[/C][C]0[/C][/ROW]
[ROW][C]3[/C][C]0.720227[/C][C]8.9378[/C][C]0[/C][/ROW]
[ROW][C]4[/C][C]0.94032[/C][C]11.6691[/C][C]0[/C][/ROW]
[ROW][C]5[/C][C]0.699288[/C][C]8.6779[/C][C]0[/C][/ROW]
[ROW][C]6[/C][C]0.540802[/C][C]6.7112[/C][C]0[/C][/ROW]
[ROW][C]7[/C][C]0.671856[/C][C]8.3375[/C][C]0[/C][/ROW]
[ROW][C]8[/C][C]0.881821[/C][C]10.9431[/C][C]0[/C][/ROW]
[ROW][C]9[/C][C]0.651002[/C][C]8.0787[/C][C]0[/C][/ROW]
[ROW][C]10[/C][C]0.488325[/C][C]6.06[/C][C]0[/C][/ROW]
[ROW][C]11[/C][C]0.619552[/C][C]7.6884[/C][C]0[/C][/ROW]
[ROW][C]12[/C][C]0.818945[/C][C]10.1628[/C][C]0[/C][/ROW]
[ROW][C]13[/C][C]0.587545[/C][C]7.2912[/C][C]0[/C][/ROW]
[ROW][C]14[/C][C]0.429329[/C][C]5.3278[/C][C]0[/C][/ROW]
[ROW][C]15[/C][C]0.558863[/C][C]6.9353[/C][C]0[/C][/ROW]
[ROW][C]16[/C][C]0.742929[/C][C]9.2195[/C][C]0[/C][/ROW]
[ROW][C]17[/C][C]0.519643[/C][C]6.4486[/C][C]0[/C][/ROW]
[ROW][C]18[/C][C]0.368612[/C][C]4.5744[/C][C]5e-06[/C][/ROW]
[ROW][C]19[/C][C]0.486701[/C][C]6.0398[/C][C]0[/C][/ROW]
[ROW][C]20[/C][C]0.667374[/C][C]8.2819[/C][C]0[/C][/ROW]
[ROW][C]21[/C][C]0.449873[/C][C]5.5828[/C][C]0[/C][/ROW]
[ROW][C]22[/C][C]0.297123[/C][C]3.6872[/C][C]0.000157[/C][/ROW]
[ROW][C]23[/C][C]0.417571[/C][C]5.1819[/C][C]0[/C][/ROW]
[ROW][C]24[/C][C]0.589527[/C][C]7.3158[/C][C]0[/C][/ROW]
[ROW][C]25[/C][C]0.376506[/C][C]4.6723[/C][C]3e-06[/C][/ROW]
[ROW][C]26[/C][C]0.231464[/C][C]2.8724[/C][C]0.002324[/C][/ROW]
[ROW][C]27[/C][C]0.345922[/C][C]4.2928[/C][C]1.6e-05[/C][/ROW]
[ROW][C]28[/C][C]0.514874[/C][C]6.3894[/C][C]0[/C][/ROW]
[ROW][C]29[/C][C]0.305888[/C][C]3.796[/C][C]0.000106[/C][/ROW]
[ROW][C]30[/C][C]0.163572[/C][C]2.0299[/C][C]0.022046[/C][/ROW]
[ROW][C]31[/C][C]0.274279[/C][C]3.4037[/C][C]0.000424[/C][/ROW]
[ROW][C]32[/C][C]0.434606[/C][C]5.3933[/C][C]0[/C][/ROW]
[ROW][C]33[/C][C]0.236976[/C][C]2.9408[/C][C]0.00189[/C][/ROW]
[ROW][C]34[/C][C]0.093312[/C][C]1.158[/C][C]0.124335[/C][/ROW]
[ROW][C]35[/C][C]0.204775[/C][C]2.5412[/C][C]0.006018[/C][/ROW]
[ROW][C]36[/C][C]0.359112[/C][C]4.4565[/C][C]8e-06[/C][/ROW]
[ROW][C]37[/C][C]0.167233[/C][C]2.0753[/C][C]0.019811[/C][/ROW]
[ROW][C]38[/C][C]0.027002[/C][C]0.3351[/C][C]0.369007[/C][/ROW]
[ROW][C]39[/C][C]0.138572[/C][C]1.7196[/C][C]0.043754[/C][/ROW]
[ROW][C]40[/C][C]0.284652[/C][C]3.5324[/C][C]0.000272[/C][/ROW]
[ROW][C]41[/C][C]0.097448[/C][C]1.2093[/C][C]0.1142[/C][/ROW]
[ROW][C]42[/C][C]-0.035308[/C][C]-0.4382[/C][C]0.330942[/C][/ROW]
[ROW][C]43[/C][C]0.070578[/C][C]0.8758[/C][C]0.191238[/C][/ROW]
[ROW][C]44[/C][C]0.210603[/C][C]2.6135[/C][C]0.004925[/C][/ROW]
[ROW][C]45[/C][C]0.031579[/C][C]0.3919[/C][C]0.347844[/C][/ROW]
[ROW][C]46[/C][C]-0.09492[/C][C]-1.1779[/C][C]0.120321[/C][/ROW]
[ROW][C]47[/C][C]0.003662[/C][C]0.0454[/C][C]0.481906[/C][/ROW]
[ROW][C]48[/C][C]0.141479[/C][C]1.7557[/C][C]0.040563[/C][/ROW]
[/TABLE]
Source: https://freestatistics.org/blog/index.php?pk=32461&T=1

Globally Unique Identifier (entire table): ba.freestatistics.org/blog/index.php?pk=32461&T=1

As an alternative you can also use a QR Code:  

The GUIDs for individual cells are displayed in the table below:

Autocorrelation Function
Time lag kACF(k)T-STATP-value
10.7406689.19150
20.5861077.27340
30.7202278.93780
40.9403211.66910
50.6992888.67790
60.5408026.71120
70.6718568.33750
80.88182110.94310
90.6510028.07870
100.4883256.060
110.6195527.68840
120.81894510.16280
130.5875457.29120
140.4293295.32780
150.5588636.93530
160.7429299.21950
170.5196436.44860
180.3686124.57445e-06
190.4867016.03980
200.6673748.28190
210.4498735.58280
220.2971233.68720.000157
230.4175715.18190
240.5895277.31580
250.3765064.67233e-06
260.2314642.87240.002324
270.3459224.29281.6e-05
280.5148746.38940
290.3058883.7960.000106
300.1635722.02990.022046
310.2742793.40370.000424
320.4346065.39330
330.2369762.94080.00189
340.0933121.1580.124335
350.2047752.54120.006018
360.3591124.45658e-06
370.1672332.07530.019811
380.0270020.33510.369007
390.1385721.71960.043754
400.2846523.53240.000272
410.0974481.20930.1142
42-0.035308-0.43820.330942
430.0705780.87580.191238
440.2106032.61350.004925
450.0315790.39190.347844
46-0.09492-1.17790.120321
470.0036620.04540.481906
480.1414791.75570.040563


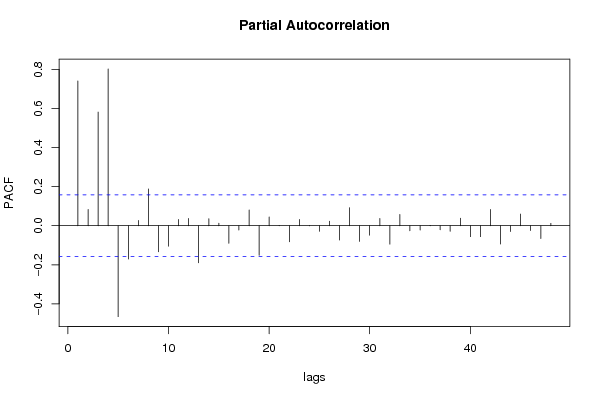
Partial Autocorrelation Function
Time lag kPACF(k)T-STATP-value
10.7406689.19150
20.0831111.03140.15199
30.5814017.2150
40.8022949.95620
5-0.465592-5.77780
6-0.170996-2.1220.017718
70.026560.32960.371073
80.1877382.32980.010558
9-0.133573-1.65760.049718
10-0.104886-1.30160.097498
110.0317880.39450.346884
120.0371380.46090.322769
13-0.189629-2.35320.009937
140.0358470.44490.328525
150.0124990.15510.438471
16-0.090094-1.1180.132647
17-0.022332-0.27710.391026
180.0806531.00090.159228
19-0.151601-1.88130.030908
200.0443020.54980.291636
210.0012580.01560.49378
22-0.082092-1.01870.154964
230.0322550.40030.344753
24-0.000723-0.0090.496428
25-0.028319-0.35140.362872
260.0230120.28560.387796
27-0.073773-0.91550.180681
280.0920751.14260.127484
29-0.080456-0.99840.159818
30-0.048432-0.6010.274352
310.0369610.45870.323558
32-0.094618-1.17420.121068
330.0579010.71850.23676
34-0.026163-0.32470.372935
35-0.022069-0.27390.392275
360.0019110.02370.490557
37-0.021109-0.2620.396854
38-0.028434-0.35290.362339
390.0382060.47410.318043
40-0.056008-0.6950.244038
41-0.056193-0.69730.24332
420.0834181.03520.1511
43-0.093634-1.1620.123522
44-0.030139-0.3740.354456
450.0593630.73670.231219
46-0.024916-0.30920.378795
47-0.065592-0.8140.208458
480.0119360.14810.441219

\begin{tabular}{lllllllll}
\hline
Partial Autocorrelation Function \tabularnewline
Time lag k & PACF(k) & T-STAT & P-value \tabularnewline
1 & 0.740668 & 9.1915 & 0 \tabularnewline
2 & 0.083111 & 1.0314 & 0.15199 \tabularnewline
3 & 0.581401 & 7.215 & 0 \tabularnewline
4 & 0.802294 & 9.9562 & 0 \tabularnewline
5 & -0.465592 & -5.7778 & 0 \tabularnewline
6 & -0.170996 & -2.122 & 0.017718 \tabularnewline
7 & 0.02656 & 0.3296 & 0.371073 \tabularnewline
8 & 0.187738 & 2.3298 & 0.010558 \tabularnewline
9 & -0.133573 & -1.6576 & 0.049718 \tabularnewline
10 & -0.104886 & -1.3016 & 0.097498 \tabularnewline
11 & 0.031788 & 0.3945 & 0.346884 \tabularnewline
12 & 0.037138 & 0.4609 & 0.322769 \tabularnewline
13 & -0.189629 & -2.3532 & 0.009937 \tabularnewline
14 & 0.035847 & 0.4449 & 0.328525 \tabularnewline
15 & 0.012499 & 0.1551 & 0.438471 \tabularnewline
16 & -0.090094 & -1.118 & 0.132647 \tabularnewline
17 & -0.022332 & -0.2771 & 0.391026 \tabularnewline
18 & 0.080653 & 1.0009 & 0.159228 \tabularnewline
19 & -0.151601 & -1.8813 & 0.030908 \tabularnewline
20 & 0.044302 & 0.5498 & 0.291636 \tabularnewline
21 & 0.001258 & 0.0156 & 0.49378 \tabularnewline
22 & -0.082092 & -1.0187 & 0.154964 \tabularnewline
23 & 0.032255 & 0.4003 & 0.344753 \tabularnewline
24 & -0.000723 & -0.009 & 0.496428 \tabularnewline
25 & -0.028319 & -0.3514 & 0.362872 \tabularnewline
26 & 0.023012 & 0.2856 & 0.387796 \tabularnewline
27 & -0.073773 & -0.9155 & 0.180681 \tabularnewline
28 & 0.092075 & 1.1426 & 0.127484 \tabularnewline
29 & -0.080456 & -0.9984 & 0.159818 \tabularnewline
30 & -0.048432 & -0.601 & 0.274352 \tabularnewline
31 & 0.036961 & 0.4587 & 0.323558 \tabularnewline
32 & -0.094618 & -1.1742 & 0.121068 \tabularnewline
33 & 0.057901 & 0.7185 & 0.23676 \tabularnewline
34 & -0.026163 & -0.3247 & 0.372935 \tabularnewline
35 & -0.022069 & -0.2739 & 0.392275 \tabularnewline
36 & 0.001911 & 0.0237 & 0.490557 \tabularnewline
37 & -0.021109 & -0.262 & 0.396854 \tabularnewline
38 & -0.028434 & -0.3529 & 0.362339 \tabularnewline
39 & 0.038206 & 0.4741 & 0.318043 \tabularnewline
40 & -0.056008 & -0.695 & 0.244038 \tabularnewline
41 & -0.056193 & -0.6973 & 0.24332 \tabularnewline
42 & 0.083418 & 1.0352 & 0.1511 \tabularnewline
43 & -0.093634 & -1.162 & 0.123522 \tabularnewline
44 & -0.030139 & -0.374 & 0.354456 \tabularnewline
45 & 0.059363 & 0.7367 & 0.231219 \tabularnewline
46 & -0.024916 & -0.3092 & 0.378795 \tabularnewline
47 & -0.065592 & -0.814 & 0.208458 \tabularnewline
48 & 0.011936 & 0.1481 & 0.441219 \tabularnewline
\hline
\end{tabular}
%Source: https://freestatistics.org/blog/index.php?pk=32461&T=2

[TABLE]
[ROW][C]Partial Autocorrelation Function[/C][/ROW]
[ROW][C]Time lag k[/C][C]PACF(k)[/C][C]T-STAT[/C][C]P-value[/C][/ROW]
[ROW][C]1[/C][C]0.740668[/C][C]9.1915[/C][C]0[/C][/ROW]
[ROW][C]2[/C][C]0.083111[/C][C]1.0314[/C][C]0.15199[/C][/ROW]
[ROW][C]3[/C][C]0.581401[/C][C]7.215[/C][C]0[/C][/ROW]
[ROW][C]4[/C][C]0.802294[/C][C]9.9562[/C][C]0[/C][/ROW]
[ROW][C]5[/C][C]-0.465592[/C][C]-5.7778[/C][C]0[/C][/ROW]
[ROW][C]6[/C][C]-0.170996[/C][C]-2.122[/C][C]0.017718[/C][/ROW]
[ROW][C]7[/C][C]0.02656[/C][C]0.3296[/C][C]0.371073[/C][/ROW]
[ROW][C]8[/C][C]0.187738[/C][C]2.3298[/C][C]0.010558[/C][/ROW]
[ROW][C]9[/C][C]-0.133573[/C][C]-1.6576[/C][C]0.049718[/C][/ROW]
[ROW][C]10[/C][C]-0.104886[/C][C]-1.3016[/C][C]0.097498[/C][/ROW]
[ROW][C]11[/C][C]0.031788[/C][C]0.3945[/C][C]0.346884[/C][/ROW]
[ROW][C]12[/C][C]0.037138[/C][C]0.4609[/C][C]0.322769[/C][/ROW]
[ROW][C]13[/C][C]-0.189629[/C][C]-2.3532[/C][C]0.009937[/C][/ROW]
[ROW][C]14[/C][C]0.035847[/C][C]0.4449[/C][C]0.328525[/C][/ROW]
[ROW][C]15[/C][C]0.012499[/C][C]0.1551[/C][C]0.438471[/C][/ROW]
[ROW][C]16[/C][C]-0.090094[/C][C]-1.118[/C][C]0.132647[/C][/ROW]
[ROW][C]17[/C][C]-0.022332[/C][C]-0.2771[/C][C]0.391026[/C][/ROW]
[ROW][C]18[/C][C]0.080653[/C][C]1.0009[/C][C]0.159228[/C][/ROW]
[ROW][C]19[/C][C]-0.151601[/C][C]-1.8813[/C][C]0.030908[/C][/ROW]
[ROW][C]20[/C][C]0.044302[/C][C]0.5498[/C][C]0.291636[/C][/ROW]
[ROW][C]21[/C][C]0.001258[/C][C]0.0156[/C][C]0.49378[/C][/ROW]
[ROW][C]22[/C][C]-0.082092[/C][C]-1.0187[/C][C]0.154964[/C][/ROW]
[ROW][C]23[/C][C]0.032255[/C][C]0.4003[/C][C]0.344753[/C][/ROW]
[ROW][C]24[/C][C]-0.000723[/C][C]-0.009[/C][C]0.496428[/C][/ROW]
[ROW][C]25[/C][C]-0.028319[/C][C]-0.3514[/C][C]0.362872[/C][/ROW]
[ROW][C]26[/C][C]0.023012[/C][C]0.2856[/C][C]0.387796[/C][/ROW]
[ROW][C]27[/C][C]-0.073773[/C][C]-0.9155[/C][C]0.180681[/C][/ROW]
[ROW][C]28[/C][C]0.092075[/C][C]1.1426[/C][C]0.127484[/C][/ROW]
[ROW][C]29[/C][C]-0.080456[/C][C]-0.9984[/C][C]0.159818[/C][/ROW]
[ROW][C]30[/C][C]-0.048432[/C][C]-0.601[/C][C]0.274352[/C][/ROW]
[ROW][C]31[/C][C]0.036961[/C][C]0.4587[/C][C]0.323558[/C][/ROW]
[ROW][C]32[/C][C]-0.094618[/C][C]-1.1742[/C][C]0.121068[/C][/ROW]
[ROW][C]33[/C][C]0.057901[/C][C]0.7185[/C][C]0.23676[/C][/ROW]
[ROW][C]34[/C][C]-0.026163[/C][C]-0.3247[/C][C]0.372935[/C][/ROW]
[ROW][C]35[/C][C]-0.022069[/C][C]-0.2739[/C][C]0.392275[/C][/ROW]
[ROW][C]36[/C][C]0.001911[/C][C]0.0237[/C][C]0.490557[/C][/ROW]
[ROW][C]37[/C][C]-0.021109[/C][C]-0.262[/C][C]0.396854[/C][/ROW]
[ROW][C]38[/C][C]-0.028434[/C][C]-0.3529[/C][C]0.362339[/C][/ROW]
[ROW][C]39[/C][C]0.038206[/C][C]0.4741[/C][C]0.318043[/C][/ROW]
[ROW][C]40[/C][C]-0.056008[/C][C]-0.695[/C][C]0.244038[/C][/ROW]
[ROW][C]41[/C][C]-0.056193[/C][C]-0.6973[/C][C]0.24332[/C][/ROW]
[ROW][C]42[/C][C]0.083418[/C][C]1.0352[/C][C]0.1511[/C][/ROW]
[ROW][C]43[/C][C]-0.093634[/C][C]-1.162[/C][C]0.123522[/C][/ROW]
[ROW][C]44[/C][C]-0.030139[/C][C]-0.374[/C][C]0.354456[/C][/ROW]
[ROW][C]45[/C][C]0.059363[/C][C]0.7367[/C][C]0.231219[/C][/ROW]
[ROW][C]46[/C][C]-0.024916[/C][C]-0.3092[/C][C]0.378795[/C][/ROW]
[ROW][C]47[/C][C]-0.065592[/C][C]-0.814[/C][C]0.208458[/C][/ROW]
[ROW][C]48[/C][C]0.011936[/C][C]0.1481[/C][C]0.441219[/C][/ROW]
[/TABLE]
Source: https://freestatistics.org/blog/index.php?pk=32461&T=2

Globally Unique Identifier (entire table): ba.freestatistics.org/blog/index.php?pk=32461&T=2

As an alternative you can also use a QR Code:  

The GUIDs for individual cells are displayed in the table below:

Partial Autocorrelation Function
Time lag kPACF(k)T-STATP-value
10.7406689.19150
20.0831111.03140.15199
30.5814017.2150
40.8022949.95620
5-0.465592-5.77780
6-0.170996-2.1220.017718
70.026560.32960.371073
80.1877382.32980.010558
9-0.133573-1.65760.049718
10-0.104886-1.30160.097498
110.0317880.39450.346884
120.0371380.46090.322769
13-0.189629-2.35320.009937
140.0358470.44490.328525
150.0124990.15510.438471
16-0.090094-1.1180.132647
17-0.022332-0.27710.391026
180.0806531.00090.159228
19-0.151601-1.88130.030908
200.0443020.54980.291636
210.0012580.01560.49378
22-0.082092-1.01870.154964
230.0322550.40030.344753
24-0.000723-0.0090.496428
25-0.028319-0.35140.362872
260.0230120.28560.387796
27-0.073773-0.91550.180681
280.0920751.14260.127484
29-0.080456-0.99840.159818
30-0.048432-0.6010.274352
310.0369610.45870.323558
32-0.094618-1.17420.121068
330.0579010.71850.23676
34-0.026163-0.32470.372935
35-0.022069-0.27390.392275
360.0019110.02370.490557
37-0.021109-0.2620.396854
38-0.028434-0.35290.362339
390.0382060.47410.318043
40-0.056008-0.6950.244038
41-0.056193-0.69730.24332
420.0834181.03520.1511
43-0.093634-1.1620.123522
44-0.030139-0.3740.354456
450.0593630.73670.231219
46-0.024916-0.30920.378795
47-0.065592-0.8140.208458
480.0119360.14810.441219


Parameters (Session):
par1 = 48 ; par2 = 1 ; par3 = 0 ; par4 = 0 ; par5 = 12 ;
Parameters (R input):
par1 = 48 ; par2 = 1 ; par3 = 0 ; par4 = 0 ; par5 = 12 ;
R code (references can be found in the software module):
if (par1 == 'Default') {
par1 = 10*log10(length(x))
} else {
par1 <- as.numeric(par1)
}
par2 <- as.numeric(par2)
par3 <- as.numeric(par3)
par4 <- as.numeric(par4)
par5 <- as.numeric(par5)
if (par2 == 0) {
x <- log(x)
} else {
x <- (x ^ par2 - 1) / par2
}
if (par3 > 0) x <- diff(x,lag=1,difference=par3)
if (par4 > 0) x <- diff(x,lag=par5,difference=par4)
bitmap(file='pic1.png')
racf <- acf(x,par1,main='Autocorrelation',xlab='lags',ylab='ACF')
dev.off()
bitmap(file='pic2.png')
rpacf <- pacf(x,par1,main='Partial Autocorrelation',xlab='lags',ylab='PACF')
dev.off()
(myacf <- c(racf$acf))
(mypacf <- c(rpacf$acf))
lengthx <- length(x)
sqrtn <- sqrt(lengthx)
load(file='createtable')
a<-table.start()
a<-table.row.start(a)
a<-table.element(a,'Autocorrelation Function',4,TRUE)
a<-table.row.end(a)
a<-table.row.start(a)
a<-table.element(a,'Time lag k',header=TRUE)
a<-table.element(a,hyperlink('basics.htm','ACF(k)','click here for more information about the Autocorrelation Function'),header=TRUE)
a<-table.element(a,'T-STAT',header=TRUE)
a<-table.element(a,'P-value',header=TRUE)
a<-table.row.end(a)
for (i in 2:(par1+1)) {
a<-table.row.start(a)
a<-table.element(a,i-1,header=TRUE)
a<-table.element(a,round(myacf[i],6))
mytstat <- myacf[i]*sqrtn
a<-table.element(a,round(mytstat,4))
a<-table.element(a,round(1-pt(abs(mytstat),lengthx),6))
a<-table.row.end(a)
}
a<-table.end(a)
table.save(a,file='mytable.tab')
a<-table.start()
a<-table.row.start(a)
a<-table.element(a,'Partial Autocorrelation Function',4,TRUE)
a<-table.row.end(a)
a<-table.row.start(a)
a<-table.element(a,'Time lag k',header=TRUE)
a<-table.element(a,hyperlink('basics.htm','PACF(k)','click here for more information about the Partial Autocorrelation Function'),header=TRUE)
a<-table.element(a,'T-STAT',header=TRUE)
a<-table.element(a,'P-value',header=TRUE)
a<-table.row.end(a)
for (i in 1:par1) {
a<-table.row.start(a)
a<-table.element(a,i,header=TRUE)
a<-table.element(a,round(mypacf[i],6))
mytstat <- mypacf[i]*sqrtn
a<-table.element(a,round(mytstat,4))
a<-table.element(a,round(1-pt(abs(mytstat),lengthx),6))
a<-table.row.end(a)
}
a<-table.end(a)
table.save(a,file='mytable1.tab')