Free Statistics

of Irreproducible Research!

Author's title

Author*Unverified author*
R Software Modulerwasp_autocorrelation.wasp
Title produced by software(Partial) Autocorrelation Function
Date of computationThu, 11 Dec 2008 15:20:06 -0700
Cite this page as followsStatistical Computations at FreeStatistics.org, Office for Research Development and Education, URL https://freestatistics.org/blog/index.php?v=date/2008/Dec/11/t1229034088x5ud8yi6095qzhc.htm/, Retrieved Sun, 19 May 2024 05:56:00 +0000
Statistical Computations at FreeStatistics.org, Office for Research Development and Education, URL https://freestatistics.org/blog/index.php?pk=32455, Retrieved Sun, 19 May 2024 05:56:00 +0000
QR Codes:

Original text written by user:
IsPrivate?No (this computation is public)
User-defined keywords
Estimated Impact182
Family? (F = Feedback message, R = changed R code, M = changed R Module, P = changed Parameters, D = changed Data)
-     [Harrell-Davis Quantiles] [Harrel davis deci...] [2008-10-18 16:19:32] [ea79f99c5895b39ae8bb6e8c563d0f54]
-   PD  [Harrell-Davis Quantiles] [Harrel davis deci...] [2008-10-18 17:17:36] [ea79f99c5895b39ae8bb6e8c563d0f54]
- RMPD    [(Partial) Autocorrelation Function] [OEF 2 deel 1 De L...] [2008-12-11 08:24:21] [ea79f99c5895b39ae8bb6e8c563d0f54]
-   P         [(Partial) Autocorrelation Function] [0ef2 6bis AUTOCOR...] [2008-12-11 22:20:06] [d41d8cd98f00b204e9800998ecf8427e] [Current]
Feedback Forum

Post a new message
Dataseries X:
102.9
102.9
102.9
102.9
104.2
104.7
104.7
104.7
104.7
104.7
104.7
104.7
104.7
104.7
104.7
104.7
106
107
107
107
107
107
107
107
107
107
107
107
107.6
109.9
109.9
109.9
109.9
109.9
109.9
109.9
109.9
109.9
109.9
109.9
110.6
114.3
114.3
114.3
114.3
114.3
114.3
114.3
114.3
114.3
114.3
114.3
114.3
119.01
119.01
119.01
119.01
119.01
119.01
119.01
119.01
119.01
119.01
119.01
121.27
123.54
123.54
123.54
123.54
123.54
123.54
123.54
123.54
123.54
123.54
123.54
123.54
125.24
125.24
125.24
125.24
125.24
125.24
125.24
125.24
125.24
125.24
125.24
125.24
128.35
128.35
128.35
128.35
128.35
128.35
128.35


Summary of computational transaction
Raw Inputview raw input (R code)
Raw Outputview raw output of R engine
Computing time3 seconds
R Server'Sir Ronald Aylmer Fisher' @ 193.190.124.24

\begin{tabular}{lllllllll}
\hline
Summary of computational transaction \tabularnewline
Raw Input & view raw input (R code)  \tabularnewline
Raw Output & view raw output of R engine  \tabularnewline
Computing time & 3 seconds \tabularnewline
R Server & 'Sir Ronald Aylmer Fisher' @ 193.190.124.24 \tabularnewline
\hline
\end{tabular}
%Source: https://freestatistics.org/blog/index.php?pk=32455&T=0

[TABLE]
[ROW][C]Summary of computational transaction[/C][/ROW]
[ROW][C]Raw Input[/C][C]view raw input (R code) [/C][/ROW]
[ROW][C]Raw Output[/C][C]view raw output of R engine [/C][/ROW]
[ROW][C]Computing time[/C][C]3 seconds[/C][/ROW]
[ROW][C]R Server[/C][C]'Sir Ronald Aylmer Fisher' @ 193.190.124.24[/C][/ROW]
[/TABLE]
Source: https://freestatistics.org/blog/index.php?pk=32455&T=0

Globally Unique Identifier (entire table): ba.freestatistics.org/blog/index.php?pk=32455&T=0

As an alternative you can also use a QR Code:  

The GUIDs for individual cells are displayed in the table below:

Summary of computational transaction
Raw Inputview raw input (R code)
Raw Outputview raw output of R engine
Computing time3 seconds
R Server'Sir Ronald Aylmer Fisher' @ 193.190.124.24


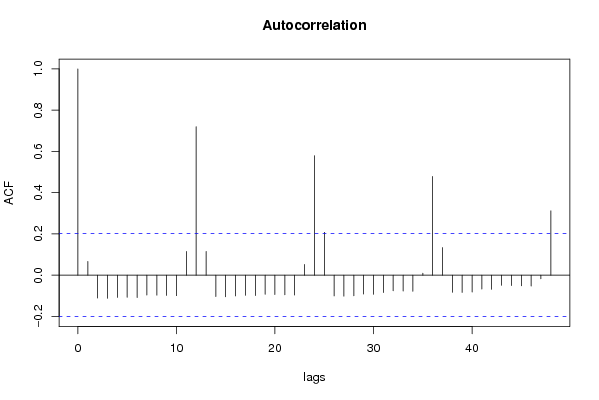
Autocorrelation Function
Time lag kACF(k)T-STATP-value
10.066410.64730.259504
2-0.111119-1.08310.140763
3-0.112264-1.09420.138313
4-0.107851-1.05120.147917
5-0.106858-1.04150.150137
6-0.108004-1.05270.147576
7-0.095851-0.93420.176275
8-0.096996-0.94540.173426
9-0.098142-0.95660.170607
10-0.099287-0.96770.167817
110.1151281.12210.132319
120.7199017.01670
130.1151411.12230.13229
14-0.10387-1.01240.15696
15-0.105015-1.02360.154321
16-0.100602-0.98050.164654
17-0.097471-0.950.172254
18-0.098617-0.96120.169447
19-0.092493-0.90150.184799
20-0.093638-0.91270.181862
21-0.094784-0.92380.178955
22-0.095929-0.9350.176078
230.0523610.51040.305494
240.5788995.64240
250.20782.02540.022817
26-0.100512-0.97970.164869
27-0.101657-0.99080.162142
28-0.100237-0.9770.165528
29-0.091548-0.89230.187245
30-0.092693-0.90350.184283
31-0.084132-0.820.20713
32-0.075613-0.7370.231473
33-0.076759-0.74820.228108
34-0.077904-0.75930.224771
350.0095070.09270.463183
360.4782374.66135e-06
370.1339061.30520.097496
38-0.082487-0.8040.211708
39-0.083632-0.81510.208514
40-0.081784-0.79710.21368
41-0.067108-0.65410.257317
42-0.068254-0.66530.253749
43-0.049259-0.48010.316124
44-0.050404-0.49130.31218
45-0.05155-0.50240.308258
46-0.052696-0.51360.304358
47-0.017767-0.17320.431443
480.311823.03920.001532

\begin{tabular}{lllllllll}
\hline
Autocorrelation Function \tabularnewline
Time lag k & ACF(k) & T-STAT & P-value \tabularnewline
1 & 0.06641 & 0.6473 & 0.259504 \tabularnewline
2 & -0.111119 & -1.0831 & 0.140763 \tabularnewline
3 & -0.112264 & -1.0942 & 0.138313 \tabularnewline
4 & -0.107851 & -1.0512 & 0.147917 \tabularnewline
5 & -0.106858 & -1.0415 & 0.150137 \tabularnewline
6 & -0.108004 & -1.0527 & 0.147576 \tabularnewline
7 & -0.095851 & -0.9342 & 0.176275 \tabularnewline
8 & -0.096996 & -0.9454 & 0.173426 \tabularnewline
9 & -0.098142 & -0.9566 & 0.170607 \tabularnewline
10 & -0.099287 & -0.9677 & 0.167817 \tabularnewline
11 & 0.115128 & 1.1221 & 0.132319 \tabularnewline
12 & 0.719901 & 7.0167 & 0 \tabularnewline
13 & 0.115141 & 1.1223 & 0.13229 \tabularnewline
14 & -0.10387 & -1.0124 & 0.15696 \tabularnewline
15 & -0.105015 & -1.0236 & 0.154321 \tabularnewline
16 & -0.100602 & -0.9805 & 0.164654 \tabularnewline
17 & -0.097471 & -0.95 & 0.172254 \tabularnewline
18 & -0.098617 & -0.9612 & 0.169447 \tabularnewline
19 & -0.092493 & -0.9015 & 0.184799 \tabularnewline
20 & -0.093638 & -0.9127 & 0.181862 \tabularnewline
21 & -0.094784 & -0.9238 & 0.178955 \tabularnewline
22 & -0.095929 & -0.935 & 0.176078 \tabularnewline
23 & 0.052361 & 0.5104 & 0.305494 \tabularnewline
24 & 0.578899 & 5.6424 & 0 \tabularnewline
25 & 0.2078 & 2.0254 & 0.022817 \tabularnewline
26 & -0.100512 & -0.9797 & 0.164869 \tabularnewline
27 & -0.101657 & -0.9908 & 0.162142 \tabularnewline
28 & -0.100237 & -0.977 & 0.165528 \tabularnewline
29 & -0.091548 & -0.8923 & 0.187245 \tabularnewline
30 & -0.092693 & -0.9035 & 0.184283 \tabularnewline
31 & -0.084132 & -0.82 & 0.20713 \tabularnewline
32 & -0.075613 & -0.737 & 0.231473 \tabularnewline
33 & -0.076759 & -0.7482 & 0.228108 \tabularnewline
34 & -0.077904 & -0.7593 & 0.224771 \tabularnewline
35 & 0.009507 & 0.0927 & 0.463183 \tabularnewline
36 & 0.478237 & 4.6613 & 5e-06 \tabularnewline
37 & 0.133906 & 1.3052 & 0.097496 \tabularnewline
38 & -0.082487 & -0.804 & 0.211708 \tabularnewline
39 & -0.083632 & -0.8151 & 0.208514 \tabularnewline
40 & -0.081784 & -0.7971 & 0.21368 \tabularnewline
41 & -0.067108 & -0.6541 & 0.257317 \tabularnewline
42 & -0.068254 & -0.6653 & 0.253749 \tabularnewline
43 & -0.049259 & -0.4801 & 0.316124 \tabularnewline
44 & -0.050404 & -0.4913 & 0.31218 \tabularnewline
45 & -0.05155 & -0.5024 & 0.308258 \tabularnewline
46 & -0.052696 & -0.5136 & 0.304358 \tabularnewline
47 & -0.017767 & -0.1732 & 0.431443 \tabularnewline
48 & 0.31182 & 3.0392 & 0.001532 \tabularnewline
\hline
\end{tabular}
%Source: https://freestatistics.org/blog/index.php?pk=32455&T=1

[TABLE]
[ROW][C]Autocorrelation Function[/C][/ROW]
[ROW][C]Time lag k[/C][C]ACF(k)[/C][C]T-STAT[/C][C]P-value[/C][/ROW]
[ROW][C]1[/C][C]0.06641[/C][C]0.6473[/C][C]0.259504[/C][/ROW]
[ROW][C]2[/C][C]-0.111119[/C][C]-1.0831[/C][C]0.140763[/C][/ROW]
[ROW][C]3[/C][C]-0.112264[/C][C]-1.0942[/C][C]0.138313[/C][/ROW]
[ROW][C]4[/C][C]-0.107851[/C][C]-1.0512[/C][C]0.147917[/C][/ROW]
[ROW][C]5[/C][C]-0.106858[/C][C]-1.0415[/C][C]0.150137[/C][/ROW]
[ROW][C]6[/C][C]-0.108004[/C][C]-1.0527[/C][C]0.147576[/C][/ROW]
[ROW][C]7[/C][C]-0.095851[/C][C]-0.9342[/C][C]0.176275[/C][/ROW]
[ROW][C]8[/C][C]-0.096996[/C][C]-0.9454[/C][C]0.173426[/C][/ROW]
[ROW][C]9[/C][C]-0.098142[/C][C]-0.9566[/C][C]0.170607[/C][/ROW]
[ROW][C]10[/C][C]-0.099287[/C][C]-0.9677[/C][C]0.167817[/C][/ROW]
[ROW][C]11[/C][C]0.115128[/C][C]1.1221[/C][C]0.132319[/C][/ROW]
[ROW][C]12[/C][C]0.719901[/C][C]7.0167[/C][C]0[/C][/ROW]
[ROW][C]13[/C][C]0.115141[/C][C]1.1223[/C][C]0.13229[/C][/ROW]
[ROW][C]14[/C][C]-0.10387[/C][C]-1.0124[/C][C]0.15696[/C][/ROW]
[ROW][C]15[/C][C]-0.105015[/C][C]-1.0236[/C][C]0.154321[/C][/ROW]
[ROW][C]16[/C][C]-0.100602[/C][C]-0.9805[/C][C]0.164654[/C][/ROW]
[ROW][C]17[/C][C]-0.097471[/C][C]-0.95[/C][C]0.172254[/C][/ROW]
[ROW][C]18[/C][C]-0.098617[/C][C]-0.9612[/C][C]0.169447[/C][/ROW]
[ROW][C]19[/C][C]-0.092493[/C][C]-0.9015[/C][C]0.184799[/C][/ROW]
[ROW][C]20[/C][C]-0.093638[/C][C]-0.9127[/C][C]0.181862[/C][/ROW]
[ROW][C]21[/C][C]-0.094784[/C][C]-0.9238[/C][C]0.178955[/C][/ROW]
[ROW][C]22[/C][C]-0.095929[/C][C]-0.935[/C][C]0.176078[/C][/ROW]
[ROW][C]23[/C][C]0.052361[/C][C]0.5104[/C][C]0.305494[/C][/ROW]
[ROW][C]24[/C][C]0.578899[/C][C]5.6424[/C][C]0[/C][/ROW]
[ROW][C]25[/C][C]0.2078[/C][C]2.0254[/C][C]0.022817[/C][/ROW]
[ROW][C]26[/C][C]-0.100512[/C][C]-0.9797[/C][C]0.164869[/C][/ROW]
[ROW][C]27[/C][C]-0.101657[/C][C]-0.9908[/C][C]0.162142[/C][/ROW]
[ROW][C]28[/C][C]-0.100237[/C][C]-0.977[/C][C]0.165528[/C][/ROW]
[ROW][C]29[/C][C]-0.091548[/C][C]-0.8923[/C][C]0.187245[/C][/ROW]
[ROW][C]30[/C][C]-0.092693[/C][C]-0.9035[/C][C]0.184283[/C][/ROW]
[ROW][C]31[/C][C]-0.084132[/C][C]-0.82[/C][C]0.20713[/C][/ROW]
[ROW][C]32[/C][C]-0.075613[/C][C]-0.737[/C][C]0.231473[/C][/ROW]
[ROW][C]33[/C][C]-0.076759[/C][C]-0.7482[/C][C]0.228108[/C][/ROW]
[ROW][C]34[/C][C]-0.077904[/C][C]-0.7593[/C][C]0.224771[/C][/ROW]
[ROW][C]35[/C][C]0.009507[/C][C]0.0927[/C][C]0.463183[/C][/ROW]
[ROW][C]36[/C][C]0.478237[/C][C]4.6613[/C][C]5e-06[/C][/ROW]
[ROW][C]37[/C][C]0.133906[/C][C]1.3052[/C][C]0.097496[/C][/ROW]
[ROW][C]38[/C][C]-0.082487[/C][C]-0.804[/C][C]0.211708[/C][/ROW]
[ROW][C]39[/C][C]-0.083632[/C][C]-0.8151[/C][C]0.208514[/C][/ROW]
[ROW][C]40[/C][C]-0.081784[/C][C]-0.7971[/C][C]0.21368[/C][/ROW]
[ROW][C]41[/C][C]-0.067108[/C][C]-0.6541[/C][C]0.257317[/C][/ROW]
[ROW][C]42[/C][C]-0.068254[/C][C]-0.6653[/C][C]0.253749[/C][/ROW]
[ROW][C]43[/C][C]-0.049259[/C][C]-0.4801[/C][C]0.316124[/C][/ROW]
[ROW][C]44[/C][C]-0.050404[/C][C]-0.4913[/C][C]0.31218[/C][/ROW]
[ROW][C]45[/C][C]-0.05155[/C][C]-0.5024[/C][C]0.308258[/C][/ROW]
[ROW][C]46[/C][C]-0.052696[/C][C]-0.5136[/C][C]0.304358[/C][/ROW]
[ROW][C]47[/C][C]-0.017767[/C][C]-0.1732[/C][C]0.431443[/C][/ROW]
[ROW][C]48[/C][C]0.31182[/C][C]3.0392[/C][C]0.001532[/C][/ROW]
[/TABLE]
Source: https://freestatistics.org/blog/index.php?pk=32455&T=1

Globally Unique Identifier (entire table): ba.freestatistics.org/blog/index.php?pk=32455&T=1

As an alternative you can also use a QR Code:  

The GUIDs for individual cells are displayed in the table below:

Autocorrelation Function
Time lag kACF(k)T-STATP-value
10.066410.64730.259504
2-0.111119-1.08310.140763
3-0.112264-1.09420.138313
4-0.107851-1.05120.147917
5-0.106858-1.04150.150137
6-0.108004-1.05270.147576
7-0.095851-0.93420.176275
8-0.096996-0.94540.173426
9-0.098142-0.95660.170607
10-0.099287-0.96770.167817
110.1151281.12210.132319
120.7199017.01670
130.1151411.12230.13229
14-0.10387-1.01240.15696
15-0.105015-1.02360.154321
16-0.100602-0.98050.164654
17-0.097471-0.950.172254
18-0.098617-0.96120.169447
19-0.092493-0.90150.184799
20-0.093638-0.91270.181862
21-0.094784-0.92380.178955
22-0.095929-0.9350.176078
230.0523610.51040.305494
240.5788995.64240
250.20782.02540.022817
26-0.100512-0.97970.164869
27-0.101657-0.99080.162142
28-0.100237-0.9770.165528
29-0.091548-0.89230.187245
30-0.092693-0.90350.184283
31-0.084132-0.820.20713
32-0.075613-0.7370.231473
33-0.076759-0.74820.228108
34-0.077904-0.75930.224771
350.0095070.09270.463183
360.4782374.66135e-06
370.1339061.30520.097496
38-0.082487-0.8040.211708
39-0.083632-0.81510.208514
40-0.081784-0.79710.21368
41-0.067108-0.65410.257317
42-0.068254-0.66530.253749
43-0.049259-0.48010.316124
44-0.050404-0.49130.31218
45-0.05155-0.50240.308258
46-0.052696-0.51360.304358
47-0.017767-0.17320.431443
480.311823.03920.001532


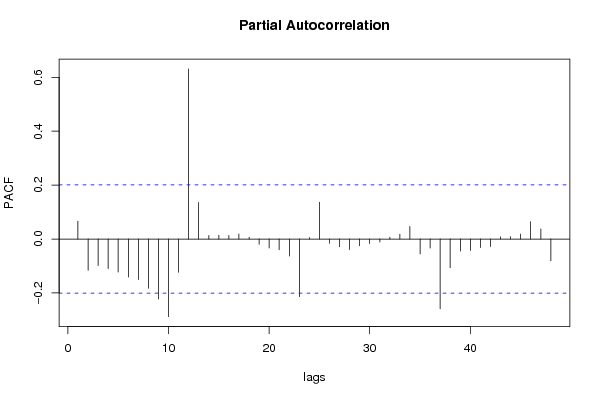
Partial Autocorrelation Function
Time lag kPACF(k)T-STATP-value
10.066410.64730.259504
2-0.116041-1.1310.130446
3-0.09807-0.95590.170784
4-0.109363-1.06590.144576
5-0.12243-1.19330.117862
6-0.140813-1.37250.086573
7-0.15035-1.46540.073052
8-0.182517-1.7790.039223
9-0.22293-2.17280.01614
10-0.288034-2.80740.00303
11-0.123495-1.20370.115853
120.6310776.1510
130.1355561.32120.094797
140.0134040.13060.448167
150.0138850.13530.446318
160.0130760.12740.449428
170.0190820.1860.426427
180.0070130.06840.472823
19-0.019824-0.19320.4236
20-0.033393-0.32550.37277
21-0.040246-0.39230.347868
22-0.063293-0.61690.269388
23-0.21382-2.08410.01992
240.0058080.05660.477487
250.1366021.33140.093117
26-0.015936-0.15530.438446
27-0.028447-0.27730.391087
28-0.03913-0.38140.35188
29-0.024832-0.2420.404637
30-0.016581-0.16160.435977
31-0.011102-0.10820.457031
320.0069780.0680.472959
330.0180970.17640.430184
340.0464880.45310.325752
35-0.055161-0.53760.29604
36-0.033253-0.32410.373282
37-0.258722-2.52170.006671
38-0.106855-1.04150.150146
39-0.044786-0.43650.331725
40-0.042571-0.41490.339565
41-0.031771-0.30970.378747
42-0.02801-0.2730.39272
430.0080490.07850.468817
440.0090390.08810.464992
450.0182660.1780.429538
460.064280.62650.266236
470.0373120.36370.358454
48-0.080716-0.78670.216703

\begin{tabular}{lllllllll}
\hline
Partial Autocorrelation Function \tabularnewline
Time lag k & PACF(k) & T-STAT & P-value \tabularnewline
1 & 0.06641 & 0.6473 & 0.259504 \tabularnewline
2 & -0.116041 & -1.131 & 0.130446 \tabularnewline
3 & -0.09807 & -0.9559 & 0.170784 \tabularnewline
4 & -0.109363 & -1.0659 & 0.144576 \tabularnewline
5 & -0.12243 & -1.1933 & 0.117862 \tabularnewline
6 & -0.140813 & -1.3725 & 0.086573 \tabularnewline
7 & -0.15035 & -1.4654 & 0.073052 \tabularnewline
8 & -0.182517 & -1.779 & 0.039223 \tabularnewline
9 & -0.22293 & -2.1728 & 0.01614 \tabularnewline
10 & -0.288034 & -2.8074 & 0.00303 \tabularnewline
11 & -0.123495 & -1.2037 & 0.115853 \tabularnewline
12 & 0.631077 & 6.151 & 0 \tabularnewline
13 & 0.135556 & 1.3212 & 0.094797 \tabularnewline
14 & 0.013404 & 0.1306 & 0.448167 \tabularnewline
15 & 0.013885 & 0.1353 & 0.446318 \tabularnewline
16 & 0.013076 & 0.1274 & 0.449428 \tabularnewline
17 & 0.019082 & 0.186 & 0.426427 \tabularnewline
18 & 0.007013 & 0.0684 & 0.472823 \tabularnewline
19 & -0.019824 & -0.1932 & 0.4236 \tabularnewline
20 & -0.033393 & -0.3255 & 0.37277 \tabularnewline
21 & -0.040246 & -0.3923 & 0.347868 \tabularnewline
22 & -0.063293 & -0.6169 & 0.269388 \tabularnewline
23 & -0.21382 & -2.0841 & 0.01992 \tabularnewline
24 & 0.005808 & 0.0566 & 0.477487 \tabularnewline
25 & 0.136602 & 1.3314 & 0.093117 \tabularnewline
26 & -0.015936 & -0.1553 & 0.438446 \tabularnewline
27 & -0.028447 & -0.2773 & 0.391087 \tabularnewline
28 & -0.03913 & -0.3814 & 0.35188 \tabularnewline
29 & -0.024832 & -0.242 & 0.404637 \tabularnewline
30 & -0.016581 & -0.1616 & 0.435977 \tabularnewline
31 & -0.011102 & -0.1082 & 0.457031 \tabularnewline
32 & 0.006978 & 0.068 & 0.472959 \tabularnewline
33 & 0.018097 & 0.1764 & 0.430184 \tabularnewline
34 & 0.046488 & 0.4531 & 0.325752 \tabularnewline
35 & -0.055161 & -0.5376 & 0.29604 \tabularnewline
36 & -0.033253 & -0.3241 & 0.373282 \tabularnewline
37 & -0.258722 & -2.5217 & 0.006671 \tabularnewline
38 & -0.106855 & -1.0415 & 0.150146 \tabularnewline
39 & -0.044786 & -0.4365 & 0.331725 \tabularnewline
40 & -0.042571 & -0.4149 & 0.339565 \tabularnewline
41 & -0.031771 & -0.3097 & 0.378747 \tabularnewline
42 & -0.02801 & -0.273 & 0.39272 \tabularnewline
43 & 0.008049 & 0.0785 & 0.468817 \tabularnewline
44 & 0.009039 & 0.0881 & 0.464992 \tabularnewline
45 & 0.018266 & 0.178 & 0.429538 \tabularnewline
46 & 0.06428 & 0.6265 & 0.266236 \tabularnewline
47 & 0.037312 & 0.3637 & 0.358454 \tabularnewline
48 & -0.080716 & -0.7867 & 0.216703 \tabularnewline
\hline
\end{tabular}
%Source: https://freestatistics.org/blog/index.php?pk=32455&T=2

[TABLE]
[ROW][C]Partial Autocorrelation Function[/C][/ROW]
[ROW][C]Time lag k[/C][C]PACF(k)[/C][C]T-STAT[/C][C]P-value[/C][/ROW]
[ROW][C]1[/C][C]0.06641[/C][C]0.6473[/C][C]0.259504[/C][/ROW]
[ROW][C]2[/C][C]-0.116041[/C][C]-1.131[/C][C]0.130446[/C][/ROW]
[ROW][C]3[/C][C]-0.09807[/C][C]-0.9559[/C][C]0.170784[/C][/ROW]
[ROW][C]4[/C][C]-0.109363[/C][C]-1.0659[/C][C]0.144576[/C][/ROW]
[ROW][C]5[/C][C]-0.12243[/C][C]-1.1933[/C][C]0.117862[/C][/ROW]
[ROW][C]6[/C][C]-0.140813[/C][C]-1.3725[/C][C]0.086573[/C][/ROW]
[ROW][C]7[/C][C]-0.15035[/C][C]-1.4654[/C][C]0.073052[/C][/ROW]
[ROW][C]8[/C][C]-0.182517[/C][C]-1.779[/C][C]0.039223[/C][/ROW]
[ROW][C]9[/C][C]-0.22293[/C][C]-2.1728[/C][C]0.01614[/C][/ROW]
[ROW][C]10[/C][C]-0.288034[/C][C]-2.8074[/C][C]0.00303[/C][/ROW]
[ROW][C]11[/C][C]-0.123495[/C][C]-1.2037[/C][C]0.115853[/C][/ROW]
[ROW][C]12[/C][C]0.631077[/C][C]6.151[/C][C]0[/C][/ROW]
[ROW][C]13[/C][C]0.135556[/C][C]1.3212[/C][C]0.094797[/C][/ROW]
[ROW][C]14[/C][C]0.013404[/C][C]0.1306[/C][C]0.448167[/C][/ROW]
[ROW][C]15[/C][C]0.013885[/C][C]0.1353[/C][C]0.446318[/C][/ROW]
[ROW][C]16[/C][C]0.013076[/C][C]0.1274[/C][C]0.449428[/C][/ROW]
[ROW][C]17[/C][C]0.019082[/C][C]0.186[/C][C]0.426427[/C][/ROW]
[ROW][C]18[/C][C]0.007013[/C][C]0.0684[/C][C]0.472823[/C][/ROW]
[ROW][C]19[/C][C]-0.019824[/C][C]-0.1932[/C][C]0.4236[/C][/ROW]
[ROW][C]20[/C][C]-0.033393[/C][C]-0.3255[/C][C]0.37277[/C][/ROW]
[ROW][C]21[/C][C]-0.040246[/C][C]-0.3923[/C][C]0.347868[/C][/ROW]
[ROW][C]22[/C][C]-0.063293[/C][C]-0.6169[/C][C]0.269388[/C][/ROW]
[ROW][C]23[/C][C]-0.21382[/C][C]-2.0841[/C][C]0.01992[/C][/ROW]
[ROW][C]24[/C][C]0.005808[/C][C]0.0566[/C][C]0.477487[/C][/ROW]
[ROW][C]25[/C][C]0.136602[/C][C]1.3314[/C][C]0.093117[/C][/ROW]
[ROW][C]26[/C][C]-0.015936[/C][C]-0.1553[/C][C]0.438446[/C][/ROW]
[ROW][C]27[/C][C]-0.028447[/C][C]-0.2773[/C][C]0.391087[/C][/ROW]
[ROW][C]28[/C][C]-0.03913[/C][C]-0.3814[/C][C]0.35188[/C][/ROW]
[ROW][C]29[/C][C]-0.024832[/C][C]-0.242[/C][C]0.404637[/C][/ROW]
[ROW][C]30[/C][C]-0.016581[/C][C]-0.1616[/C][C]0.435977[/C][/ROW]
[ROW][C]31[/C][C]-0.011102[/C][C]-0.1082[/C][C]0.457031[/C][/ROW]
[ROW][C]32[/C][C]0.006978[/C][C]0.068[/C][C]0.472959[/C][/ROW]
[ROW][C]33[/C][C]0.018097[/C][C]0.1764[/C][C]0.430184[/C][/ROW]
[ROW][C]34[/C][C]0.046488[/C][C]0.4531[/C][C]0.325752[/C][/ROW]
[ROW][C]35[/C][C]-0.055161[/C][C]-0.5376[/C][C]0.29604[/C][/ROW]
[ROW][C]36[/C][C]-0.033253[/C][C]-0.3241[/C][C]0.373282[/C][/ROW]
[ROW][C]37[/C][C]-0.258722[/C][C]-2.5217[/C][C]0.006671[/C][/ROW]
[ROW][C]38[/C][C]-0.106855[/C][C]-1.0415[/C][C]0.150146[/C][/ROW]
[ROW][C]39[/C][C]-0.044786[/C][C]-0.4365[/C][C]0.331725[/C][/ROW]
[ROW][C]40[/C][C]-0.042571[/C][C]-0.4149[/C][C]0.339565[/C][/ROW]
[ROW][C]41[/C][C]-0.031771[/C][C]-0.3097[/C][C]0.378747[/C][/ROW]
[ROW][C]42[/C][C]-0.02801[/C][C]-0.273[/C][C]0.39272[/C][/ROW]
[ROW][C]43[/C][C]0.008049[/C][C]0.0785[/C][C]0.468817[/C][/ROW]
[ROW][C]44[/C][C]0.009039[/C][C]0.0881[/C][C]0.464992[/C][/ROW]
[ROW][C]45[/C][C]0.018266[/C][C]0.178[/C][C]0.429538[/C][/ROW]
[ROW][C]46[/C][C]0.06428[/C][C]0.6265[/C][C]0.266236[/C][/ROW]
[ROW][C]47[/C][C]0.037312[/C][C]0.3637[/C][C]0.358454[/C][/ROW]
[ROW][C]48[/C][C]-0.080716[/C][C]-0.7867[/C][C]0.216703[/C][/ROW]
[/TABLE]
Source: https://freestatistics.org/blog/index.php?pk=32455&T=2

Globally Unique Identifier (entire table): ba.freestatistics.org/blog/index.php?pk=32455&T=2

As an alternative you can also use a QR Code:  

The GUIDs for individual cells are displayed in the table below:

Partial Autocorrelation Function
Time lag kPACF(k)T-STATP-value
10.066410.64730.259504
2-0.116041-1.1310.130446
3-0.09807-0.95590.170784
4-0.109363-1.06590.144576
5-0.12243-1.19330.117862
6-0.140813-1.37250.086573
7-0.15035-1.46540.073052
8-0.182517-1.7790.039223
9-0.22293-2.17280.01614
10-0.288034-2.80740.00303
11-0.123495-1.20370.115853
120.6310776.1510
130.1355561.32120.094797
140.0134040.13060.448167
150.0138850.13530.446318
160.0130760.12740.449428
170.0190820.1860.426427
180.0070130.06840.472823
19-0.019824-0.19320.4236
20-0.033393-0.32550.37277
21-0.040246-0.39230.347868
22-0.063293-0.61690.269388
23-0.21382-2.08410.01992
240.0058080.05660.477487
250.1366021.33140.093117
26-0.015936-0.15530.438446
27-0.028447-0.27730.391087
28-0.03913-0.38140.35188
29-0.024832-0.2420.404637
30-0.016581-0.16160.435977
31-0.011102-0.10820.457031
320.0069780.0680.472959
330.0180970.17640.430184
340.0464880.45310.325752
35-0.055161-0.53760.29604
36-0.033253-0.32410.373282
37-0.258722-2.52170.006671
38-0.106855-1.04150.150146
39-0.044786-0.43650.331725
40-0.042571-0.41490.339565
41-0.031771-0.30970.378747
42-0.02801-0.2730.39272
430.0080490.07850.468817
440.0090390.08810.464992
450.0182660.1780.429538
460.064280.62650.266236
470.0373120.36370.358454
48-0.080716-0.78670.216703


Parameters (Session):
par1 = 48 ; par2 = 1 ; par3 = 1 ; par4 = 0 ; par5 = 12 ;
Parameters (R input):
par1 = 48 ; par2 = 1 ; par3 = 1 ; par4 = 0 ; par5 = 12 ;
R code (references can be found in the software module):
if (par1 == 'Default') {
par1 = 10*log10(length(x))
} else {
par1 <- as.numeric(par1)
}
par2 <- as.numeric(par2)
par3 <- as.numeric(par3)
par4 <- as.numeric(par4)
par5 <- as.numeric(par5)
if (par2 == 0) {
x <- log(x)
} else {
x <- (x ^ par2 - 1) / par2
}
if (par3 > 0) x <- diff(x,lag=1,difference=par3)
if (par4 > 0) x <- diff(x,lag=par5,difference=par4)
bitmap(file='pic1.png')
racf <- acf(x,par1,main='Autocorrelation',xlab='lags',ylab='ACF')
dev.off()
bitmap(file='pic2.png')
rpacf <- pacf(x,par1,main='Partial Autocorrelation',xlab='lags',ylab='PACF')
dev.off()
(myacf <- c(racf$acf))
(mypacf <- c(rpacf$acf))
lengthx <- length(x)
sqrtn <- sqrt(lengthx)
load(file='createtable')
a<-table.start()
a<-table.row.start(a)
a<-table.element(a,'Autocorrelation Function',4,TRUE)
a<-table.row.end(a)
a<-table.row.start(a)
a<-table.element(a,'Time lag k',header=TRUE)
a<-table.element(a,hyperlink('basics.htm','ACF(k)','click here for more information about the Autocorrelation Function'),header=TRUE)
a<-table.element(a,'T-STAT',header=TRUE)
a<-table.element(a,'P-value',header=TRUE)
a<-table.row.end(a)
for (i in 2:(par1+1)) {
a<-table.row.start(a)
a<-table.element(a,i-1,header=TRUE)
a<-table.element(a,round(myacf[i],6))
mytstat <- myacf[i]*sqrtn
a<-table.element(a,round(mytstat,4))
a<-table.element(a,round(1-pt(abs(mytstat),lengthx),6))
a<-table.row.end(a)
}
a<-table.end(a)
table.save(a,file='mytable.tab')
a<-table.start()
a<-table.row.start(a)
a<-table.element(a,'Partial Autocorrelation Function',4,TRUE)
a<-table.row.end(a)
a<-table.row.start(a)
a<-table.element(a,'Time lag k',header=TRUE)
a<-table.element(a,hyperlink('basics.htm','PACF(k)','click here for more information about the Partial Autocorrelation Function'),header=TRUE)
a<-table.element(a,'T-STAT',header=TRUE)
a<-table.element(a,'P-value',header=TRUE)
a<-table.row.end(a)
for (i in 1:par1) {
a<-table.row.start(a)
a<-table.element(a,i,header=TRUE)
a<-table.element(a,round(mypacf[i],6))
mytstat <- mypacf[i]*sqrtn
a<-table.element(a,round(mytstat,4))
a<-table.element(a,round(1-pt(abs(mytstat),lengthx),6))
a<-table.row.end(a)
}
a<-table.end(a)
table.save(a,file='mytable1.tab')