Free Statistics

of Irreproducible Research!

Author's title

Author*The author of this computation has been verified*
R Software Modulerwasp_arimaforecasting.wasp
Title produced by softwareARIMA Forecasting
Date of computationThu, 11 Dec 2008 11:38:00 -0700
Cite this page as followsStatistical Computations at FreeStatistics.org, Office for Research Development and Education, URL https://freestatistics.org/blog/index.php?v=date/2008/Dec/11/t12290207447xgqu06588fw4pg.htm/, Retrieved Sun, 19 May 2024 07:44:39 +0000
Statistical Computations at FreeStatistics.org, Office for Research Development and Education, URL https://freestatistics.org/blog/index.php?pk=32429, Retrieved Sun, 19 May 2024 07:44:39 +0000
QR Codes:

Original text written by user:
IsPrivate?No (this computation is public)
User-defined keywords
Estimated Impact190
Family? (F = Feedback message, R = changed R code, M = changed R Module, P = changed Parameters, D = changed Data)
-     [ARIMA Forecasting] [ARIMA forecasting] [2008-12-10 17:08:10] [2a0ad3a9bcadca2da0acb91636601c6c]
F         [ARIMA Forecasting] [ARIMA Forecasting...] [2008-12-11 18:38:00] [428345b1a3979ee2ad6751f9aac15fbb] [Current]
-           [ARIMA Forecasting] [ARIMA forecasting] [2008-12-16 18:32:48] [c65b85921bf03b2616bf1bee11088685]
- RMPD      [Central Tendency] [feedback op blog] [2008-12-19 13:13:17] [b635de6fc42b001d22cbe6e730fec936]
Feedback Forum
2008-12-19 13:26:59 [Bas van Keken] [reply
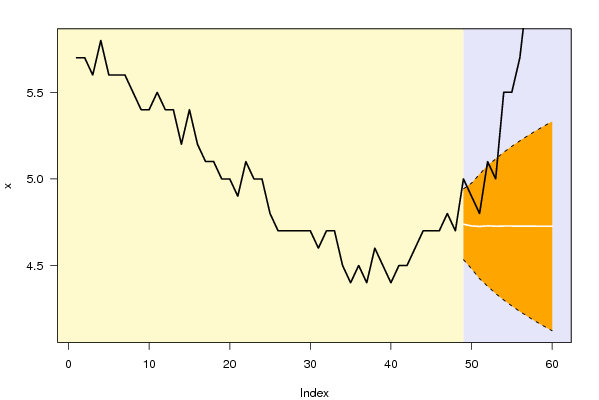
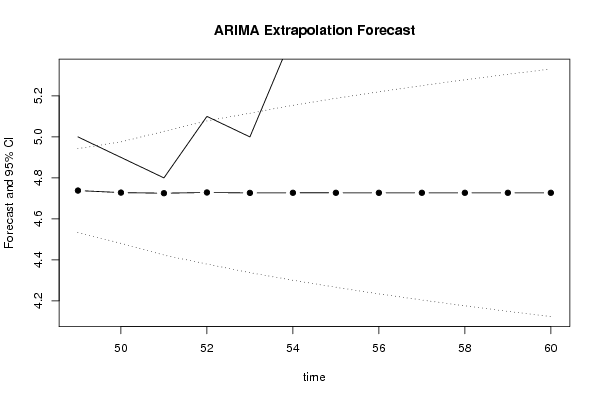
De forecast is juist uitgevoerd alleen het resultaat is verrassend. Dit komt denk ik doordat de reeks zelf nogal sterk fluctueert. Dit is te controleren in de central tendency:
http://www.freestatistics.org/blog/index.php?v=date/2008/Dec/19/t12296924618n3gzkil8wjkdk8.htm

Hier is te zien dat het gemiddelde schokkerig daalt. Vandaar dat de computer een random walk verklaart als forecast. Met het breder interpreteren van de forecast is dit een klein beetje te verbeteren, maar niet helemaal, zie link:
http://www.freestatistics.org/blog/index.php?v=date/2008/Dec/19/t1229692714ixnsw5b6d1sn39v.htm

De conclusie die u hieruit kan trekken is dat de reeks zodanig onderhevig is aan fluctuatie dat de voorspelling met behulp van processen geen bijdrage levert.
De error-waarden in de tabel varieren van 0.022 tot 0.0652. Dit is vrij laag voor een voorspelling die zo naast de werkelijke waarde zit.
De P waarden bij(F[t]>Y[t-1] zijn zeer laag. Dit wil zeggen dat de forecast met zeer kleine kans (aan het einde zelfs 0) boven de Yt zal komen.


2008-12-21 19:18:00 [Jeroen Aerts] [reply
De voorspelling van een stagnatie is een logische berekening, je berekening is correct. De link naar de vastgoedcrisis is goed gelegd, daardoor had je eigenlijk al voor de berekening kunnen weten dat dit geen goede cijfers waren om een forecasting te maken.
2008-12-22 09:29:00 [Tamara Witters] [reply
Je forecast geeft een verassend resultaat! Dit lijkt mij weinig realistisch. Met deze tijdreeks krijg een random walk als forecast. Dit had je al kunnen afleiden bij het maken van het ARIMA backward model.
Je conclusie is wel juist.
2009-01-29 13:18:13 [Hidde Van Kerckhoven] [reply
Beste, het was net onze bedoeling te onderzoeken of the forecast zou kloppen. Wanneer U de hele paper had gelezen zou u begrijpen dat het doel van de paper is: kijken of de werkloosheid zou doen zonder exogene invloeden. Doordat het model een stagnatie had voorspelt, bewijzen we dat de vastgoedcrisis (exogene factor) een significante invloed heeft gehad...

Post a new message
Dataseries X:
5,7
5,7
5,6
5,8
5,6
5,6
5,6
5,5
5,4
5,4
5,5
5,4
5,4
5,2
5,4
5,2
5,1
5,1
5,0
5,0
4,9
5,1
5,0
5,0
4,8
4,7
4,7
4,7
4,7
4,7
4,6
4,7
4,7
4,5
4,4
4,5
4,4
4,6
4,5
4,4
4,5
4,5
4,6
4,7
4,7
4,7
4,8
4,7
5,0
4,9
4,8
5,1
5,0
5,5
5,5
5,7
6,1
6,1
6,5
6,7


Summary of computational transaction
Raw Inputview raw input (R code)
Raw Outputview raw output of R engine
Computing time2 seconds
R Server'George Udny Yule' @ 72.249.76.132

\begin{tabular}{lllllllll}
\hline
Summary of computational transaction \tabularnewline
Raw Input & view raw input (R code)  \tabularnewline
Raw Output & view raw output of R engine  \tabularnewline
Computing time & 2 seconds \tabularnewline
R Server & 'George Udny Yule' @ 72.249.76.132 \tabularnewline
\hline
\end{tabular}
%Source: https://freestatistics.org/blog/index.php?pk=32429&T=0

[TABLE]
[ROW][C]Summary of computational transaction[/C][/ROW]
[ROW][C]Raw Input[/C][C]view raw input (R code) [/C][/ROW]
[ROW][C]Raw Output[/C][C]view raw output of R engine [/C][/ROW]
[ROW][C]Computing time[/C][C]2 seconds[/C][/ROW]
[ROW][C]R Server[/C][C]'George Udny Yule' @ 72.249.76.132[/C][/ROW]
[/TABLE]
Source: https://freestatistics.org/blog/index.php?pk=32429&T=0

Globally Unique Identifier (entire table): ba.freestatistics.org/blog/index.php?pk=32429&T=0

As an alternative you can also use a QR Code:  

The GUIDs for individual cells are displayed in the table below:

Summary of computational transaction
Raw Inputview raw input (R code)
Raw Outputview raw output of R engine
Computing time2 seconds
R Server'George Udny Yule' @ 72.249.76.132


Univariate ARIMA Extrapolation Forecast
timeY[t]F[t]95% LB95% UBp-value(H0: Y[t] = F[t])P(F[t]>Y[t-1])P(F[t]>Y[t-s])P(F[t]>Y[48])
364.5-------
374.4-------
384.6-------
394.5-------
404.4-------
414.5-------
424.5-------
434.6-------
444.7-------
454.7-------
464.7-------
474.8-------
484.7-------
4954.73814.53354.94270.00610.64250.99940.6425
504.94.72824.48064.97580.08690.01570.8450.5884
514.84.72534.42325.02730.31380.12840.92810.5651
525.14.72884.37945.07820.01870.34480.96750.5642
5354.72674.33755.11580.08430.030.87320.5534
545.54.72734.30035.15432e-040.10530.85160.5499
555.54.72734.26615.18855e-045e-040.70570.5461
565.74.72714.2345.22031e-040.00110.5430.543
576.14.72724.2045.250501e-040.54060.5406
586.14.72724.17555.2788000.53850.5385
596.54.72724.14855.3059000.40260.5367
606.74.72724.12275.3317000.53510.5351

\begin{tabular}{lllllllll}
\hline
Univariate ARIMA Extrapolation Forecast \tabularnewline
time & Y[t] & F[t] & 95% LB & 95% UB & p-value(H0: Y[t] = F[t]) & P(F[t]>Y[t-1]) & P(F[t]>Y[t-s]) & P(F[t]>Y[48]) \tabularnewline
36 & 4.5 & - & - & - & - & - & - & - \tabularnewline
37 & 4.4 & - & - & - & - & - & - & - \tabularnewline
38 & 4.6 & - & - & - & - & - & - & - \tabularnewline
39 & 4.5 & - & - & - & - & - & - & - \tabularnewline
40 & 4.4 & - & - & - & - & - & - & - \tabularnewline
41 & 4.5 & - & - & - & - & - & - & - \tabularnewline
42 & 4.5 & - & - & - & - & - & - & - \tabularnewline
43 & 4.6 & - & - & - & - & - & - & - \tabularnewline
44 & 4.7 & - & - & - & - & - & - & - \tabularnewline
45 & 4.7 & - & - & - & - & - & - & - \tabularnewline
46 & 4.7 & - & - & - & - & - & - & - \tabularnewline
47 & 4.8 & - & - & - & - & - & - & - \tabularnewline
48 & 4.7 & - & - & - & - & - & - & - \tabularnewline
49 & 5 & 4.7381 & 4.5335 & 4.9427 & 0.0061 & 0.6425 & 0.9994 & 0.6425 \tabularnewline
50 & 4.9 & 4.7282 & 4.4806 & 4.9758 & 0.0869 & 0.0157 & 0.845 & 0.5884 \tabularnewline
51 & 4.8 & 4.7253 & 4.4232 & 5.0273 & 0.3138 & 0.1284 & 0.9281 & 0.5651 \tabularnewline
52 & 5.1 & 4.7288 & 4.3794 & 5.0782 & 0.0187 & 0.3448 & 0.9675 & 0.5642 \tabularnewline
53 & 5 & 4.7267 & 4.3375 & 5.1158 & 0.0843 & 0.03 & 0.8732 & 0.5534 \tabularnewline
54 & 5.5 & 4.7273 & 4.3003 & 5.1543 & 2e-04 & 0.1053 & 0.8516 & 0.5499 \tabularnewline
55 & 5.5 & 4.7273 & 4.2661 & 5.1885 & 5e-04 & 5e-04 & 0.7057 & 0.5461 \tabularnewline
56 & 5.7 & 4.7271 & 4.234 & 5.2203 & 1e-04 & 0.0011 & 0.543 & 0.543 \tabularnewline
57 & 6.1 & 4.7272 & 4.204 & 5.2505 & 0 & 1e-04 & 0.5406 & 0.5406 \tabularnewline
58 & 6.1 & 4.7272 & 4.1755 & 5.2788 & 0 & 0 & 0.5385 & 0.5385 \tabularnewline
59 & 6.5 & 4.7272 & 4.1485 & 5.3059 & 0 & 0 & 0.4026 & 0.5367 \tabularnewline
60 & 6.7 & 4.7272 & 4.1227 & 5.3317 & 0 & 0 & 0.5351 & 0.5351 \tabularnewline
\hline
\end{tabular}
%Source: https://freestatistics.org/blog/index.php?pk=32429&T=1

[TABLE]
[ROW][C]Univariate ARIMA Extrapolation Forecast[/C][/ROW]
[ROW][C]time[/C][C]Y[t][/C][C]F[t][/C][C]95% LB[/C][C]95% UB[/C][C]p-value(H0: Y[t] = F[t])[/C][C]P(F[t]>Y[t-1])[/C][C]P(F[t]>Y[t-s])[/C][C]P(F[t]>Y[48])[/C][/ROW]
[ROW][C]36[/C][C]4.5[/C][C]-[/C][C]-[/C][C]-[/C][C]-[/C][C]-[/C][C]-[/C][C]-[/C][/ROW]
[ROW][C]37[/C][C]4.4[/C][C]-[/C][C]-[/C][C]-[/C][C]-[/C][C]-[/C][C]-[/C][C]-[/C][/ROW]
[ROW][C]38[/C][C]4.6[/C][C]-[/C][C]-[/C][C]-[/C][C]-[/C][C]-[/C][C]-[/C][C]-[/C][/ROW]
[ROW][C]39[/C][C]4.5[/C][C]-[/C][C]-[/C][C]-[/C][C]-[/C][C]-[/C][C]-[/C][C]-[/C][/ROW]
[ROW][C]40[/C][C]4.4[/C][C]-[/C][C]-[/C][C]-[/C][C]-[/C][C]-[/C][C]-[/C][C]-[/C][/ROW]
[ROW][C]41[/C][C]4.5[/C][C]-[/C][C]-[/C][C]-[/C][C]-[/C][C]-[/C][C]-[/C][C]-[/C][/ROW]
[ROW][C]42[/C][C]4.5[/C][C]-[/C][C]-[/C][C]-[/C][C]-[/C][C]-[/C][C]-[/C][C]-[/C][/ROW]
[ROW][C]43[/C][C]4.6[/C][C]-[/C][C]-[/C][C]-[/C][C]-[/C][C]-[/C][C]-[/C][C]-[/C][/ROW]
[ROW][C]44[/C][C]4.7[/C][C]-[/C][C]-[/C][C]-[/C][C]-[/C][C]-[/C][C]-[/C][C]-[/C][/ROW]
[ROW][C]45[/C][C]4.7[/C][C]-[/C][C]-[/C][C]-[/C][C]-[/C][C]-[/C][C]-[/C][C]-[/C][/ROW]
[ROW][C]46[/C][C]4.7[/C][C]-[/C][C]-[/C][C]-[/C][C]-[/C][C]-[/C][C]-[/C][C]-[/C][/ROW]
[ROW][C]47[/C][C]4.8[/C][C]-[/C][C]-[/C][C]-[/C][C]-[/C][C]-[/C][C]-[/C][C]-[/C][/ROW]
[ROW][C]48[/C][C]4.7[/C][C]-[/C][C]-[/C][C]-[/C][C]-[/C][C]-[/C][C]-[/C][C]-[/C][/ROW]
[ROW][C]49[/C][C]5[/C][C]4.7381[/C][C]4.5335[/C][C]4.9427[/C][C]0.0061[/C][C]0.6425[/C][C]0.9994[/C][C]0.6425[/C][/ROW]
[ROW][C]50[/C][C]4.9[/C][C]4.7282[/C][C]4.4806[/C][C]4.9758[/C][C]0.0869[/C][C]0.0157[/C][C]0.845[/C][C]0.5884[/C][/ROW]
[ROW][C]51[/C][C]4.8[/C][C]4.7253[/C][C]4.4232[/C][C]5.0273[/C][C]0.3138[/C][C]0.1284[/C][C]0.9281[/C][C]0.5651[/C][/ROW]
[ROW][C]52[/C][C]5.1[/C][C]4.7288[/C][C]4.3794[/C][C]5.0782[/C][C]0.0187[/C][C]0.3448[/C][C]0.9675[/C][C]0.5642[/C][/ROW]
[ROW][C]53[/C][C]5[/C][C]4.7267[/C][C]4.3375[/C][C]5.1158[/C][C]0.0843[/C][C]0.03[/C][C]0.8732[/C][C]0.5534[/C][/ROW]
[ROW][C]54[/C][C]5.5[/C][C]4.7273[/C][C]4.3003[/C][C]5.1543[/C][C]2e-04[/C][C]0.1053[/C][C]0.8516[/C][C]0.5499[/C][/ROW]
[ROW][C]55[/C][C]5.5[/C][C]4.7273[/C][C]4.2661[/C][C]5.1885[/C][C]5e-04[/C][C]5e-04[/C][C]0.7057[/C][C]0.5461[/C][/ROW]
[ROW][C]56[/C][C]5.7[/C][C]4.7271[/C][C]4.234[/C][C]5.2203[/C][C]1e-04[/C][C]0.0011[/C][C]0.543[/C][C]0.543[/C][/ROW]
[ROW][C]57[/C][C]6.1[/C][C]4.7272[/C][C]4.204[/C][C]5.2505[/C][C]0[/C][C]1e-04[/C][C]0.5406[/C][C]0.5406[/C][/ROW]
[ROW][C]58[/C][C]6.1[/C][C]4.7272[/C][C]4.1755[/C][C]5.2788[/C][C]0[/C][C]0[/C][C]0.5385[/C][C]0.5385[/C][/ROW]
[ROW][C]59[/C][C]6.5[/C][C]4.7272[/C][C]4.1485[/C][C]5.3059[/C][C]0[/C][C]0[/C][C]0.4026[/C][C]0.5367[/C][/ROW]
[ROW][C]60[/C][C]6.7[/C][C]4.7272[/C][C]4.1227[/C][C]5.3317[/C][C]0[/C][C]0[/C][C]0.5351[/C][C]0.5351[/C][/ROW]
[/TABLE]
Source: https://freestatistics.org/blog/index.php?pk=32429&T=1

Globally Unique Identifier (entire table): ba.freestatistics.org/blog/index.php?pk=32429&T=1

As an alternative you can also use a QR Code:  

The GUIDs for individual cells are displayed in the table below:

Univariate ARIMA Extrapolation Forecast
timeY[t]F[t]95% LB95% UBp-value(H0: Y[t] = F[t])P(F[t]>Y[t-1])P(F[t]>Y[t-s])P(F[t]>Y[48])
364.5-------
374.4-------
384.6-------
394.5-------
404.4-------
414.5-------
424.5-------
434.6-------
444.7-------
454.7-------
464.7-------
474.8-------
484.7-------
4954.73814.53354.94270.00610.64250.99940.6425
504.94.72824.48064.97580.08690.01570.8450.5884
514.84.72534.42325.02730.31380.12840.92810.5651
525.14.72884.37945.07820.01870.34480.96750.5642
5354.72674.33755.11580.08430.030.87320.5534
545.54.72734.30035.15432e-040.10530.85160.5499
555.54.72734.26615.18855e-045e-040.70570.5461
565.74.72714.2345.22031e-040.00110.5430.543
576.14.72724.2045.250501e-040.54060.5406
586.14.72724.17555.2788000.53850.5385
596.54.72724.14855.3059000.40260.5367
606.74.72724.12275.3317000.53510.5351


Univariate ARIMA Extrapolation Forecast Performance
time% S.E.PEMAPESq.EMSERMSE
490.0220.05530.00460.06860.00570.0756
500.02670.03630.0030.02950.00250.0496
510.03260.01580.00130.00565e-040.0216
520.03770.07850.00650.13780.01150.1071
530.0420.05780.00480.07470.00620.0789
540.04610.16350.01360.5970.04980.2231
550.04980.16350.01360.59710.04980.2231
560.05320.20580.01720.94640.07890.2808
570.05650.29040.02421.88450.1570.3963
580.05950.29040.02421.88460.1570.3963
590.06250.3750.03133.14280.26190.5118
600.06520.41730.03483.89190.32430.5695

\begin{tabular}{lllllllll}
\hline
Univariate ARIMA Extrapolation Forecast Performance \tabularnewline
time & % S.E. & PE & MAPE & Sq.E & MSE & RMSE \tabularnewline
49 & 0.022 & 0.0553 & 0.0046 & 0.0686 & 0.0057 & 0.0756 \tabularnewline
50 & 0.0267 & 0.0363 & 0.003 & 0.0295 & 0.0025 & 0.0496 \tabularnewline
51 & 0.0326 & 0.0158 & 0.0013 & 0.0056 & 5e-04 & 0.0216 \tabularnewline
52 & 0.0377 & 0.0785 & 0.0065 & 0.1378 & 0.0115 & 0.1071 \tabularnewline
53 & 0.042 & 0.0578 & 0.0048 & 0.0747 & 0.0062 & 0.0789 \tabularnewline
54 & 0.0461 & 0.1635 & 0.0136 & 0.597 & 0.0498 & 0.2231 \tabularnewline
55 & 0.0498 & 0.1635 & 0.0136 & 0.5971 & 0.0498 & 0.2231 \tabularnewline
56 & 0.0532 & 0.2058 & 0.0172 & 0.9464 & 0.0789 & 0.2808 \tabularnewline
57 & 0.0565 & 0.2904 & 0.0242 & 1.8845 & 0.157 & 0.3963 \tabularnewline
58 & 0.0595 & 0.2904 & 0.0242 & 1.8846 & 0.157 & 0.3963 \tabularnewline
59 & 0.0625 & 0.375 & 0.0313 & 3.1428 & 0.2619 & 0.5118 \tabularnewline
60 & 0.0652 & 0.4173 & 0.0348 & 3.8919 & 0.3243 & 0.5695 \tabularnewline
\hline
\end{tabular}
%Source: https://freestatistics.org/blog/index.php?pk=32429&T=2

[TABLE]
[ROW][C]Univariate ARIMA Extrapolation Forecast Performance[/C][/ROW]
[ROW][C]time[/C][C]% S.E.[/C][C]PE[/C][C]MAPE[/C][C]Sq.E[/C][C]MSE[/C][C]RMSE[/C][/ROW]
[ROW][C]49[/C][C]0.022[/C][C]0.0553[/C][C]0.0046[/C][C]0.0686[/C][C]0.0057[/C][C]0.0756[/C][/ROW]
[ROW][C]50[/C][C]0.0267[/C][C]0.0363[/C][C]0.003[/C][C]0.0295[/C][C]0.0025[/C][C]0.0496[/C][/ROW]
[ROW][C]51[/C][C]0.0326[/C][C]0.0158[/C][C]0.0013[/C][C]0.0056[/C][C]5e-04[/C][C]0.0216[/C][/ROW]
[ROW][C]52[/C][C]0.0377[/C][C]0.0785[/C][C]0.0065[/C][C]0.1378[/C][C]0.0115[/C][C]0.1071[/C][/ROW]
[ROW][C]53[/C][C]0.042[/C][C]0.0578[/C][C]0.0048[/C][C]0.0747[/C][C]0.0062[/C][C]0.0789[/C][/ROW]
[ROW][C]54[/C][C]0.0461[/C][C]0.1635[/C][C]0.0136[/C][C]0.597[/C][C]0.0498[/C][C]0.2231[/C][/ROW]
[ROW][C]55[/C][C]0.0498[/C][C]0.1635[/C][C]0.0136[/C][C]0.5971[/C][C]0.0498[/C][C]0.2231[/C][/ROW]
[ROW][C]56[/C][C]0.0532[/C][C]0.2058[/C][C]0.0172[/C][C]0.9464[/C][C]0.0789[/C][C]0.2808[/C][/ROW]
[ROW][C]57[/C][C]0.0565[/C][C]0.2904[/C][C]0.0242[/C][C]1.8845[/C][C]0.157[/C][C]0.3963[/C][/ROW]
[ROW][C]58[/C][C]0.0595[/C][C]0.2904[/C][C]0.0242[/C][C]1.8846[/C][C]0.157[/C][C]0.3963[/C][/ROW]
[ROW][C]59[/C][C]0.0625[/C][C]0.375[/C][C]0.0313[/C][C]3.1428[/C][C]0.2619[/C][C]0.5118[/C][/ROW]
[ROW][C]60[/C][C]0.0652[/C][C]0.4173[/C][C]0.0348[/C][C]3.8919[/C][C]0.3243[/C][C]0.5695[/C][/ROW]
[/TABLE]
Source: https://freestatistics.org/blog/index.php?pk=32429&T=2

Globally Unique Identifier (entire table): ba.freestatistics.org/blog/index.php?pk=32429&T=2

As an alternative you can also use a QR Code:  

The GUIDs for individual cells are displayed in the table below:

Univariate ARIMA Extrapolation Forecast Performance
time% S.E.PEMAPESq.EMSERMSE
490.0220.05530.00460.06860.00570.0756
500.02670.03630.0030.02950.00250.0496
510.03260.01580.00130.00565e-040.0216
520.03770.07850.00650.13780.01150.1071
530.0420.05780.00480.07470.00620.0789
540.04610.16350.01360.5970.04980.2231
550.04980.16350.01360.59710.04980.2231
560.05320.20580.01720.94640.07890.2808
570.05650.29040.02421.88450.1570.3963
580.05950.29040.02421.88460.1570.3963
590.06250.3750.03133.14280.26190.5118
600.06520.41730.03483.89190.32430.5695


Parameters (Session):
par1 = 12 ; par2 = 1 ; par3 = 1 ; par4 = 0 ; par5 = 12 ; par6 = 3 ; par7 = 0 ; par8 = 0 ; par9 = 0 ; par10 = FALSE ;
Parameters (R input):
par1 = 12 ; par2 = 1 ; par3 = 1 ; par4 = 0 ; par5 = 12 ; par6 = 3 ; par7 = 0 ; par8 = 0 ; par9 = 0 ; par10 = FALSE ;
R code (references can be found in the software module):
par1 <- as.numeric(par1) #cut off periods
par2 <- as.numeric(par2) #lambda
par3 <- as.numeric(par3) #degree of non-seasonal differencing
par4 <- as.numeric(par4) #degree of seasonal differencing
par5 <- as.numeric(par5) #seasonal period
par6 <- as.numeric(par6) #p
par7 <- as.numeric(par7) #q
par8 <- as.numeric(par8) #P
par9 <- as.numeric(par9) #Q
if (par10 == 'TRUE') par10 <- TRUE
if (par10 == 'FALSE') par10 <- FALSE
if (par2 == 0) x <- log(x)
if (par2 != 0) x <- x^par2
lx <- length(x)
first <- lx - 2*par1
nx <- lx - par1
nx1 <- nx + 1
fx <- lx - nx
if (fx < 1) {
fx <- par5
nx1 <- lx + fx - 1
first <- lx - 2*fx
}
first <- 1
if (fx < 3) fx <- round(lx/10,0)
(arima.out <- arima(x[1:nx], order=c(par6,par3,par7), seasonal=list(order=c(par8,par4,par9), period=par5), include.mean=par10, method='ML'))
(forecast <- predict(arima.out,fx))
(lb <- forecast$pred - 1.96 * forecast$se)
(ub <- forecast$pred + 1.96 * forecast$se)
if (par2 == 0) {
x <- exp(x)
forecast$pred <- exp(forecast$pred)
lb <- exp(lb)
ub <- exp(ub)
}
if (par2 != 0) {
x <- x^(1/par2)
forecast$pred <- forecast$pred^(1/par2)
lb <- lb^(1/par2)
ub <- ub^(1/par2)
}
if (par2 < 0) {
olb <- lb
lb <- ub
ub <- olb
}
(actandfor <- c(x[1:nx], forecast$pred))
(perc.se <- (ub-forecast$pred)/1.96/forecast$pred)
bitmap(file='test1.png')
opar <- par(mar=c(4,4,2,2),las=1)
ylim <- c( min(x[first:nx],lb), max(x[first:nx],ub))
plot(x,ylim=ylim,type='n',xlim=c(first,lx))
usr <- par('usr')
rect(usr[1],usr[3],nx+1,usr[4],border=NA,col='lemonchiffon')
rect(nx1,usr[3],usr[2],usr[4],border=NA,col='lavender')
abline(h= (-3:3)*2 , col ='gray', lty =3)
polygon( c(nx1:lx,lx:nx1), c(lb,rev(ub)), col = 'orange', lty=2,border=NA)
lines(nx1:lx, lb , lty=2)
lines(nx1:lx, ub , lty=2)
lines(x, lwd=2)
lines(nx1:lx, forecast$pred , lwd=2 , col ='white')
box()
par(opar)
dev.off()
prob.dec <- array(NA, dim=fx)
prob.sdec <- array(NA, dim=fx)
prob.ldec <- array(NA, dim=fx)
prob.pval <- array(NA, dim=fx)
perf.pe <- array(0, dim=fx)
perf.mape <- array(0, dim=fx)
perf.se <- array(0, dim=fx)
perf.mse <- array(0, dim=fx)
perf.rmse <- array(0, dim=fx)
for (i in 1:fx) {
locSD <- (ub[i] - forecast$pred[i]) / 1.96
perf.pe[i] = (x[nx+i] - forecast$pred[i]) / forecast$pred[i]
perf.mape[i] = perf.mape[i] + abs(perf.pe[i])
perf.se[i] = (x[nx+i] - forecast$pred[i])^2
perf.mse[i] = perf.mse[i] + perf.se[i]
prob.dec[i] = pnorm((x[nx+i-1] - forecast$pred[i]) / locSD)
prob.sdec[i] = pnorm((x[nx+i-par5] - forecast$pred[i]) / locSD)
prob.ldec[i] = pnorm((x[nx] - forecast$pred[i]) / locSD)
prob.pval[i] = pnorm(abs(x[nx+i] - forecast$pred[i]) / locSD)
}
perf.mape = perf.mape / fx
perf.mse = perf.mse / fx
perf.rmse = sqrt(perf.mse)
bitmap(file='test2.png')
plot(forecast$pred, pch=19, type='b',main='ARIMA Extrapolation Forecast', ylab='Forecast and 95% CI', xlab='time',ylim=c(min(lb),max(ub)))
dum <- forecast$pred
dum[1:12] <- x[(nx+1):lx]
lines(dum, lty=1)
lines(ub,lty=3)
lines(lb,lty=3)
dev.off()
load(file='createtable')
a<-table.start()
a<-table.row.start(a)
a<-table.element(a,'Univariate ARIMA Extrapolation Forecast',9,TRUE)
a<-table.row.end(a)
a<-table.row.start(a)
a<-table.element(a,'time',1,header=TRUE)
a<-table.element(a,'Y[t]',1,header=TRUE)
a<-table.element(a,'F[t]',1,header=TRUE)
a<-table.element(a,'95% LB',1,header=TRUE)
a<-table.element(a,'95% UB',1,header=TRUE)
a<-table.element(a,'p-value
(H0: Y[t] = F[t])',1,header=TRUE)
a<-table.element(a,'P(F[t]>Y[t-1])',1,header=TRUE)
a<-table.element(a,'P(F[t]>Y[t-s])',1,header=TRUE)
mylab <- paste('P(F[t]>Y[',nx,sep='')
mylab <- paste(mylab,'])',sep='')
a<-table.element(a,mylab,1,header=TRUE)
a<-table.row.end(a)
for (i in (nx-par5):nx) {
a<-table.row.start(a)
a<-table.element(a,i,header=TRUE)
a<-table.element(a,x[i])
a<-table.element(a,'-')
a<-table.row.end(a)
}
for (i in 1:fx) {
a<-table.row.start(a)
a<-table.element(a,nx+i,header=TRUE)
a<-table.element(a,round(x[nx+i],4))
a<-table.element(a,round(forecast$pred[i],4))
a<-table.element(a,round(lb[i],4))
a<-table.element(a,round(ub[i],4))
a<-table.element(a,round((1-prob.pval[i]),4))
a<-table.element(a,round((1-prob.dec[i]),4))
a<-table.element(a,round((1-prob.sdec[i]),4))
a<-table.element(a,round((1-prob.ldec[i]),4))
a<-table.row.end(a)
}
a<-table.end(a)
table.save(a,file='mytable.tab')
a<-table.start()
a<-table.row.start(a)
a<-table.element(a,'Univariate ARIMA Extrapolation Forecast Performance',7,TRUE)
a<-table.row.end(a)
a<-table.row.start(a)
a<-table.element(a,'time',1,header=TRUE)
a<-table.element(a,'% S.E.',1,header=TRUE)
a<-table.element(a,'PE',1,header=TRUE)
a<-table.element(a,'MAPE',1,header=TRUE)
a<-table.element(a,'Sq.E',1,header=TRUE)
a<-table.element(a,'MSE',1,header=TRUE)
a<-table.element(a,'RMSE',1,header=TRUE)
a<-table.row.end(a)
for (i in 1:fx) {
a<-table.row.start(a)
a<-table.element(a,nx+i,header=TRUE)
a<-table.element(a,round(perc.se[i],4))
a<-table.element(a,round(perf.pe[i],4))
a<-table.element(a,round(perf.mape[i],4))
a<-table.element(a,round(perf.se[i],4))
a<-table.element(a,round(perf.mse[i],4))
a<-table.element(a,round(perf.rmse[i],4))
a<-table.row.end(a)
}
a<-table.end(a)
table.save(a,file='mytable1.tab')