Free Statistics

of Irreproducible Research!

Author's title

Author*The author of this computation has been verified*
R Software Modulerwasp_autocorrelation.wasp
Title produced by software(Partial) Autocorrelation Function
Date of computationThu, 11 Dec 2008 10:31:41 -0700
Cite this page as followsStatistical Computations at FreeStatistics.org, Office for Research Development and Education, URL https://freestatistics.org/blog/index.php?v=date/2008/Dec/11/t1229016768df6rbsp72vxs7at.htm/, Retrieved Sun, 19 May 2024 05:37:17 +0000
Statistical Computations at FreeStatistics.org, Office for Research Development and Education, URL https://freestatistics.org/blog/index.php?pk=32380, Retrieved Sun, 19 May 2024 05:37:17 +0000
QR Codes:

Original text written by user:
IsPrivate?No (this computation is public)
User-defined keywords
Estimated Impact141
Family? (F = Feedback message, R = changed R code, M = changed R Module, P = changed Parameters, D = changed Data)
-       [(Partial) Autocorrelation Function] [autocorrelation D=1] [2008-12-11 17:31:41] [a9e6d7cd6e144e8b311d9f96a24c5a25] [Current]
Feedback Forum

Post a new message
Dataseries X:
99.5
93.5
104.6
95.3
102.8
103.3
100.2
107.9
107.5
119.8
112
102.1
105.3
101.3
108.4
107.4
109.1
109.5
111.4
110.1
117
129.6
113.5
113.3
110.1
107.4
110.1
112.5
106
117.6
117.8
113.5
121.2
130.4
115.2
117.9
110.7
107.6
124.3
115.1
112.5
127.9
117.4
119.3
130.4
126
125.4
130.5
115.9
108.7
124
119.4
118.6
131.3
111.1
124.8
132.3
126.7
131.7
130.9
122.1
113.2
133.6
119.2
129.4
131.4
117.1
130.5
132.3
140.8
137.5
128.6
126.7
120.8
139.3
128.6
131.3
136.3
128.8
133.2
136.3
151.1
145
134.4


Summary of computational transaction
Raw Inputview raw input (R code)
Raw Outputview raw output of R engine
Computing time2 seconds
R Server'Gwilym Jenkins' @ 72.249.127.135

\begin{tabular}{lllllllll}
\hline
Summary of computational transaction \tabularnewline
Raw Input & view raw input (R code)  \tabularnewline
Raw Output & view raw output of R engine  \tabularnewline
Computing time & 2 seconds \tabularnewline
R Server & 'Gwilym Jenkins' @ 72.249.127.135 \tabularnewline
\hline
\end{tabular}
%Source: https://freestatistics.org/blog/index.php?pk=32380&T=0

[TABLE]
[ROW][C]Summary of computational transaction[/C][/ROW]
[ROW][C]Raw Input[/C][C]view raw input (R code) [/C][/ROW]
[ROW][C]Raw Output[/C][C]view raw output of R engine [/C][/ROW]
[ROW][C]Computing time[/C][C]2 seconds[/C][/ROW]
[ROW][C]R Server[/C][C]'Gwilym Jenkins' @ 72.249.127.135[/C][/ROW]
[/TABLE]
Source: https://freestatistics.org/blog/index.php?pk=32380&T=0

Globally Unique Identifier (entire table): ba.freestatistics.org/blog/index.php?pk=32380&T=0

As an alternative you can also use a QR Code:  

The GUIDs for individual cells are displayed in the table below:

Summary of computational transaction
Raw Inputview raw input (R code)
Raw Outputview raw output of R engine
Computing time2 seconds
R Server'Gwilym Jenkins' @ 72.249.127.135


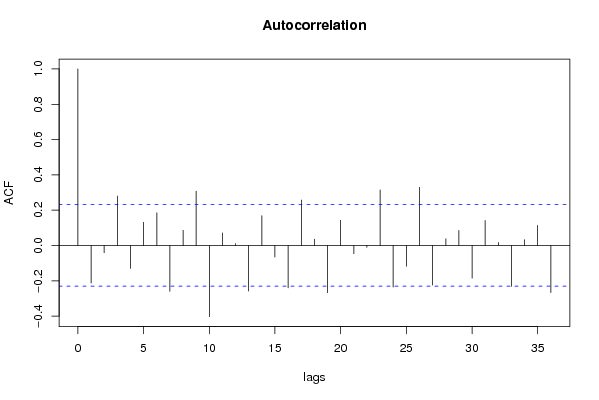
Autocorrelation Function
Time lag kACF(k)T-STATP-value
1-0.213071-1.8080.037394
2-0.04078-0.3460.365166
30.2799792.37570.01009
4-0.130476-1.10710.135963
50.1313341.11440.134405
60.1851161.57080.060312
7-0.259592-2.20270.015408
80.0857170.72730.23469
90.3075172.60940.005513
10-0.403401-3.4230.000513
110.0706250.59930.275437
120.0099650.08460.466424
13-0.258495-2.19340.015754
140.1687871.43220.078206
15-0.065578-0.55640.289815
16-0.239899-2.03560.022735
170.2572552.18290.016153
180.0355840.30190.381783
19-0.267428-2.26920.013127
200.142371.20810.11549
21-0.047022-0.3990.345539
22-0.010596-0.08990.464304
230.3143392.66730.00472
24-0.235848-2.00120.024568
25-0.117411-0.99630.161229
260.3291152.79260.003346
27-0.224356-1.90370.030471
280.0376670.31960.375093
290.0851550.72260.236145
30-0.185219-1.57160.06021
310.140751.19430.118139
320.0173890.14760.441554
33-0.231554-1.96480.026648
340.0327860.27820.390827
350.1134940.9630.169377
36-0.266766-2.26360.013307

\begin{tabular}{lllllllll}
\hline
Autocorrelation Function \tabularnewline
Time lag k & ACF(k) & T-STAT & P-value \tabularnewline
1 & -0.213071 & -1.808 & 0.037394 \tabularnewline
2 & -0.04078 & -0.346 & 0.365166 \tabularnewline
3 & 0.279979 & 2.3757 & 0.01009 \tabularnewline
4 & -0.130476 & -1.1071 & 0.135963 \tabularnewline
5 & 0.131334 & 1.1144 & 0.134405 \tabularnewline
6 & 0.185116 & 1.5708 & 0.060312 \tabularnewline
7 & -0.259592 & -2.2027 & 0.015408 \tabularnewline
8 & 0.085717 & 0.7273 & 0.23469 \tabularnewline
9 & 0.307517 & 2.6094 & 0.005513 \tabularnewline
10 & -0.403401 & -3.423 & 0.000513 \tabularnewline
11 & 0.070625 & 0.5993 & 0.275437 \tabularnewline
12 & 0.009965 & 0.0846 & 0.466424 \tabularnewline
13 & -0.258495 & -2.1934 & 0.015754 \tabularnewline
14 & 0.168787 & 1.4322 & 0.078206 \tabularnewline
15 & -0.065578 & -0.5564 & 0.289815 \tabularnewline
16 & -0.239899 & -2.0356 & 0.022735 \tabularnewline
17 & 0.257255 & 2.1829 & 0.016153 \tabularnewline
18 & 0.035584 & 0.3019 & 0.381783 \tabularnewline
19 & -0.267428 & -2.2692 & 0.013127 \tabularnewline
20 & 0.14237 & 1.2081 & 0.11549 \tabularnewline
21 & -0.047022 & -0.399 & 0.345539 \tabularnewline
22 & -0.010596 & -0.0899 & 0.464304 \tabularnewline
23 & 0.314339 & 2.6673 & 0.00472 \tabularnewline
24 & -0.235848 & -2.0012 & 0.024568 \tabularnewline
25 & -0.117411 & -0.9963 & 0.161229 \tabularnewline
26 & 0.329115 & 2.7926 & 0.003346 \tabularnewline
27 & -0.224356 & -1.9037 & 0.030471 \tabularnewline
28 & 0.037667 & 0.3196 & 0.375093 \tabularnewline
29 & 0.085155 & 0.7226 & 0.236145 \tabularnewline
30 & -0.185219 & -1.5716 & 0.06021 \tabularnewline
31 & 0.14075 & 1.1943 & 0.118139 \tabularnewline
32 & 0.017389 & 0.1476 & 0.441554 \tabularnewline
33 & -0.231554 & -1.9648 & 0.026648 \tabularnewline
34 & 0.032786 & 0.2782 & 0.390827 \tabularnewline
35 & 0.113494 & 0.963 & 0.169377 \tabularnewline
36 & -0.266766 & -2.2636 & 0.013307 \tabularnewline
\hline
\end{tabular}
%Source: https://freestatistics.org/blog/index.php?pk=32380&T=1

[TABLE]
[ROW][C]Autocorrelation Function[/C][/ROW]
[ROW][C]Time lag k[/C][C]ACF(k)[/C][C]T-STAT[/C][C]P-value[/C][/ROW]
[ROW][C]1[/C][C]-0.213071[/C][C]-1.808[/C][C]0.037394[/C][/ROW]
[ROW][C]2[/C][C]-0.04078[/C][C]-0.346[/C][C]0.365166[/C][/ROW]
[ROW][C]3[/C][C]0.279979[/C][C]2.3757[/C][C]0.01009[/C][/ROW]
[ROW][C]4[/C][C]-0.130476[/C][C]-1.1071[/C][C]0.135963[/C][/ROW]
[ROW][C]5[/C][C]0.131334[/C][C]1.1144[/C][C]0.134405[/C][/ROW]
[ROW][C]6[/C][C]0.185116[/C][C]1.5708[/C][C]0.060312[/C][/ROW]
[ROW][C]7[/C][C]-0.259592[/C][C]-2.2027[/C][C]0.015408[/C][/ROW]
[ROW][C]8[/C][C]0.085717[/C][C]0.7273[/C][C]0.23469[/C][/ROW]
[ROW][C]9[/C][C]0.307517[/C][C]2.6094[/C][C]0.005513[/C][/ROW]
[ROW][C]10[/C][C]-0.403401[/C][C]-3.423[/C][C]0.000513[/C][/ROW]
[ROW][C]11[/C][C]0.070625[/C][C]0.5993[/C][C]0.275437[/C][/ROW]
[ROW][C]12[/C][C]0.009965[/C][C]0.0846[/C][C]0.466424[/C][/ROW]
[ROW][C]13[/C][C]-0.258495[/C][C]-2.1934[/C][C]0.015754[/C][/ROW]
[ROW][C]14[/C][C]0.168787[/C][C]1.4322[/C][C]0.078206[/C][/ROW]
[ROW][C]15[/C][C]-0.065578[/C][C]-0.5564[/C][C]0.289815[/C][/ROW]
[ROW][C]16[/C][C]-0.239899[/C][C]-2.0356[/C][C]0.022735[/C][/ROW]
[ROW][C]17[/C][C]0.257255[/C][C]2.1829[/C][C]0.016153[/C][/ROW]
[ROW][C]18[/C][C]0.035584[/C][C]0.3019[/C][C]0.381783[/C][/ROW]
[ROW][C]19[/C][C]-0.267428[/C][C]-2.2692[/C][C]0.013127[/C][/ROW]
[ROW][C]20[/C][C]0.14237[/C][C]1.2081[/C][C]0.11549[/C][/ROW]
[ROW][C]21[/C][C]-0.047022[/C][C]-0.399[/C][C]0.345539[/C][/ROW]
[ROW][C]22[/C][C]-0.010596[/C][C]-0.0899[/C][C]0.464304[/C][/ROW]
[ROW][C]23[/C][C]0.314339[/C][C]2.6673[/C][C]0.00472[/C][/ROW]
[ROW][C]24[/C][C]-0.235848[/C][C]-2.0012[/C][C]0.024568[/C][/ROW]
[ROW][C]25[/C][C]-0.117411[/C][C]-0.9963[/C][C]0.161229[/C][/ROW]
[ROW][C]26[/C][C]0.329115[/C][C]2.7926[/C][C]0.003346[/C][/ROW]
[ROW][C]27[/C][C]-0.224356[/C][C]-1.9037[/C][C]0.030471[/C][/ROW]
[ROW][C]28[/C][C]0.037667[/C][C]0.3196[/C][C]0.375093[/C][/ROW]
[ROW][C]29[/C][C]0.085155[/C][C]0.7226[/C][C]0.236145[/C][/ROW]
[ROW][C]30[/C][C]-0.185219[/C][C]-1.5716[/C][C]0.06021[/C][/ROW]
[ROW][C]31[/C][C]0.14075[/C][C]1.1943[/C][C]0.118139[/C][/ROW]
[ROW][C]32[/C][C]0.017389[/C][C]0.1476[/C][C]0.441554[/C][/ROW]
[ROW][C]33[/C][C]-0.231554[/C][C]-1.9648[/C][C]0.026648[/C][/ROW]
[ROW][C]34[/C][C]0.032786[/C][C]0.2782[/C][C]0.390827[/C][/ROW]
[ROW][C]35[/C][C]0.113494[/C][C]0.963[/C][C]0.169377[/C][/ROW]
[ROW][C]36[/C][C]-0.266766[/C][C]-2.2636[/C][C]0.013307[/C][/ROW]
[/TABLE]
Source: https://freestatistics.org/blog/index.php?pk=32380&T=1

Globally Unique Identifier (entire table): ba.freestatistics.org/blog/index.php?pk=32380&T=1

As an alternative you can also use a QR Code:  

The GUIDs for individual cells are displayed in the table below:

Autocorrelation Function
Time lag kACF(k)T-STATP-value
1-0.213071-1.8080.037394
2-0.04078-0.3460.365166
30.2799792.37570.01009
4-0.130476-1.10710.135963
50.1313341.11440.134405
60.1851161.57080.060312
7-0.259592-2.20270.015408
80.0857170.72730.23469
90.3075172.60940.005513
10-0.403401-3.4230.000513
110.0706250.59930.275437
120.0099650.08460.466424
13-0.258495-2.19340.015754
140.1687871.43220.078206
15-0.065578-0.55640.289815
16-0.239899-2.03560.022735
170.2572552.18290.016153
180.0355840.30190.381783
19-0.267428-2.26920.013127
200.142371.20810.11549
21-0.047022-0.3990.345539
22-0.010596-0.08990.464304
230.3143392.66730.00472
24-0.235848-2.00120.024568
25-0.117411-0.99630.161229
260.3291152.79260.003346
27-0.224356-1.90370.030471
280.0376670.31960.375093
290.0851550.72260.236145
30-0.185219-1.57160.06021
310.140751.19430.118139
320.0173890.14760.441554
33-0.231554-1.96480.026648
340.0327860.27820.390827
350.1134940.9630.169377
36-0.266766-2.26360.013307


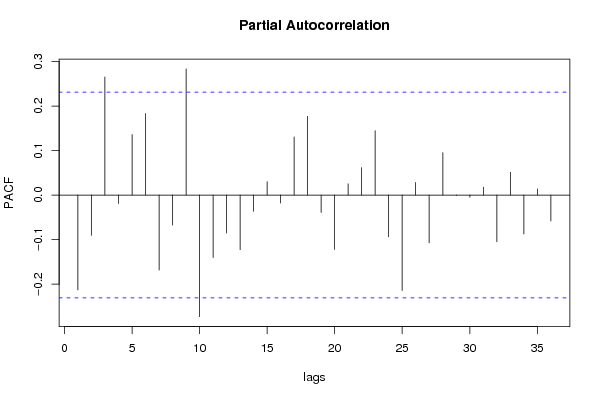
Partial Autocorrelation Function
Time lag kPACF(k)T-STATP-value
1-0.213071-1.8080.037394
2-0.090277-0.7660.223082
30.2653832.25180.013691
4-0.019048-0.16160.436026
50.1359131.15330.126309
60.183011.55290.062417
7-0.168366-1.42860.078717
8-0.067358-0.57160.284703
90.2832212.40320.009415
10-0.272912-2.31570.011712
11-0.139903-1.18710.119542
12-0.085122-0.72230.236229
13-0.122579-1.04010.150884
14-0.036291-0.30790.379509
150.030230.25650.399143
16-0.017892-0.15180.439877
170.1305891.10810.135757
180.1767561.49980.069016
19-0.039049-0.33130.370676
20-0.121901-1.03440.152213
210.0254520.2160.414812
220.0618730.5250.300594
230.1446131.22710.111895
24-0.09374-0.79540.214495
25-0.214336-1.81870.036558
260.0283140.24030.405408
27-0.10713-0.9090.183184
280.0952340.80810.210851
29-0.000821-0.0070.497229
30-0.004678-0.03970.484223
310.0178010.1510.44018
32-0.104983-0.89080.188
330.0514830.43680.331766
34-0.087331-0.7410.230543
350.0137030.11630.453878
36-0.058166-0.49360.311562

\begin{tabular}{lllllllll}
\hline
Partial Autocorrelation Function \tabularnewline
Time lag k & PACF(k) & T-STAT & P-value \tabularnewline
1 & -0.213071 & -1.808 & 0.037394 \tabularnewline
2 & -0.090277 & -0.766 & 0.223082 \tabularnewline
3 & 0.265383 & 2.2518 & 0.013691 \tabularnewline
4 & -0.019048 & -0.1616 & 0.436026 \tabularnewline
5 & 0.135913 & 1.1533 & 0.126309 \tabularnewline
6 & 0.18301 & 1.5529 & 0.062417 \tabularnewline
7 & -0.168366 & -1.4286 & 0.078717 \tabularnewline
8 & -0.067358 & -0.5716 & 0.284703 \tabularnewline
9 & 0.283221 & 2.4032 & 0.009415 \tabularnewline
10 & -0.272912 & -2.3157 & 0.011712 \tabularnewline
11 & -0.139903 & -1.1871 & 0.119542 \tabularnewline
12 & -0.085122 & -0.7223 & 0.236229 \tabularnewline
13 & -0.122579 & -1.0401 & 0.150884 \tabularnewline
14 & -0.036291 & -0.3079 & 0.379509 \tabularnewline
15 & 0.03023 & 0.2565 & 0.399143 \tabularnewline
16 & -0.017892 & -0.1518 & 0.439877 \tabularnewline
17 & 0.130589 & 1.1081 & 0.135757 \tabularnewline
18 & 0.176756 & 1.4998 & 0.069016 \tabularnewline
19 & -0.039049 & -0.3313 & 0.370676 \tabularnewline
20 & -0.121901 & -1.0344 & 0.152213 \tabularnewline
21 & 0.025452 & 0.216 & 0.414812 \tabularnewline
22 & 0.061873 & 0.525 & 0.300594 \tabularnewline
23 & 0.144613 & 1.2271 & 0.111895 \tabularnewline
24 & -0.09374 & -0.7954 & 0.214495 \tabularnewline
25 & -0.214336 & -1.8187 & 0.036558 \tabularnewline
26 & 0.028314 & 0.2403 & 0.405408 \tabularnewline
27 & -0.10713 & -0.909 & 0.183184 \tabularnewline
28 & 0.095234 & 0.8081 & 0.210851 \tabularnewline
29 & -0.000821 & -0.007 & 0.497229 \tabularnewline
30 & -0.004678 & -0.0397 & 0.484223 \tabularnewline
31 & 0.017801 & 0.151 & 0.44018 \tabularnewline
32 & -0.104983 & -0.8908 & 0.188 \tabularnewline
33 & 0.051483 & 0.4368 & 0.331766 \tabularnewline
34 & -0.087331 & -0.741 & 0.230543 \tabularnewline
35 & 0.013703 & 0.1163 & 0.453878 \tabularnewline
36 & -0.058166 & -0.4936 & 0.311562 \tabularnewline
\hline
\end{tabular}
%Source: https://freestatistics.org/blog/index.php?pk=32380&T=2

[TABLE]
[ROW][C]Partial Autocorrelation Function[/C][/ROW]
[ROW][C]Time lag k[/C][C]PACF(k)[/C][C]T-STAT[/C][C]P-value[/C][/ROW]
[ROW][C]1[/C][C]-0.213071[/C][C]-1.808[/C][C]0.037394[/C][/ROW]
[ROW][C]2[/C][C]-0.090277[/C][C]-0.766[/C][C]0.223082[/C][/ROW]
[ROW][C]3[/C][C]0.265383[/C][C]2.2518[/C][C]0.013691[/C][/ROW]
[ROW][C]4[/C][C]-0.019048[/C][C]-0.1616[/C][C]0.436026[/C][/ROW]
[ROW][C]5[/C][C]0.135913[/C][C]1.1533[/C][C]0.126309[/C][/ROW]
[ROW][C]6[/C][C]0.18301[/C][C]1.5529[/C][C]0.062417[/C][/ROW]
[ROW][C]7[/C][C]-0.168366[/C][C]-1.4286[/C][C]0.078717[/C][/ROW]
[ROW][C]8[/C][C]-0.067358[/C][C]-0.5716[/C][C]0.284703[/C][/ROW]
[ROW][C]9[/C][C]0.283221[/C][C]2.4032[/C][C]0.009415[/C][/ROW]
[ROW][C]10[/C][C]-0.272912[/C][C]-2.3157[/C][C]0.011712[/C][/ROW]
[ROW][C]11[/C][C]-0.139903[/C][C]-1.1871[/C][C]0.119542[/C][/ROW]
[ROW][C]12[/C][C]-0.085122[/C][C]-0.7223[/C][C]0.236229[/C][/ROW]
[ROW][C]13[/C][C]-0.122579[/C][C]-1.0401[/C][C]0.150884[/C][/ROW]
[ROW][C]14[/C][C]-0.036291[/C][C]-0.3079[/C][C]0.379509[/C][/ROW]
[ROW][C]15[/C][C]0.03023[/C][C]0.2565[/C][C]0.399143[/C][/ROW]
[ROW][C]16[/C][C]-0.017892[/C][C]-0.1518[/C][C]0.439877[/C][/ROW]
[ROW][C]17[/C][C]0.130589[/C][C]1.1081[/C][C]0.135757[/C][/ROW]
[ROW][C]18[/C][C]0.176756[/C][C]1.4998[/C][C]0.069016[/C][/ROW]
[ROW][C]19[/C][C]-0.039049[/C][C]-0.3313[/C][C]0.370676[/C][/ROW]
[ROW][C]20[/C][C]-0.121901[/C][C]-1.0344[/C][C]0.152213[/C][/ROW]
[ROW][C]21[/C][C]0.025452[/C][C]0.216[/C][C]0.414812[/C][/ROW]
[ROW][C]22[/C][C]0.061873[/C][C]0.525[/C][C]0.300594[/C][/ROW]
[ROW][C]23[/C][C]0.144613[/C][C]1.2271[/C][C]0.111895[/C][/ROW]
[ROW][C]24[/C][C]-0.09374[/C][C]-0.7954[/C][C]0.214495[/C][/ROW]
[ROW][C]25[/C][C]-0.214336[/C][C]-1.8187[/C][C]0.036558[/C][/ROW]
[ROW][C]26[/C][C]0.028314[/C][C]0.2403[/C][C]0.405408[/C][/ROW]
[ROW][C]27[/C][C]-0.10713[/C][C]-0.909[/C][C]0.183184[/C][/ROW]
[ROW][C]28[/C][C]0.095234[/C][C]0.8081[/C][C]0.210851[/C][/ROW]
[ROW][C]29[/C][C]-0.000821[/C][C]-0.007[/C][C]0.497229[/C][/ROW]
[ROW][C]30[/C][C]-0.004678[/C][C]-0.0397[/C][C]0.484223[/C][/ROW]
[ROW][C]31[/C][C]0.017801[/C][C]0.151[/C][C]0.44018[/C][/ROW]
[ROW][C]32[/C][C]-0.104983[/C][C]-0.8908[/C][C]0.188[/C][/ROW]
[ROW][C]33[/C][C]0.051483[/C][C]0.4368[/C][C]0.331766[/C][/ROW]
[ROW][C]34[/C][C]-0.087331[/C][C]-0.741[/C][C]0.230543[/C][/ROW]
[ROW][C]35[/C][C]0.013703[/C][C]0.1163[/C][C]0.453878[/C][/ROW]
[ROW][C]36[/C][C]-0.058166[/C][C]-0.4936[/C][C]0.311562[/C][/ROW]
[/TABLE]
Source: https://freestatistics.org/blog/index.php?pk=32380&T=2

Globally Unique Identifier (entire table): ba.freestatistics.org/blog/index.php?pk=32380&T=2

As an alternative you can also use a QR Code:  

The GUIDs for individual cells are displayed in the table below:

Partial Autocorrelation Function
Time lag kPACF(k)T-STATP-value
1-0.213071-1.8080.037394
2-0.090277-0.7660.223082
30.2653832.25180.013691
4-0.019048-0.16160.436026
50.1359131.15330.126309
60.183011.55290.062417
7-0.168366-1.42860.078717
8-0.067358-0.57160.284703
90.2832212.40320.009415
10-0.272912-2.31570.011712
11-0.139903-1.18710.119542
12-0.085122-0.72230.236229
13-0.122579-1.04010.150884
14-0.036291-0.30790.379509
150.030230.25650.399143
16-0.017892-0.15180.439877
170.1305891.10810.135757
180.1767561.49980.069016
19-0.039049-0.33130.370676
20-0.121901-1.03440.152213
210.0254520.2160.414812
220.0618730.5250.300594
230.1446131.22710.111895
24-0.09374-0.79540.214495
25-0.214336-1.81870.036558
260.0283140.24030.405408
27-0.10713-0.9090.183184
280.0952340.80810.210851
29-0.000821-0.0070.497229
30-0.004678-0.03970.484223
310.0178010.1510.44018
32-0.104983-0.89080.188
330.0514830.43680.331766
34-0.087331-0.7410.230543
350.0137030.11630.453878
36-0.058166-0.49360.311562


Parameters (Session):
par1 = 36 ; par2 = 1 ; par3 = 0 ; par4 = 1 ; par5 = 12 ;
Parameters (R input):
par1 = 36 ; par2 = 1 ; par3 = 0 ; par4 = 1 ; par5 = 12 ;
R code (references can be found in the software module):
if (par1 == 'Default') {
par1 = 10*log10(length(x))
} else {
par1 <- as.numeric(par1)
}
par2 <- as.numeric(par2)
par3 <- as.numeric(par3)
par4 <- as.numeric(par4)
par5 <- as.numeric(par5)
if (par2 == 0) {
x <- log(x)
} else {
x <- (x ^ par2 - 1) / par2
}
if (par3 > 0) x <- diff(x,lag=1,difference=par3)
if (par4 > 0) x <- diff(x,lag=par5,difference=par4)
bitmap(file='pic1.png')
racf <- acf(x,par1,main='Autocorrelation',xlab='lags',ylab='ACF')
dev.off()
bitmap(file='pic2.png')
rpacf <- pacf(x,par1,main='Partial Autocorrelation',xlab='lags',ylab='PACF')
dev.off()
(myacf <- c(racf$acf))
(mypacf <- c(rpacf$acf))
lengthx <- length(x)
sqrtn <- sqrt(lengthx)
load(file='createtable')
a<-table.start()
a<-table.row.start(a)
a<-table.element(a,'Autocorrelation Function',4,TRUE)
a<-table.row.end(a)
a<-table.row.start(a)
a<-table.element(a,'Time lag k',header=TRUE)
a<-table.element(a,hyperlink('basics.htm','ACF(k)','click here for more information about the Autocorrelation Function'),header=TRUE)
a<-table.element(a,'T-STAT',header=TRUE)
a<-table.element(a,'P-value',header=TRUE)
a<-table.row.end(a)
for (i in 2:(par1+1)) {
a<-table.row.start(a)
a<-table.element(a,i-1,header=TRUE)
a<-table.element(a,round(myacf[i],6))
mytstat <- myacf[i]*sqrtn
a<-table.element(a,round(mytstat,4))
a<-table.element(a,round(1-pt(abs(mytstat),lengthx),6))
a<-table.row.end(a)
}
a<-table.end(a)
table.save(a,file='mytable.tab')
a<-table.start()
a<-table.row.start(a)
a<-table.element(a,'Partial Autocorrelation Function',4,TRUE)
a<-table.row.end(a)
a<-table.row.start(a)
a<-table.element(a,'Time lag k',header=TRUE)
a<-table.element(a,hyperlink('basics.htm','PACF(k)','click here for more information about the Partial Autocorrelation Function'),header=TRUE)
a<-table.element(a,'T-STAT',header=TRUE)
a<-table.element(a,'P-value',header=TRUE)
a<-table.row.end(a)
for (i in 1:par1) {
a<-table.row.start(a)
a<-table.element(a,i,header=TRUE)
a<-table.element(a,round(mypacf[i],6))
mytstat <- mypacf[i]*sqrtn
a<-table.element(a,round(mytstat,4))
a<-table.element(a,round(1-pt(abs(mytstat),lengthx),6))
a<-table.row.end(a)
}
a<-table.end(a)
table.save(a,file='mytable1.tab')