Free Statistics

of Irreproducible Research!

Author's title

Author*The author of this computation has been verified*
R Software Modulerwasp_smp.wasp
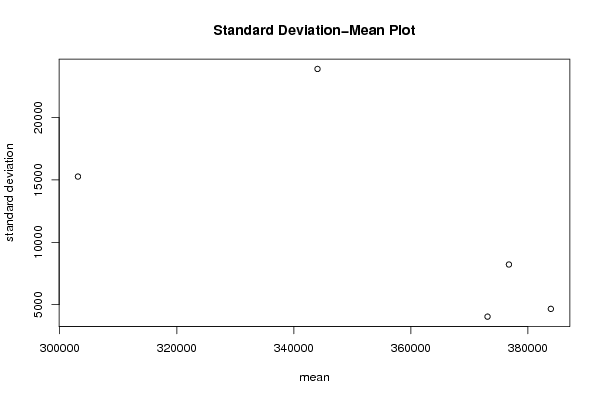
Title produced by softwareStandard Deviation-Mean Plot
Date of computationThu, 11 Dec 2008 10:27:28 -0700
Cite this page as followsStatistical Computations at FreeStatistics.org, Office for Research Development and Education, URL https://freestatistics.org/blog/index.php?v=date/2008/Dec/11/t1229016484vzfxmql31k3iljc.htm/, Retrieved Sun, 19 May 2024 05:17:44 +0000
Statistical Computations at FreeStatistics.org, Office for Research Development and Education, URL https://freestatistics.org/blog/index.php?pk=32371, Retrieved Sun, 19 May 2024 05:17:44 +0000
QR Codes:

Original text written by user:
IsPrivate?No (this computation is public)
User-defined keywords
Estimated Impact163
Family? (F = Feedback message, R = changed R code, M = changed R Module, P = changed Parameters, D = changed Data)
-     [Univariate Data Series] [Werkloosheid 25 t...] [2008-11-28 13:12:46] [6743688719638b0cb1c0a6e0bf433315]
-   P   [Univariate Data Series] [Unemployment betw...] [2008-12-02 18:02:05] [6743688719638b0cb1c0a6e0bf433315]
- RMP     [Variance Reduction Matrix] [Total unemploymen...] [2008-12-03 16:40:35] [6743688719638b0cb1c0a6e0bf433315]
- RM          [Standard Deviation-Mean Plot] [lambda] [2008-12-11 17:27:28] [9b05d7ef5dbcfba4217d280d9092f628] [Current]
Feedback Forum

Post a new message
Dataseries X:
374556
375021
375787
372720
364431
370490
376974
377632
378205
370861
369167
371551
382842
381903
384502
392058
384359
388884
386586
387495
385705
378670
377367
376911
389827
387820
387267
380575
372402
376740
377795
376126
370804
367980
367866
366121
379421
378519
372423
355072
344693
342892
344178
337606
327103
323953
316532
306307
327225
329573
313761
307836
300074
304198
306122
300414
292133
290616
280244
285179
305486


Summary of computational transaction
Raw Inputview raw input (R code)
Raw Outputview raw output of R engine
Computing time1 seconds
R Server'Gwilym Jenkins' @ 72.249.127.135

\begin{tabular}{lllllllll}
\hline
Summary of computational transaction \tabularnewline
Raw Input & view raw input (R code)  \tabularnewline
Raw Output & view raw output of R engine  \tabularnewline
Computing time & 1 seconds \tabularnewline
R Server & 'Gwilym Jenkins' @ 72.249.127.135 \tabularnewline
\hline
\end{tabular}
%Source: https://freestatistics.org/blog/index.php?pk=32371&T=0

[TABLE]
[ROW][C]Summary of computational transaction[/C][/ROW]
[ROW][C]Raw Input[/C][C]view raw input (R code) [/C][/ROW]
[ROW][C]Raw Output[/C][C]view raw output of R engine [/C][/ROW]
[ROW][C]Computing time[/C][C]1 seconds[/C][/ROW]
[ROW][C]R Server[/C][C]'Gwilym Jenkins' @ 72.249.127.135[/C][/ROW]
[/TABLE]
Source: https://freestatistics.org/blog/index.php?pk=32371&T=0

Globally Unique Identifier (entire table): ba.freestatistics.org/blog/index.php?pk=32371&T=0

As an alternative you can also use a QR Code:  

The GUIDs for individual cells are displayed in the table below:

Summary of computational transaction
Raw Inputview raw input (R code)
Raw Outputview raw output of R engine
Computing time1 seconds
R Server'Gwilym Jenkins' @ 72.249.127.135


Standard Deviation-Mean Plot
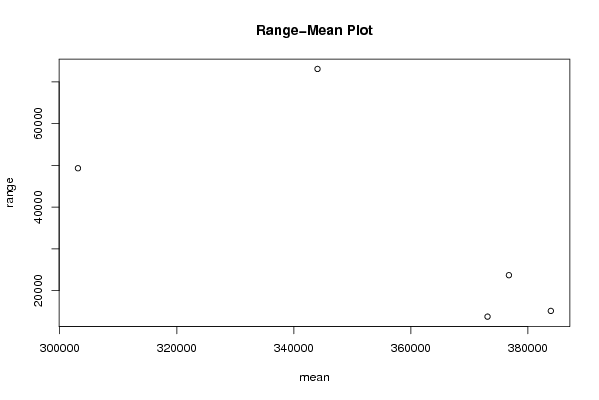
SectionMeanStandard DeviationRange
1373116.254040.9716906389513774
2383940.1666666674664.469897452715147
3376776.9166666678220.470938271723706
4344058.2523897.300954957673114
5303114.58333333315271.223981774249329

\begin{tabular}{lllllllll}
\hline
Standard Deviation-Mean Plot \tabularnewline
Section & Mean & Standard Deviation & Range \tabularnewline
1 & 373116.25 & 4040.97169063895 & 13774 \tabularnewline
2 & 383940.166666667 & 4664.4698974527 & 15147 \tabularnewline
3 & 376776.916666667 & 8220.4709382717 & 23706 \tabularnewline
4 & 344058.25 & 23897.3009549576 & 73114 \tabularnewline
5 & 303114.583333333 & 15271.2239817742 & 49329 \tabularnewline
\hline
\end{tabular}
%Source: https://freestatistics.org/blog/index.php?pk=32371&T=1

[TABLE]
[ROW][C]Standard Deviation-Mean Plot[/C][/ROW]
[ROW][C]Section[/C][C]Mean[/C][C]Standard Deviation[/C][C]Range[/C][/ROW]
[ROW][C]1[/C][C]373116.25[/C][C]4040.97169063895[/C][C]13774[/C][/ROW]
[ROW][C]2[/C][C]383940.166666667[/C][C]4664.4698974527[/C][C]15147[/C][/ROW]
[ROW][C]3[/C][C]376776.916666667[/C][C]8220.4709382717[/C][C]23706[/C][/ROW]
[ROW][C]4[/C][C]344058.25[/C][C]23897.3009549576[/C][C]73114[/C][/ROW]
[ROW][C]5[/C][C]303114.583333333[/C][C]15271.2239817742[/C][C]49329[/C][/ROW]
[/TABLE]
Source: https://freestatistics.org/blog/index.php?pk=32371&T=1

Globally Unique Identifier (entire table): ba.freestatistics.org/blog/index.php?pk=32371&T=1

As an alternative you can also use a QR Code:  

The GUIDs for individual cells are displayed in the table below:

Standard Deviation-Mean Plot
SectionMeanStandard DeviationRange
1373116.254040.9716906389513774
2383940.1666666674664.469897452715147
3376776.9166666678220.470938271723706
4344058.2523897.300954957673114
5303114.58333333315271.223981774249329


Regression: S.E.(k) = alpha + beta * Mean(k)
alpha70043.8928404061
beta-0.165145428603103
S.D.0.109344302440778
T-STAT-1.51032495444878
p-value0.228120091031829

\begin{tabular}{lllllllll}
\hline
Regression: S.E.(k) = alpha + beta * Mean(k) \tabularnewline
alpha & 70043.8928404061 \tabularnewline
beta & -0.165145428603103 \tabularnewline
S.D. & 0.109344302440778 \tabularnewline
T-STAT & -1.51032495444878 \tabularnewline
p-value & 0.228120091031829 \tabularnewline
\hline
\end{tabular}
%Source: https://freestatistics.org/blog/index.php?pk=32371&T=2

[TABLE]
[ROW][C]Regression: S.E.(k) = alpha + beta * Mean(k)[/C][/ROW]
[ROW][C]alpha[/C][C]70043.8928404061[/C][/ROW]
[ROW][C]beta[/C][C]-0.165145428603103[/C][/ROW]
[ROW][C]S.D.[/C][C]0.109344302440778[/C][/ROW]
[ROW][C]T-STAT[/C][C]-1.51032495444878[/C][/ROW]
[ROW][C]p-value[/C][C]0.228120091031829[/C][/ROW]
[/TABLE]
Source: https://freestatistics.org/blog/index.php?pk=32371&T=2

Globally Unique Identifier (entire table): ba.freestatistics.org/blog/index.php?pk=32371&T=2

As an alternative you can also use a QR Code:  

The GUIDs for individual cells are displayed in the table below:

Regression: S.E.(k) = alpha + beta * Mean(k)
alpha70043.8928404061
beta-0.165145428603103
S.D.0.109344302440778
T-STAT-1.51032495444878
p-value0.228120091031829


Regression: ln S.E.(k) = alpha + beta * ln Mean(k)
alpha79.8156654939964
beta-5.53379185453124
S.D.3.16768101086888
T-STAT-1.74695363439179
p-value0.178974757663470
Lambda6.53379185453124

\begin{tabular}{lllllllll}
\hline
Regression: ln S.E.(k) = alpha + beta * ln Mean(k) \tabularnewline
alpha & 79.8156654939964 \tabularnewline
beta & -5.53379185453124 \tabularnewline
S.D. & 3.16768101086888 \tabularnewline
T-STAT & -1.74695363439179 \tabularnewline
p-value & 0.178974757663470 \tabularnewline
Lambda & 6.53379185453124 \tabularnewline
\hline
\end{tabular}
%Source: https://freestatistics.org/blog/index.php?pk=32371&T=3

[TABLE]
[ROW][C]Regression: ln S.E.(k) = alpha + beta * ln Mean(k)[/C][/ROW]
[ROW][C]alpha[/C][C]79.8156654939964[/C][/ROW]
[ROW][C]beta[/C][C]-5.53379185453124[/C][/ROW]
[ROW][C]S.D.[/C][C]3.16768101086888[/C][/ROW]
[ROW][C]T-STAT[/C][C]-1.74695363439179[/C][/ROW]
[ROW][C]p-value[/C][C]0.178974757663470[/C][/ROW]
[ROW][C]Lambda[/C][C]6.53379185453124[/C][/ROW]
[/TABLE]
Source: https://freestatistics.org/blog/index.php?pk=32371&T=3

Globally Unique Identifier (entire table): ba.freestatistics.org/blog/index.php?pk=32371&T=3

As an alternative you can also use a QR Code:  

The GUIDs for individual cells are displayed in the table below:

Regression: ln S.E.(k) = alpha + beta * ln Mean(k)
alpha79.8156654939964
beta-5.53379185453124
S.D.3.16768101086888
T-STAT-1.74695363439179
p-value0.178974757663470
Lambda6.53379185453124


Parameters (Session):
par1 = 12 ;
Parameters (R input):
par1 = 12 ;
R code (references can be found in the software module):
par1 <- as.numeric(par1)
(n <- length(x))
(np <- floor(n / par1))
arr <- array(NA,dim=c(par1,np))
j <- 0
k <- 1
for (i in 1:(np*par1))
{
j = j + 1
arr[j,k] <- x[i]
if (j == par1) {
j = 0
k=k+1
}
}
arr
arr.mean <- array(NA,dim=np)
arr.sd <- array(NA,dim=np)
arr.range <- array(NA,dim=np)
for (j in 1:np)
{
arr.mean[j] <- mean(arr[,j],na.rm=TRUE)
arr.sd[j] <- sd(arr[,j],na.rm=TRUE)
arr.range[j] <- max(arr[,j],na.rm=TRUE) - min(arr[,j],na.rm=TRUE)
}
arr.mean
arr.sd
arr.range
(lm1 <- lm(arr.sd~arr.mean))
(lnlm1 <- lm(log(arr.sd)~log(arr.mean)))
(lm2 <- lm(arr.range~arr.mean))
bitmap(file='test1.png')
plot(arr.mean,arr.sd,main='Standard Deviation-Mean Plot',xlab='mean',ylab='standard deviation')
dev.off()
bitmap(file='test2.png')
plot(arr.mean,arr.range,main='Range-Mean Plot',xlab='mean',ylab='range')
dev.off()
load(file='createtable')
a<-table.start()
a<-table.row.start(a)
a<-table.element(a,'Standard Deviation-Mean Plot',4,TRUE)
a<-table.row.end(a)
a<-table.row.start(a)
a<-table.element(a,'Section',header=TRUE)
a<-table.element(a,'Mean',header=TRUE)
a<-table.element(a,'Standard Deviation',header=TRUE)
a<-table.element(a,'Range',header=TRUE)
a<-table.row.end(a)
for (j in 1:np) {
a<-table.row.start(a)
a<-table.element(a,j,header=TRUE)
a<-table.element(a,arr.mean[j])
a<-table.element(a,arr.sd[j] )
a<-table.element(a,arr.range[j] )
a<-table.row.end(a)
}
a<-table.end(a)
table.save(a,file='mytable.tab')
a<-table.start()
a<-table.row.start(a)
a<-table.element(a,'Regression: S.E.(k) = alpha + beta * Mean(k)',2,TRUE)
a<-table.row.end(a)
a<-table.row.start(a)
a<-table.element(a,'alpha',header=TRUE)
a<-table.element(a,lm1$coefficients[[1]])
a<-table.row.end(a)
a<-table.row.start(a)
a<-table.element(a,'beta',header=TRUE)
a<-table.element(a,lm1$coefficients[[2]])
a<-table.row.end(a)
a<-table.row.start(a)
a<-table.element(a,'S.D.',header=TRUE)
a<-table.element(a,summary(lm1)$coefficients[2,2])
a<-table.row.end(a)
a<-table.row.start(a)
a<-table.element(a,'T-STAT',header=TRUE)
a<-table.element(a,summary(lm1)$coefficients[2,3])
a<-table.row.end(a)
a<-table.row.start(a)
a<-table.element(a,'p-value',header=TRUE)
a<-table.element(a,summary(lm1)$coefficients[2,4])
a<-table.row.end(a)
a<-table.end(a)
table.save(a,file='mytable1.tab')
a<-table.start()
a<-table.row.start(a)
a<-table.element(a,'Regression: ln S.E.(k) = alpha + beta * ln Mean(k)',2,TRUE)
a<-table.row.end(a)
a<-table.row.start(a)
a<-table.element(a,'alpha',header=TRUE)
a<-table.element(a,lnlm1$coefficients[[1]])
a<-table.row.end(a)
a<-table.row.start(a)
a<-table.element(a,'beta',header=TRUE)
a<-table.element(a,lnlm1$coefficients[[2]])
a<-table.row.end(a)
a<-table.row.start(a)
a<-table.element(a,'S.D.',header=TRUE)
a<-table.element(a,summary(lnlm1)$coefficients[2,2])
a<-table.row.end(a)
a<-table.row.start(a)
a<-table.element(a,'T-STAT',header=TRUE)
a<-table.element(a,summary(lnlm1)$coefficients[2,3])
a<-table.row.end(a)
a<-table.row.start(a)
a<-table.element(a,'p-value',header=TRUE)
a<-table.element(a,summary(lnlm1)$coefficients[2,4])
a<-table.row.end(a)
a<-table.row.start(a)
a<-table.element(a,'Lambda',header=TRUE)
a<-table.element(a,1-lnlm1$coefficients[[2]])
a<-table.row.end(a)
a<-table.end(a)
table.save(a,file='mytable2.tab')