Free Statistics

of Irreproducible Research!

Author's title

Author*The author of this computation has been verified*
R Software Modulerwasp_autocorrelation.wasp
Title produced by software(Partial) Autocorrelation Function
Date of computationThu, 11 Dec 2008 10:20:40 -0700
Cite this page as followsStatistical Computations at FreeStatistics.org, Office for Research Development and Education, URL https://freestatistics.org/blog/index.php?v=date/2008/Dec/11/t1229016088dsxicibs4f8x1j0.htm/, Retrieved Sun, 19 May 2024 06:00:54 +0000
Statistical Computations at FreeStatistics.org, Office for Research Development and Education, URL https://freestatistics.org/blog/index.php?pk=32356, Retrieved Sun, 19 May 2024 06:00:54 +0000
QR Codes:

Original text written by user:
IsPrivate?No (this computation is public)
User-defined keywords
Estimated Impact141
Family? (F = Feedback message, R = changed R code, M = changed R Module, P = changed Parameters, D = changed Data)
-       [(Partial) Autocorrelation Function] [autocorrelation] [2008-12-11 17:20:40] [a9e6d7cd6e144e8b311d9f96a24c5a25] [Current]
Feedback Forum

Post a new message
Dataseries X:
99.5
93.5
104.6
95.3
102.8
103.3
100.2
107.9
107.5
119.8
112
102.1
105.3
101.3
108.4
107.4
109.1
109.5
111.4
110.1
117
129.6
113.5
113.3
110.1
107.4
110.1
112.5
106
117.6
117.8
113.5
121.2
130.4
115.2
117.9
110.7
107.6
124.3
115.1
112.5
127.9
117.4
119.3
130.4
126
125.4
130.5
115.9
108.7
124
119.4
118.6
131.3
111.1
124.8
132.3
126.7
131.7
130.9
122.1
113.2
133.6
119.2
129.4
131.4
117.1
130.5
132.3
140.8
137.5
128.6
126.7
120.8
139.3
128.6
131.3
136.3
128.8
133.2
136.3
151.1
145
134.4


Summary of computational transaction
Raw Inputview raw input (R code)
Raw Outputview raw output of R engine
Computing time1 seconds
R Server'Gwilym Jenkins' @ 72.249.127.135

\begin{tabular}{lllllllll}
\hline
Summary of computational transaction \tabularnewline
Raw Input & view raw input (R code)  \tabularnewline
Raw Output & view raw output of R engine  \tabularnewline
Computing time & 1 seconds \tabularnewline
R Server & 'Gwilym Jenkins' @ 72.249.127.135 \tabularnewline
\hline
\end{tabular}
%Source: https://freestatistics.org/blog/index.php?pk=32356&T=0

[TABLE]
[ROW][C]Summary of computational transaction[/C][/ROW]
[ROW][C]Raw Input[/C][C]view raw input (R code) [/C][/ROW]
[ROW][C]Raw Output[/C][C]view raw output of R engine [/C][/ROW]
[ROW][C]Computing time[/C][C]1 seconds[/C][/ROW]
[ROW][C]R Server[/C][C]'Gwilym Jenkins' @ 72.249.127.135[/C][/ROW]
[/TABLE]
Source: https://freestatistics.org/blog/index.php?pk=32356&T=0

Globally Unique Identifier (entire table): ba.freestatistics.org/blog/index.php?pk=32356&T=0

As an alternative you can also use a QR Code:  

The GUIDs for individual cells are displayed in the table below:

Summary of computational transaction
Raw Inputview raw input (R code)
Raw Outputview raw output of R engine
Computing time1 seconds
R Server'Gwilym Jenkins' @ 72.249.127.135


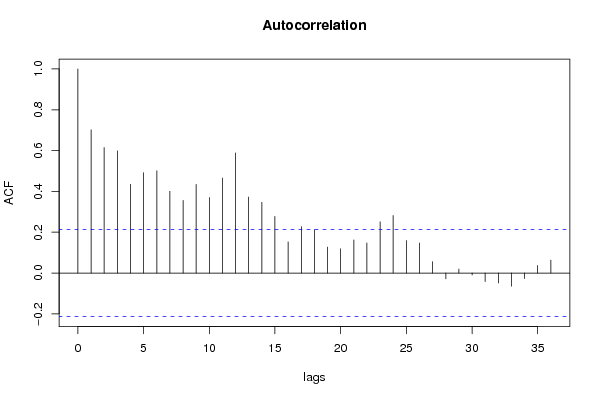
Autocorrelation Function
Time lag kACF(k)T-STATP-value
10.7019616.43360
20.6146955.63380
30.5985415.48570
40.434513.98247.2e-05
50.491774.50711.1e-05
60.5005814.58798e-06
70.4006053.67160.000211
80.3554583.25780.00081
90.4338233.97617.4e-05
100.3704983.39570.000524
110.4650564.26232.6e-05
120.5885865.39450
130.3721543.41080.000499
140.346193.17290.001054
150.2771692.54030.006458
160.1526341.39890.08276
170.2270182.08070.020256
180.2131371.95340.027049
190.1269051.16310.12404
200.1184621.08570.140354
210.1623191.48770.07029
220.1471541.34870.090531
230.251012.30050.011948
240.2817552.58230.005774
250.1588841.45620.074533
260.1470171.34740.090732
270.0554890.50860.306197
28-0.028338-0.25970.397858
290.0194010.17780.429651
30-0.009566-0.08770.465173
31-0.041952-0.38450.350792
32-0.048579-0.44520.328647
33-0.064397-0.59020.278318
34-0.027418-0.25130.401102
350.0374240.3430.36623
360.0631870.57910.282031

\begin{tabular}{lllllllll}
\hline
Autocorrelation Function \tabularnewline
Time lag k & ACF(k) & T-STAT & P-value \tabularnewline
1 & 0.701961 & 6.4336 & 0 \tabularnewline
2 & 0.614695 & 5.6338 & 0 \tabularnewline
3 & 0.598541 & 5.4857 & 0 \tabularnewline
4 & 0.43451 & 3.9824 & 7.2e-05 \tabularnewline
5 & 0.49177 & 4.5071 & 1.1e-05 \tabularnewline
6 & 0.500581 & 4.5879 & 8e-06 \tabularnewline
7 & 0.400605 & 3.6716 & 0.000211 \tabularnewline
8 & 0.355458 & 3.2578 & 0.00081 \tabularnewline
9 & 0.433823 & 3.9761 & 7.4e-05 \tabularnewline
10 & 0.370498 & 3.3957 & 0.000524 \tabularnewline
11 & 0.465056 & 4.2623 & 2.6e-05 \tabularnewline
12 & 0.588586 & 5.3945 & 0 \tabularnewline
13 & 0.372154 & 3.4108 & 0.000499 \tabularnewline
14 & 0.34619 & 3.1729 & 0.001054 \tabularnewline
15 & 0.277169 & 2.5403 & 0.006458 \tabularnewline
16 & 0.152634 & 1.3989 & 0.08276 \tabularnewline
17 & 0.227018 & 2.0807 & 0.020256 \tabularnewline
18 & 0.213137 & 1.9534 & 0.027049 \tabularnewline
19 & 0.126905 & 1.1631 & 0.12404 \tabularnewline
20 & 0.118462 & 1.0857 & 0.140354 \tabularnewline
21 & 0.162319 & 1.4877 & 0.07029 \tabularnewline
22 & 0.147154 & 1.3487 & 0.090531 \tabularnewline
23 & 0.25101 & 2.3005 & 0.011948 \tabularnewline
24 & 0.281755 & 2.5823 & 0.005774 \tabularnewline
25 & 0.158884 & 1.4562 & 0.074533 \tabularnewline
26 & 0.147017 & 1.3474 & 0.090732 \tabularnewline
27 & 0.055489 & 0.5086 & 0.306197 \tabularnewline
28 & -0.028338 & -0.2597 & 0.397858 \tabularnewline
29 & 0.019401 & 0.1778 & 0.429651 \tabularnewline
30 & -0.009566 & -0.0877 & 0.465173 \tabularnewline
31 & -0.041952 & -0.3845 & 0.350792 \tabularnewline
32 & -0.048579 & -0.4452 & 0.328647 \tabularnewline
33 & -0.064397 & -0.5902 & 0.278318 \tabularnewline
34 & -0.027418 & -0.2513 & 0.401102 \tabularnewline
35 & 0.037424 & 0.343 & 0.36623 \tabularnewline
36 & 0.063187 & 0.5791 & 0.282031 \tabularnewline
\hline
\end{tabular}
%Source: https://freestatistics.org/blog/index.php?pk=32356&T=1

[TABLE]
[ROW][C]Autocorrelation Function[/C][/ROW]
[ROW][C]Time lag k[/C][C]ACF(k)[/C][C]T-STAT[/C][C]P-value[/C][/ROW]
[ROW][C]1[/C][C]0.701961[/C][C]6.4336[/C][C]0[/C][/ROW]
[ROW][C]2[/C][C]0.614695[/C][C]5.6338[/C][C]0[/C][/ROW]
[ROW][C]3[/C][C]0.598541[/C][C]5.4857[/C][C]0[/C][/ROW]
[ROW][C]4[/C][C]0.43451[/C][C]3.9824[/C][C]7.2e-05[/C][/ROW]
[ROW][C]5[/C][C]0.49177[/C][C]4.5071[/C][C]1.1e-05[/C][/ROW]
[ROW][C]6[/C][C]0.500581[/C][C]4.5879[/C][C]8e-06[/C][/ROW]
[ROW][C]7[/C][C]0.400605[/C][C]3.6716[/C][C]0.000211[/C][/ROW]
[ROW][C]8[/C][C]0.355458[/C][C]3.2578[/C][C]0.00081[/C][/ROW]
[ROW][C]9[/C][C]0.433823[/C][C]3.9761[/C][C]7.4e-05[/C][/ROW]
[ROW][C]10[/C][C]0.370498[/C][C]3.3957[/C][C]0.000524[/C][/ROW]
[ROW][C]11[/C][C]0.465056[/C][C]4.2623[/C][C]2.6e-05[/C][/ROW]
[ROW][C]12[/C][C]0.588586[/C][C]5.3945[/C][C]0[/C][/ROW]
[ROW][C]13[/C][C]0.372154[/C][C]3.4108[/C][C]0.000499[/C][/ROW]
[ROW][C]14[/C][C]0.34619[/C][C]3.1729[/C][C]0.001054[/C][/ROW]
[ROW][C]15[/C][C]0.277169[/C][C]2.5403[/C][C]0.006458[/C][/ROW]
[ROW][C]16[/C][C]0.152634[/C][C]1.3989[/C][C]0.08276[/C][/ROW]
[ROW][C]17[/C][C]0.227018[/C][C]2.0807[/C][C]0.020256[/C][/ROW]
[ROW][C]18[/C][C]0.213137[/C][C]1.9534[/C][C]0.027049[/C][/ROW]
[ROW][C]19[/C][C]0.126905[/C][C]1.1631[/C][C]0.12404[/C][/ROW]
[ROW][C]20[/C][C]0.118462[/C][C]1.0857[/C][C]0.140354[/C][/ROW]
[ROW][C]21[/C][C]0.162319[/C][C]1.4877[/C][C]0.07029[/C][/ROW]
[ROW][C]22[/C][C]0.147154[/C][C]1.3487[/C][C]0.090531[/C][/ROW]
[ROW][C]23[/C][C]0.25101[/C][C]2.3005[/C][C]0.011948[/C][/ROW]
[ROW][C]24[/C][C]0.281755[/C][C]2.5823[/C][C]0.005774[/C][/ROW]
[ROW][C]25[/C][C]0.158884[/C][C]1.4562[/C][C]0.074533[/C][/ROW]
[ROW][C]26[/C][C]0.147017[/C][C]1.3474[/C][C]0.090732[/C][/ROW]
[ROW][C]27[/C][C]0.055489[/C][C]0.5086[/C][C]0.306197[/C][/ROW]
[ROW][C]28[/C][C]-0.028338[/C][C]-0.2597[/C][C]0.397858[/C][/ROW]
[ROW][C]29[/C][C]0.019401[/C][C]0.1778[/C][C]0.429651[/C][/ROW]
[ROW][C]30[/C][C]-0.009566[/C][C]-0.0877[/C][C]0.465173[/C][/ROW]
[ROW][C]31[/C][C]-0.041952[/C][C]-0.3845[/C][C]0.350792[/C][/ROW]
[ROW][C]32[/C][C]-0.048579[/C][C]-0.4452[/C][C]0.328647[/C][/ROW]
[ROW][C]33[/C][C]-0.064397[/C][C]-0.5902[/C][C]0.278318[/C][/ROW]
[ROW][C]34[/C][C]-0.027418[/C][C]-0.2513[/C][C]0.401102[/C][/ROW]
[ROW][C]35[/C][C]0.037424[/C][C]0.343[/C][C]0.36623[/C][/ROW]
[ROW][C]36[/C][C]0.063187[/C][C]0.5791[/C][C]0.282031[/C][/ROW]
[/TABLE]
Source: https://freestatistics.org/blog/index.php?pk=32356&T=1

Globally Unique Identifier (entire table): ba.freestatistics.org/blog/index.php?pk=32356&T=1

As an alternative you can also use a QR Code:  

The GUIDs for individual cells are displayed in the table below:

Autocorrelation Function
Time lag kACF(k)T-STATP-value
10.7019616.43360
20.6146955.63380
30.5985415.48570
40.434513.98247.2e-05
50.491774.50711.1e-05
60.5005814.58798e-06
70.4006053.67160.000211
80.3554583.25780.00081
90.4338233.97617.4e-05
100.3704983.39570.000524
110.4650564.26232.6e-05
120.5885865.39450
130.3721543.41080.000499
140.346193.17290.001054
150.2771692.54030.006458
160.1526341.39890.08276
170.2270182.08070.020256
180.2131371.95340.027049
190.1269051.16310.12404
200.1184621.08570.140354
210.1623191.48770.07029
220.1471541.34870.090531
230.251012.30050.011948
240.2817552.58230.005774
250.1588841.45620.074533
260.1470171.34740.090732
270.0554890.50860.306197
28-0.028338-0.25970.397858
290.0194010.17780.429651
30-0.009566-0.08770.465173
31-0.041952-0.38450.350792
32-0.048579-0.44520.328647
33-0.064397-0.59020.278318
34-0.027418-0.25130.401102
350.0374240.3430.36623
360.0631870.57910.282031


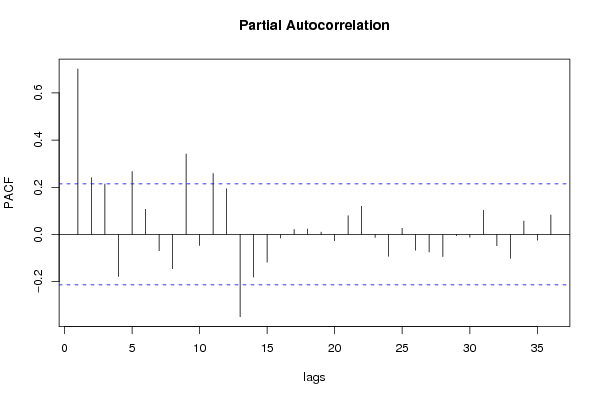
Partial Autocorrelation Function
Time lag kPACF(k)T-STATP-value
10.7019616.43360
20.2404062.20340.015153
30.2134741.95650.026863
4-0.178836-1.63910.052471
50.2668372.44560.008275
60.1064780.97590.165962
7-0.069186-0.63410.26387
8-0.145767-1.3360.092583
90.3409863.12520.00122
10-0.046893-0.42980.334227
110.258472.36890.010067
120.1940311.77830.039484
13-0.348998-3.19860.000974
14-0.180804-1.65710.050615
15-0.118082-1.08220.141122
16-0.015626-0.14320.443231
170.0210230.19270.423839
180.022660.20770.417991
190.0096540.08850.464854
20-0.027221-0.24950.401796
210.0794490.72820.234269
220.1192471.09290.138778
23-0.012648-0.11590.453998
24-0.093097-0.85320.197974
250.0257640.23610.406954
26-0.066895-0.61310.270732
27-0.074725-0.68490.247656
28-0.093882-0.86040.195998
29-0.005375-0.04930.480413
30-0.011619-0.10650.457725
310.1022470.93710.175695
32-0.047994-0.43990.330581
33-0.10161-0.93130.17719
340.0566910.51960.302362
35-0.024744-0.22680.41057
360.0824320.75550.22603

\begin{tabular}{lllllllll}
\hline
Partial Autocorrelation Function \tabularnewline
Time lag k & PACF(k) & T-STAT & P-value \tabularnewline
1 & 0.701961 & 6.4336 & 0 \tabularnewline
2 & 0.240406 & 2.2034 & 0.015153 \tabularnewline
3 & 0.213474 & 1.9565 & 0.026863 \tabularnewline
4 & -0.178836 & -1.6391 & 0.052471 \tabularnewline
5 & 0.266837 & 2.4456 & 0.008275 \tabularnewline
6 & 0.106478 & 0.9759 & 0.165962 \tabularnewline
7 & -0.069186 & -0.6341 & 0.26387 \tabularnewline
8 & -0.145767 & -1.336 & 0.092583 \tabularnewline
9 & 0.340986 & 3.1252 & 0.00122 \tabularnewline
10 & -0.046893 & -0.4298 & 0.334227 \tabularnewline
11 & 0.25847 & 2.3689 & 0.010067 \tabularnewline
12 & 0.194031 & 1.7783 & 0.039484 \tabularnewline
13 & -0.348998 & -3.1986 & 0.000974 \tabularnewline
14 & -0.180804 & -1.6571 & 0.050615 \tabularnewline
15 & -0.118082 & -1.0822 & 0.141122 \tabularnewline
16 & -0.015626 & -0.1432 & 0.443231 \tabularnewline
17 & 0.021023 & 0.1927 & 0.423839 \tabularnewline
18 & 0.02266 & 0.2077 & 0.417991 \tabularnewline
19 & 0.009654 & 0.0885 & 0.464854 \tabularnewline
20 & -0.027221 & -0.2495 & 0.401796 \tabularnewline
21 & 0.079449 & 0.7282 & 0.234269 \tabularnewline
22 & 0.119247 & 1.0929 & 0.138778 \tabularnewline
23 & -0.012648 & -0.1159 & 0.453998 \tabularnewline
24 & -0.093097 & -0.8532 & 0.197974 \tabularnewline
25 & 0.025764 & 0.2361 & 0.406954 \tabularnewline
26 & -0.066895 & -0.6131 & 0.270732 \tabularnewline
27 & -0.074725 & -0.6849 & 0.247656 \tabularnewline
28 & -0.093882 & -0.8604 & 0.195998 \tabularnewline
29 & -0.005375 & -0.0493 & 0.480413 \tabularnewline
30 & -0.011619 & -0.1065 & 0.457725 \tabularnewline
31 & 0.102247 & 0.9371 & 0.175695 \tabularnewline
32 & -0.047994 & -0.4399 & 0.330581 \tabularnewline
33 & -0.10161 & -0.9313 & 0.17719 \tabularnewline
34 & 0.056691 & 0.5196 & 0.302362 \tabularnewline
35 & -0.024744 & -0.2268 & 0.41057 \tabularnewline
36 & 0.082432 & 0.7555 & 0.22603 \tabularnewline
\hline
\end{tabular}
%Source: https://freestatistics.org/blog/index.php?pk=32356&T=2

[TABLE]
[ROW][C]Partial Autocorrelation Function[/C][/ROW]
[ROW][C]Time lag k[/C][C]PACF(k)[/C][C]T-STAT[/C][C]P-value[/C][/ROW]
[ROW][C]1[/C][C]0.701961[/C][C]6.4336[/C][C]0[/C][/ROW]
[ROW][C]2[/C][C]0.240406[/C][C]2.2034[/C][C]0.015153[/C][/ROW]
[ROW][C]3[/C][C]0.213474[/C][C]1.9565[/C][C]0.026863[/C][/ROW]
[ROW][C]4[/C][C]-0.178836[/C][C]-1.6391[/C][C]0.052471[/C][/ROW]
[ROW][C]5[/C][C]0.266837[/C][C]2.4456[/C][C]0.008275[/C][/ROW]
[ROW][C]6[/C][C]0.106478[/C][C]0.9759[/C][C]0.165962[/C][/ROW]
[ROW][C]7[/C][C]-0.069186[/C][C]-0.6341[/C][C]0.26387[/C][/ROW]
[ROW][C]8[/C][C]-0.145767[/C][C]-1.336[/C][C]0.092583[/C][/ROW]
[ROW][C]9[/C][C]0.340986[/C][C]3.1252[/C][C]0.00122[/C][/ROW]
[ROW][C]10[/C][C]-0.046893[/C][C]-0.4298[/C][C]0.334227[/C][/ROW]
[ROW][C]11[/C][C]0.25847[/C][C]2.3689[/C][C]0.010067[/C][/ROW]
[ROW][C]12[/C][C]0.194031[/C][C]1.7783[/C][C]0.039484[/C][/ROW]
[ROW][C]13[/C][C]-0.348998[/C][C]-3.1986[/C][C]0.000974[/C][/ROW]
[ROW][C]14[/C][C]-0.180804[/C][C]-1.6571[/C][C]0.050615[/C][/ROW]
[ROW][C]15[/C][C]-0.118082[/C][C]-1.0822[/C][C]0.141122[/C][/ROW]
[ROW][C]16[/C][C]-0.015626[/C][C]-0.1432[/C][C]0.443231[/C][/ROW]
[ROW][C]17[/C][C]0.021023[/C][C]0.1927[/C][C]0.423839[/C][/ROW]
[ROW][C]18[/C][C]0.02266[/C][C]0.2077[/C][C]0.417991[/C][/ROW]
[ROW][C]19[/C][C]0.009654[/C][C]0.0885[/C][C]0.464854[/C][/ROW]
[ROW][C]20[/C][C]-0.027221[/C][C]-0.2495[/C][C]0.401796[/C][/ROW]
[ROW][C]21[/C][C]0.079449[/C][C]0.7282[/C][C]0.234269[/C][/ROW]
[ROW][C]22[/C][C]0.119247[/C][C]1.0929[/C][C]0.138778[/C][/ROW]
[ROW][C]23[/C][C]-0.012648[/C][C]-0.1159[/C][C]0.453998[/C][/ROW]
[ROW][C]24[/C][C]-0.093097[/C][C]-0.8532[/C][C]0.197974[/C][/ROW]
[ROW][C]25[/C][C]0.025764[/C][C]0.2361[/C][C]0.406954[/C][/ROW]
[ROW][C]26[/C][C]-0.066895[/C][C]-0.6131[/C][C]0.270732[/C][/ROW]
[ROW][C]27[/C][C]-0.074725[/C][C]-0.6849[/C][C]0.247656[/C][/ROW]
[ROW][C]28[/C][C]-0.093882[/C][C]-0.8604[/C][C]0.195998[/C][/ROW]
[ROW][C]29[/C][C]-0.005375[/C][C]-0.0493[/C][C]0.480413[/C][/ROW]
[ROW][C]30[/C][C]-0.011619[/C][C]-0.1065[/C][C]0.457725[/C][/ROW]
[ROW][C]31[/C][C]0.102247[/C][C]0.9371[/C][C]0.175695[/C][/ROW]
[ROW][C]32[/C][C]-0.047994[/C][C]-0.4399[/C][C]0.330581[/C][/ROW]
[ROW][C]33[/C][C]-0.10161[/C][C]-0.9313[/C][C]0.17719[/C][/ROW]
[ROW][C]34[/C][C]0.056691[/C][C]0.5196[/C][C]0.302362[/C][/ROW]
[ROW][C]35[/C][C]-0.024744[/C][C]-0.2268[/C][C]0.41057[/C][/ROW]
[ROW][C]36[/C][C]0.082432[/C][C]0.7555[/C][C]0.22603[/C][/ROW]
[/TABLE]
Source: https://freestatistics.org/blog/index.php?pk=32356&T=2

Globally Unique Identifier (entire table): ba.freestatistics.org/blog/index.php?pk=32356&T=2

As an alternative you can also use a QR Code:  

The GUIDs for individual cells are displayed in the table below:

Partial Autocorrelation Function
Time lag kPACF(k)T-STATP-value
10.7019616.43360
20.2404062.20340.015153
30.2134741.95650.026863
4-0.178836-1.63910.052471
50.2668372.44560.008275
60.1064780.97590.165962
7-0.069186-0.63410.26387
8-0.145767-1.3360.092583
90.3409863.12520.00122
10-0.046893-0.42980.334227
110.258472.36890.010067
120.1940311.77830.039484
13-0.348998-3.19860.000974
14-0.180804-1.65710.050615
15-0.118082-1.08220.141122
16-0.015626-0.14320.443231
170.0210230.19270.423839
180.022660.20770.417991
190.0096540.08850.464854
20-0.027221-0.24950.401796
210.0794490.72820.234269
220.1192471.09290.138778
23-0.012648-0.11590.453998
24-0.093097-0.85320.197974
250.0257640.23610.406954
26-0.066895-0.61310.270732
27-0.074725-0.68490.247656
28-0.093882-0.86040.195998
29-0.005375-0.04930.480413
30-0.011619-0.10650.457725
310.1022470.93710.175695
32-0.047994-0.43990.330581
33-0.10161-0.93130.17719
340.0566910.51960.302362
35-0.024744-0.22680.41057
360.0824320.75550.22603


Parameters (Session):
par1 = 36 ; par2 = 1 ; par3 = 0 ; par4 = 0 ; par5 = 12 ;
Parameters (R input):
par1 = 36 ; par2 = 1 ; par3 = 0 ; par4 = 0 ; par5 = 12 ;
R code (references can be found in the software module):
if (par1 == 'Default') {
par1 = 10*log10(length(x))
} else {
par1 <- as.numeric(par1)
}
par2 <- as.numeric(par2)
par3 <- as.numeric(par3)
par4 <- as.numeric(par4)
par5 <- as.numeric(par5)
if (par2 == 0) {
x <- log(x)
} else {
x <- (x ^ par2 - 1) / par2
}
if (par3 > 0) x <- diff(x,lag=1,difference=par3)
if (par4 > 0) x <- diff(x,lag=par5,difference=par4)
bitmap(file='pic1.png')
racf <- acf(x,par1,main='Autocorrelation',xlab='lags',ylab='ACF')
dev.off()
bitmap(file='pic2.png')
rpacf <- pacf(x,par1,main='Partial Autocorrelation',xlab='lags',ylab='PACF')
dev.off()
(myacf <- c(racf$acf))
(mypacf <- c(rpacf$acf))
lengthx <- length(x)
sqrtn <- sqrt(lengthx)
load(file='createtable')
a<-table.start()
a<-table.row.start(a)
a<-table.element(a,'Autocorrelation Function',4,TRUE)
a<-table.row.end(a)
a<-table.row.start(a)
a<-table.element(a,'Time lag k',header=TRUE)
a<-table.element(a,hyperlink('basics.htm','ACF(k)','click here for more information about the Autocorrelation Function'),header=TRUE)
a<-table.element(a,'T-STAT',header=TRUE)
a<-table.element(a,'P-value',header=TRUE)
a<-table.row.end(a)
for (i in 2:(par1+1)) {
a<-table.row.start(a)
a<-table.element(a,i-1,header=TRUE)
a<-table.element(a,round(myacf[i],6))
mytstat <- myacf[i]*sqrtn
a<-table.element(a,round(mytstat,4))
a<-table.element(a,round(1-pt(abs(mytstat),lengthx),6))
a<-table.row.end(a)
}
a<-table.end(a)
table.save(a,file='mytable.tab')
a<-table.start()
a<-table.row.start(a)
a<-table.element(a,'Partial Autocorrelation Function',4,TRUE)
a<-table.row.end(a)
a<-table.row.start(a)
a<-table.element(a,'Time lag k',header=TRUE)
a<-table.element(a,hyperlink('basics.htm','PACF(k)','click here for more information about the Partial Autocorrelation Function'),header=TRUE)
a<-table.element(a,'T-STAT',header=TRUE)
a<-table.element(a,'P-value',header=TRUE)
a<-table.row.end(a)
for (i in 1:par1) {
a<-table.row.start(a)
a<-table.element(a,i,header=TRUE)
a<-table.element(a,round(mypacf[i],6))
mytstat <- mypacf[i]*sqrtn
a<-table.element(a,round(mytstat,4))
a<-table.element(a,round(1-pt(abs(mytstat),lengthx),6))
a<-table.row.end(a)
}
a<-table.end(a)
table.save(a,file='mytable1.tab')