Free Statistics

of Irreproducible Research!

Author's title

Author*The author of this computation has been verified*
R Software Modulerwasp_arimabackwardselection.wasp
Title produced by softwareARIMA Backward Selection
Date of computationThu, 11 Dec 2008 08:57:30 -0700
Cite this page as followsStatistical Computations at FreeStatistics.org, Office for Research Development and Education, URL https://freestatistics.org/blog/index.php?v=date/2008/Dec/11/t1229011119r511b062ravoscx.htm/, Retrieved Sun, 19 May 2024 05:39:32 +0000
Statistical Computations at FreeStatistics.org, Office for Research Development and Education, URL https://freestatistics.org/blog/index.php?pk=32322, Retrieved Sun, 19 May 2024 05:39:32 +0000
QR Codes:

Original text written by user:
IsPrivate?No (this computation is public)
User-defined keywords
Estimated Impact195
Family? (F = Feedback message, R = changed R code, M = changed R Module, P = changed Parameters, D = changed Data)
-     [Univariate Data Series] [Uitvoer.Nederland] [2008-12-03 15:11:10] [988ab43f527fc78aae41c84649095267]
-   P   [Univariate Data Series] [Export From Belgi...] [2008-12-03 15:52:29] [988ab43f527fc78aae41c84649095267]
- RMP     [Variance Reduction Matrix] [Variance Reductio...] [2008-12-03 15:56:08] [988ab43f527fc78aae41c84649095267]
- RMP       [(Partial) Autocorrelation Function] [Partial Autocorre...] [2008-12-03 16:40:39] [988ab43f527fc78aae41c84649095267]
- RMP           [ARIMA Backward Selection] [ARMA backward sel...] [2008-12-11 15:57:30] [5d823194959040fa9b19b8c8302177e6] [Current]
-   P             [ARIMA Backward Selection] [ARMA backward sel...] [2008-12-11 16:11:26] [988ab43f527fc78aae41c84649095267]
-   PD              [ARIMA Backward Selection] [ARMA backward sel...] [2008-12-11 17:31:33] [988ab43f527fc78aae41c84649095267]
-   PD                [ARIMA Backward Selection] [ARMA backward sel...] [2008-12-12 19:07:08] [988ab43f527fc78aae41c84649095267]
-   PD                [ARIMA Backward Selection] [ARMA backward sel...] [2008-12-12 19:09:17] [988ab43f527fc78aae41c84649095267]
Feedback Forum

Post a new message
Dataseries X:
2236
2084.9
2409.5
2199.3
2203.5
2254.1
1975.8
1742.2
2520.6
2438.1
2126.3
2267.5
2201.1
2128.5
2596
2458.2
2210.5
2621.2
2231.4
2103.6
2685.8
2539.3
2462.4
2693.3
2307.7
2385.9
2737.6
2653.9
2545.4
2848.8
2359.5
2488.3
2861.1
2717.9
2844
2749
2652.9
2660.2
3187.1
2774.1
3158.2
3244.6
2665.5
2820.8
2983.4
3077.4
3024.8
2731.8
3046.2
2834.8
3292.8
2946.1
3196.9
3284.2
3003
2979
3137.4
3630.2
3270.7
2942.3


Summary of computational transaction
Raw Inputview raw input (R code)
Raw Outputview raw output of R engine
Computing time3 seconds
R Server'Gwilym Jenkins' @ 72.249.127.135

\begin{tabular}{lllllllll}
\hline
Summary of computational transaction \tabularnewline
Raw Input & view raw input (R code)  \tabularnewline
Raw Output & view raw output of R engine  \tabularnewline
Computing time & 3 seconds \tabularnewline
R Server & 'Gwilym Jenkins' @ 72.249.127.135 \tabularnewline
\hline
\end{tabular}
%Source: https://freestatistics.org/blog/index.php?pk=32322&T=0

[TABLE]
[ROW][C]Summary of computational transaction[/C][/ROW]
[ROW][C]Raw Input[/C][C]view raw input (R code) [/C][/ROW]
[ROW][C]Raw Output[/C][C]view raw output of R engine [/C][/ROW]
[ROW][C]Computing time[/C][C]3 seconds[/C][/ROW]
[ROW][C]R Server[/C][C]'Gwilym Jenkins' @ 72.249.127.135[/C][/ROW]
[/TABLE]
Source: https://freestatistics.org/blog/index.php?pk=32322&T=0

Globally Unique Identifier (entire table): ba.freestatistics.org/blog/index.php?pk=32322&T=0

As an alternative you can also use a QR Code:  

The GUIDs for individual cells are displayed in the table below:

Summary of computational transaction
Raw Inputview raw input (R code)
Raw Outputview raw output of R engine
Computing time3 seconds
R Server'Gwilym Jenkins' @ 72.249.127.135


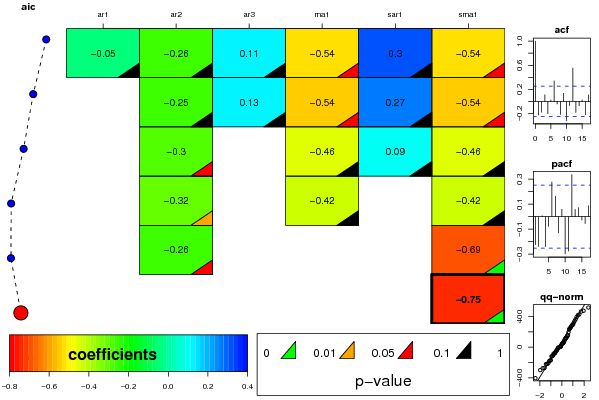
ARIMA Parameter Estimation and Backward Selection
Iterationar1ar2ar3ma1sar1sma1
Estimates ( 1 )-0.0477-0.26340.1129-0.53540.3047-0.5354
(p-val)(0.9043 )(0.191 )(0.577 )(0.0913 )(0.5189 )(0.0913 )
Estimates ( 2 )0-0.24830.1269-0.54030.2702-0.5403
(p-val)(NA )(0.1187 )(0.4637 )(0.0725 )(0.461 )(0.0725 )
Estimates ( 3 )0-0.29530-0.45970.0901-0.4597
(p-val)(NA )(0.0503 )(NA )(0.1406 )(0.7581 )(0.1406 )
Estimates ( 4 )0-0.31680-0.42290-0.4229
(p-val)(NA )(0.0188 )(NA )(0.393 )(NA )(0.393 )
Estimates ( 5 )0-0.2644000-0.686
(p-val)(NA )(0.0541 )(NA )(NA )(NA )(0 )
Estimates ( 6 )00000-0.7463
(p-val)(NA )(NA )(NA )(NA )(NA )(0 )
Estimates ( 7 )NANANANANANA
(p-val)(NA )(NA )(NA )(NA )(NA )(NA )
Estimates ( 8 )NANANANANANA
(p-val)(NA )(NA )(NA )(NA )(NA )(NA )
Estimates ( 9 )NANANANANANA
(p-val)(NA )(NA )(NA )(NA )(NA )(NA )
Estimates ( 10 )NANANANANANA
(p-val)(NA )(NA )(NA )(NA )(NA )(NA )
Estimates ( 11 )NANANANANANA
(p-val)(NA )(NA )(NA )(NA )(NA )(NA )

\begin{tabular}{lllllllll}
\hline
ARIMA Parameter Estimation and Backward Selection \tabularnewline
Iteration & ar1 & ar2 & ar3 & ma1 & sar1 & sma1 \tabularnewline
Estimates ( 1 ) & -0.0477 & -0.2634 & 0.1129 & -0.5354 & 0.3047 & -0.5354 \tabularnewline
(p-val) & (0.9043 ) & (0.191 ) & (0.577 ) & (0.0913 ) & (0.5189 ) & (0.0913 ) \tabularnewline
Estimates ( 2 ) & 0 & -0.2483 & 0.1269 & -0.5403 & 0.2702 & -0.5403 \tabularnewline
(p-val) & (NA ) & (0.1187 ) & (0.4637 ) & (0.0725 ) & (0.461 ) & (0.0725 ) \tabularnewline
Estimates ( 3 ) & 0 & -0.2953 & 0 & -0.4597 & 0.0901 & -0.4597 \tabularnewline
(p-val) & (NA ) & (0.0503 ) & (NA ) & (0.1406 ) & (0.7581 ) & (0.1406 ) \tabularnewline
Estimates ( 4 ) & 0 & -0.3168 & 0 & -0.4229 & 0 & -0.4229 \tabularnewline
(p-val) & (NA ) & (0.0188 ) & (NA ) & (0.393 ) & (NA ) & (0.393 ) \tabularnewline
Estimates ( 5 ) & 0 & -0.2644 & 0 & 0 & 0 & -0.686 \tabularnewline
(p-val) & (NA ) & (0.0541 ) & (NA ) & (NA ) & (NA ) & (0 ) \tabularnewline
Estimates ( 6 ) & 0 & 0 & 0 & 0 & 0 & -0.7463 \tabularnewline
(p-val) & (NA ) & (NA ) & (NA ) & (NA ) & (NA ) & (0 ) \tabularnewline
Estimates ( 7 ) & NA & NA & NA & NA & NA & NA \tabularnewline
(p-val) & (NA ) & (NA ) & (NA ) & (NA ) & (NA ) & (NA ) \tabularnewline
Estimates ( 8 ) & NA & NA & NA & NA & NA & NA \tabularnewline
(p-val) & (NA ) & (NA ) & (NA ) & (NA ) & (NA ) & (NA ) \tabularnewline
Estimates ( 9 ) & NA & NA & NA & NA & NA & NA \tabularnewline
(p-val) & (NA ) & (NA ) & (NA ) & (NA ) & (NA ) & (NA ) \tabularnewline
Estimates ( 10 ) & NA & NA & NA & NA & NA & NA \tabularnewline
(p-val) & (NA ) & (NA ) & (NA ) & (NA ) & (NA ) & (NA ) \tabularnewline
Estimates ( 11 ) & NA & NA & NA & NA & NA & NA \tabularnewline
(p-val) & (NA ) & (NA ) & (NA ) & (NA ) & (NA ) & (NA ) \tabularnewline
\hline
\end{tabular}
%Source: https://freestatistics.org/blog/index.php?pk=32322&T=1

[TABLE]
[ROW][C]ARIMA Parameter Estimation and Backward Selection[/C][/ROW]
[ROW][C]Iteration[/C][C]ar1[/C][C]ar2[/C][C]ar3[/C][C]ma1[/C][C]sar1[/C][C]sma1[/C][/ROW]
[ROW][C]Estimates ( 1 )[/C][C]-0.0477[/C][C]-0.2634[/C][C]0.1129[/C][C]-0.5354[/C][C]0.3047[/C][C]-0.5354[/C][/ROW]
[ROW][C](p-val)[/C][C](0.9043 )[/C][C](0.191 )[/C][C](0.577 )[/C][C](0.0913 )[/C][C](0.5189 )[/C][C](0.0913 )[/C][/ROW]
[ROW][C]Estimates ( 2 )[/C][C]0[/C][C]-0.2483[/C][C]0.1269[/C][C]-0.5403[/C][C]0.2702[/C][C]-0.5403[/C][/ROW]
[ROW][C](p-val)[/C][C](NA )[/C][C](0.1187 )[/C][C](0.4637 )[/C][C](0.0725 )[/C][C](0.461 )[/C][C](0.0725 )[/C][/ROW]
[ROW][C]Estimates ( 3 )[/C][C]0[/C][C]-0.2953[/C][C]0[/C][C]-0.4597[/C][C]0.0901[/C][C]-0.4597[/C][/ROW]
[ROW][C](p-val)[/C][C](NA )[/C][C](0.0503 )[/C][C](NA )[/C][C](0.1406 )[/C][C](0.7581 )[/C][C](0.1406 )[/C][/ROW]
[ROW][C]Estimates ( 4 )[/C][C]0[/C][C]-0.3168[/C][C]0[/C][C]-0.4229[/C][C]0[/C][C]-0.4229[/C][/ROW]
[ROW][C](p-val)[/C][C](NA )[/C][C](0.0188 )[/C][C](NA )[/C][C](0.393 )[/C][C](NA )[/C][C](0.393 )[/C][/ROW]
[ROW][C]Estimates ( 5 )[/C][C]0[/C][C]-0.2644[/C][C]0[/C][C]0[/C][C]0[/C][C]-0.686[/C][/ROW]
[ROW][C](p-val)[/C][C](NA )[/C][C](0.0541 )[/C][C](NA )[/C][C](NA )[/C][C](NA )[/C][C](0 )[/C][/ROW]
[ROW][C]Estimates ( 6 )[/C][C]0[/C][C]0[/C][C]0[/C][C]0[/C][C]0[/C][C]-0.7463[/C][/ROW]
[ROW][C](p-val)[/C][C](NA )[/C][C](NA )[/C][C](NA )[/C][C](NA )[/C][C](NA )[/C][C](0 )[/C][/ROW]
[ROW][C]Estimates ( 7 )[/C][C]NA[/C][C]NA[/C][C]NA[/C][C]NA[/C][C]NA[/C][C]NA[/C][/ROW]
[ROW][C](p-val)[/C][C](NA )[/C][C](NA )[/C][C](NA )[/C][C](NA )[/C][C](NA )[/C][C](NA )[/C][/ROW]
[ROW][C]Estimates ( 8 )[/C][C]NA[/C][C]NA[/C][C]NA[/C][C]NA[/C][C]NA[/C][C]NA[/C][/ROW]
[ROW][C](p-val)[/C][C](NA )[/C][C](NA )[/C][C](NA )[/C][C](NA )[/C][C](NA )[/C][C](NA )[/C][/ROW]
[ROW][C]Estimates ( 9 )[/C][C]NA[/C][C]NA[/C][C]NA[/C][C]NA[/C][C]NA[/C][C]NA[/C][/ROW]
[ROW][C](p-val)[/C][C](NA )[/C][C](NA )[/C][C](NA )[/C][C](NA )[/C][C](NA )[/C][C](NA )[/C][/ROW]
[ROW][C]Estimates ( 10 )[/C][C]NA[/C][C]NA[/C][C]NA[/C][C]NA[/C][C]NA[/C][C]NA[/C][/ROW]
[ROW][C](p-val)[/C][C](NA )[/C][C](NA )[/C][C](NA )[/C][C](NA )[/C][C](NA )[/C][C](NA )[/C][/ROW]
[ROW][C]Estimates ( 11 )[/C][C]NA[/C][C]NA[/C][C]NA[/C][C]NA[/C][C]NA[/C][C]NA[/C][/ROW]
[ROW][C](p-val)[/C][C](NA )[/C][C](NA )[/C][C](NA )[/C][C](NA )[/C][C](NA )[/C][C](NA )[/C][/ROW]
[/TABLE]
Source: https://freestatistics.org/blog/index.php?pk=32322&T=1

Globally Unique Identifier (entire table): ba.freestatistics.org/blog/index.php?pk=32322&T=1

As an alternative you can also use a QR Code:  

The GUIDs for individual cells are displayed in the table below:

ARIMA Parameter Estimation and Backward Selection
Iterationar1ar2ar3ma1sar1sma1
Estimates ( 1 )-0.0477-0.26340.1129-0.53540.3047-0.5354
(p-val)(0.9043 )(0.191 )(0.577 )(0.0913 )(0.5189 )(0.0913 )
Estimates ( 2 )0-0.24830.1269-0.54030.2702-0.5403
(p-val)(NA )(0.1187 )(0.4637 )(0.0725 )(0.461 )(0.0725 )
Estimates ( 3 )0-0.29530-0.45970.0901-0.4597
(p-val)(NA )(0.0503 )(NA )(0.1406 )(0.7581 )(0.1406 )
Estimates ( 4 )0-0.31680-0.42290-0.4229
(p-val)(NA )(0.0188 )(NA )(0.393 )(NA )(0.393 )
Estimates ( 5 )0-0.2644000-0.686
(p-val)(NA )(0.0541 )(NA )(NA )(NA )(0 )
Estimates ( 6 )00000-0.7463
(p-val)(NA )(NA )(NA )(NA )(NA )(0 )
Estimates ( 7 )NANANANANANA
(p-val)(NA )(NA )(NA )(NA )(NA )(NA )
Estimates ( 8 )NANANANANANA
(p-val)(NA )(NA )(NA )(NA )(NA )(NA )
Estimates ( 9 )NANANANANANA
(p-val)(NA )(NA )(NA )(NA )(NA )(NA )
Estimates ( 10 )NANANANANANA
(p-val)(NA )(NA )(NA )(NA )(NA )(NA )
Estimates ( 11 )NANANANANANA
(p-val)(NA )(NA )(NA )(NA )(NA )(NA )


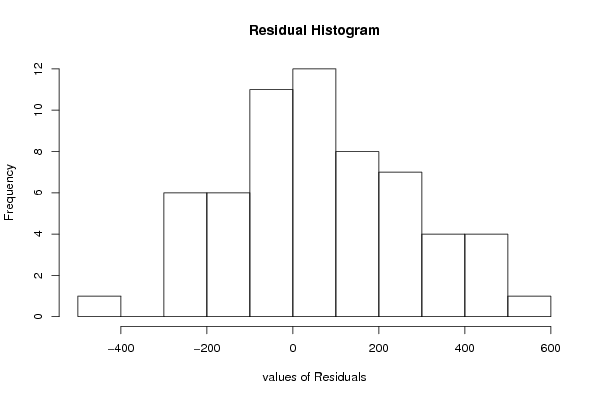
Estimated ARIMA Residuals
Value
2.23599823226102
-120.163506289528
230.931093424227
-108.975282545058
19.2611525694965
7.79599159277012
-270.37781237999
-403.607018827753
428.133409191582
149.010882230805
-3.84285890555476
116.738634271301
-68.750151128829
-82.4307511144428
393.391163912313
112.884458280004
-46.6627390311962
342.256513656203
-220.48353185736
-170.482535498576
362.189534453667
68.1897728459286
123.798807431171
277.100357536549
-215.828225162321
-8.82319609358226
243.704759256103
104.165274346467
55.9415210175648
319.650137471915
-298.691536595470
4.09625270692852
246.252559230643
59.7904347074633
265.676854175983
49.4068710361615
-28.8674725162603
-37.619674046102
475.685151719154
-84.7308322625853
465.269278328387
296.407548429319
-274.206826219536
-9.9751546301995
2.65832292591494
136.880820679851
84.2928025345463
-210.320681577457
156.205497282875
-181.697958695139
416.466678511476
-116.875441470037
291.70148741531
195.760946539856
-80.5953652034686
-56.2119291374806
45.4946984245153
517.666254049055
37.5166389281262
-172.379128196316

\begin{tabular}{lllllllll}
\hline
Estimated ARIMA Residuals \tabularnewline
Value \tabularnewline
2.23599823226102 \tabularnewline
-120.163506289528 \tabularnewline
230.931093424227 \tabularnewline
-108.975282545058 \tabularnewline
19.2611525694965 \tabularnewline
7.79599159277012 \tabularnewline
-270.37781237999 \tabularnewline
-403.607018827753 \tabularnewline
428.133409191582 \tabularnewline
149.010882230805 \tabularnewline
-3.84285890555476 \tabularnewline
116.738634271301 \tabularnewline
-68.750151128829 \tabularnewline
-82.4307511144428 \tabularnewline
393.391163912313 \tabularnewline
112.884458280004 \tabularnewline
-46.6627390311962 \tabularnewline
342.256513656203 \tabularnewline
-220.48353185736 \tabularnewline
-170.482535498576 \tabularnewline
362.189534453667 \tabularnewline
68.1897728459286 \tabularnewline
123.798807431171 \tabularnewline
277.100357536549 \tabularnewline
-215.828225162321 \tabularnewline
-8.82319609358226 \tabularnewline
243.704759256103 \tabularnewline
104.165274346467 \tabularnewline
55.9415210175648 \tabularnewline
319.650137471915 \tabularnewline
-298.691536595470 \tabularnewline
4.09625270692852 \tabularnewline
246.252559230643 \tabularnewline
59.7904347074633 \tabularnewline
265.676854175983 \tabularnewline
49.4068710361615 \tabularnewline
-28.8674725162603 \tabularnewline
-37.619674046102 \tabularnewline
475.685151719154 \tabularnewline
-84.7308322625853 \tabularnewline
465.269278328387 \tabularnewline
296.407548429319 \tabularnewline
-274.206826219536 \tabularnewline
-9.9751546301995 \tabularnewline
2.65832292591494 \tabularnewline
136.880820679851 \tabularnewline
84.2928025345463 \tabularnewline
-210.320681577457 \tabularnewline
156.205497282875 \tabularnewline
-181.697958695139 \tabularnewline
416.466678511476 \tabularnewline
-116.875441470037 \tabularnewline
291.70148741531 \tabularnewline
195.760946539856 \tabularnewline
-80.5953652034686 \tabularnewline
-56.2119291374806 \tabularnewline
45.4946984245153 \tabularnewline
517.666254049055 \tabularnewline
37.5166389281262 \tabularnewline
-172.379128196316 \tabularnewline
\hline
\end{tabular}
%Source: https://freestatistics.org/blog/index.php?pk=32322&T=2

[TABLE]
[ROW][C]Estimated ARIMA Residuals[/C][/ROW]
[ROW][C]Value[/C][/ROW]
[ROW][C]2.23599823226102[/C][/ROW]
[ROW][C]-120.163506289528[/C][/ROW]
[ROW][C]230.931093424227[/C][/ROW]
[ROW][C]-108.975282545058[/C][/ROW]
[ROW][C]19.2611525694965[/C][/ROW]
[ROW][C]7.79599159277012[/C][/ROW]
[ROW][C]-270.37781237999[/C][/ROW]
[ROW][C]-403.607018827753[/C][/ROW]
[ROW][C]428.133409191582[/C][/ROW]
[ROW][C]149.010882230805[/C][/ROW]
[ROW][C]-3.84285890555476[/C][/ROW]
[ROW][C]116.738634271301[/C][/ROW]
[ROW][C]-68.750151128829[/C][/ROW]
[ROW][C]-82.4307511144428[/C][/ROW]
[ROW][C]393.391163912313[/C][/ROW]
[ROW][C]112.884458280004[/C][/ROW]
[ROW][C]-46.6627390311962[/C][/ROW]
[ROW][C]342.256513656203[/C][/ROW]
[ROW][C]-220.48353185736[/C][/ROW]
[ROW][C]-170.482535498576[/C][/ROW]
[ROW][C]362.189534453667[/C][/ROW]
[ROW][C]68.1897728459286[/C][/ROW]
[ROW][C]123.798807431171[/C][/ROW]
[ROW][C]277.100357536549[/C][/ROW]
[ROW][C]-215.828225162321[/C][/ROW]
[ROW][C]-8.82319609358226[/C][/ROW]
[ROW][C]243.704759256103[/C][/ROW]
[ROW][C]104.165274346467[/C][/ROW]
[ROW][C]55.9415210175648[/C][/ROW]
[ROW][C]319.650137471915[/C][/ROW]
[ROW][C]-298.691536595470[/C][/ROW]
[ROW][C]4.09625270692852[/C][/ROW]
[ROW][C]246.252559230643[/C][/ROW]
[ROW][C]59.7904347074633[/C][/ROW]
[ROW][C]265.676854175983[/C][/ROW]
[ROW][C]49.4068710361615[/C][/ROW]
[ROW][C]-28.8674725162603[/C][/ROW]
[ROW][C]-37.619674046102[/C][/ROW]
[ROW][C]475.685151719154[/C][/ROW]
[ROW][C]-84.7308322625853[/C][/ROW]
[ROW][C]465.269278328387[/C][/ROW]
[ROW][C]296.407548429319[/C][/ROW]
[ROW][C]-274.206826219536[/C][/ROW]
[ROW][C]-9.9751546301995[/C][/ROW]
[ROW][C]2.65832292591494[/C][/ROW]
[ROW][C]136.880820679851[/C][/ROW]
[ROW][C]84.2928025345463[/C][/ROW]
[ROW][C]-210.320681577457[/C][/ROW]
[ROW][C]156.205497282875[/C][/ROW]
[ROW][C]-181.697958695139[/C][/ROW]
[ROW][C]416.466678511476[/C][/ROW]
[ROW][C]-116.875441470037[/C][/ROW]
[ROW][C]291.70148741531[/C][/ROW]
[ROW][C]195.760946539856[/C][/ROW]
[ROW][C]-80.5953652034686[/C][/ROW]
[ROW][C]-56.2119291374806[/C][/ROW]
[ROW][C]45.4946984245153[/C][/ROW]
[ROW][C]517.666254049055[/C][/ROW]
[ROW][C]37.5166389281262[/C][/ROW]
[ROW][C]-172.379128196316[/C][/ROW]
[/TABLE]
Source: https://freestatistics.org/blog/index.php?pk=32322&T=2

Globally Unique Identifier (entire table): ba.freestatistics.org/blog/index.php?pk=32322&T=2

As an alternative you can also use a QR Code:  

The GUIDs for individual cells are displayed in the table below:

Estimated ARIMA Residuals
Value
2.23599823226102
-120.163506289528
230.931093424227
-108.975282545058
19.2611525694965
7.79599159277012
-270.37781237999
-403.607018827753
428.133409191582
149.010882230805
-3.84285890555476
116.738634271301
-68.750151128829
-82.4307511144428
393.391163912313
112.884458280004
-46.6627390311962
342.256513656203
-220.48353185736
-170.482535498576
362.189534453667
68.1897728459286
123.798807431171
277.100357536549
-215.828225162321
-8.82319609358226
243.704759256103
104.165274346467
55.9415210175648
319.650137471915
-298.691536595470
4.09625270692852
246.252559230643
59.7904347074633
265.676854175983
49.4068710361615
-28.8674725162603
-37.619674046102
475.685151719154
-84.7308322625853
465.269278328387
296.407548429319
-274.206826219536
-9.9751546301995
2.65832292591494
136.880820679851
84.2928025345463
-210.320681577457
156.205497282875
-181.697958695139
416.466678511476
-116.875441470037
291.70148741531
195.760946539856
-80.5953652034686
-56.2119291374806
45.4946984245153
517.666254049055
37.5166389281262
-172.379128196316


Parameters (Session):
par1 = FALSE ; par2 = 1 ; par3 = 0 ; par4 = 1 ; par5 = 1 ; par6 = 3 ; par7 = 1 ; par8 = 1 ; par9 = 1 ;
Parameters (R input):
par1 = FALSE ; par2 = 1 ; par3 = 0 ; par4 = 1 ; par5 = 1 ; par6 = 3 ; par7 = 1 ; par8 = 1 ; par9 = 1 ;
R code (references can be found in the software module):
library(lattice)
if (par1 == 'TRUE') par1 <- TRUE
if (par1 == 'FALSE') par1 <- FALSE
par2 <- as.numeric(par2) #Box-Cox lambda transformation parameter
par3 <- as.numeric(par3) #degree of non-seasonal differencing
par4 <- as.numeric(par4) #degree of seasonal differencing
par5 <- as.numeric(par5) #seasonal period
par6 <- as.numeric(par6) #degree (p) of the non-seasonal AR(p) polynomial
par7 <- as.numeric(par7) #degree (q) of the non-seasonal MA(q) polynomial
par8 <- as.numeric(par8) #degree (P) of the seasonal AR(P) polynomial
par9 <- as.numeric(par9) #degree (Q) of the seasonal MA(Q) polynomial
armaGR <- function(arima.out, names, n){
try1 <- arima.out$coef
try2 <- sqrt(diag(arima.out$var.coef))
try.data.frame <- data.frame(matrix(NA,ncol=4,nrow=length(names)))
dimnames(try.data.frame) <- list(names,c('coef','std','tstat','pv'))
try.data.frame[,1] <- try1
for(i in 1:length(try2)) try.data.frame[which(rownames(try.data.frame)==names(try2)[i]),2] <- try2[i]
try.data.frame[,3] <- try.data.frame[,1] / try.data.frame[,2]
try.data.frame[,4] <- round((1-pt(abs(try.data.frame[,3]),df=n-(length(try2)+1)))*2,5)
vector <- rep(NA,length(names))
vector[is.na(try.data.frame[,4])] <- 0
maxi <- which.max(try.data.frame[,4])
continue <- max(try.data.frame[,4],na.rm=TRUE) > .05
vector[maxi] <- 0
list(summary=try.data.frame,next.vector=vector,continue=continue)
}
arimaSelect <- function(series, order=c(13,0,0), seasonal=list(order=c(2,0,0),period=12), include.mean=F){
nrc <- order[1]+order[3]+seasonal$order[1]+seasonal$order[3]
coeff <- matrix(NA, nrow=nrc*2, ncol=nrc)
pval <- matrix(NA, nrow=nrc*2, ncol=nrc)
mylist <- rep(list(NULL), nrc)
names <- NULL
if(order[1] > 0) names <- paste('ar',1:order[1],sep='')
if(order[3] > 0) names <- c( names , paste('ma',1:order[3],sep='') )
if(seasonal$order[1] > 0) names <- c(names, paste('sar',1:seasonal$order[1],sep=''))
if(seasonal$order[3] > 0) names <- c(names, paste('sma',1:seasonal$order[3],sep=''))
arima.out <- arima(series, order=order, seasonal=seasonal, include.mean=include.mean, method='ML')
mylist[[1]] <- arima.out
last.arma <- armaGR(arima.out, names, length(series))
mystop <- FALSE
i <- 1
coeff[i,] <- last.arma[[1]][,1]
pval [i,] <- last.arma[[1]][,4]
i <- 2
aic <- arima.out$aic
while(!mystop){
mylist[[i]] <- arima.out
arima.out <- arima(series, order=order, seasonal=seasonal, include.mean=include.mean, method='ML', fixed=last.arma$next.vector)
aic <- c(aic, arima.out$aic)
last.arma <- armaGR(arima.out, names, length(series))
mystop <- !last.arma$continue
coeff[i,] <- last.arma[[1]][,1]
pval [i,] <- last.arma[[1]][,4]
i <- i+1
}
list(coeff, pval, mylist, aic=aic)
}
arimaSelectplot <- function(arimaSelect.out,noms,choix){
noms <- names(arimaSelect.out[[3]][[1]]$coef)
coeff <- arimaSelect.out[[1]]
k <- min(which(is.na(coeff[,1])))-1
coeff <- coeff[1:k,]
pval <- arimaSelect.out[[2]][1:k,]
aic <- arimaSelect.out$aic[1:k]
coeff[coeff==0] <- NA
n <- ncol(coeff)
if(missing(choix)) choix <- k
layout(matrix(c(1,1,1,2,
3,3,3,2,
3,3,3,4,
5,6,7,7),nr=4),
widths=c(10,35,45,15),
heights=c(30,30,15,15))
couleurs <- rainbow(75)[1:50]#(50)
ticks <- pretty(coeff)
par(mar=c(1,1,3,1))
plot(aic,k:1-.5,type='o',pch=21,bg='blue',cex=2,axes=F,lty=2,xpd=NA)
points(aic[choix],k-choix+.5,pch=21,cex=4,bg=2,xpd=NA)
title('aic',line=2)
par(mar=c(3,0,0,0))
plot(0,axes=F,xlab='',ylab='',xlim=range(ticks),ylim=c(.1,1))
rect(xleft = min(ticks) + (0:49)/50*(max(ticks)-min(ticks)),
xright = min(ticks) + (1:50)/50*(max(ticks)-min(ticks)),
ytop = rep(1,50),
ybottom= rep(0,50),col=couleurs,border=NA)
axis(1,ticks)
rect(xleft=min(ticks),xright=max(ticks),ytop=1,ybottom=0)
text(mean(coeff,na.rm=T),.5,'coefficients',cex=2,font=2)
par(mar=c(1,1,3,1))
image(1:n,1:k,t(coeff[k:1,]),axes=F,col=couleurs,zlim=range(ticks))
for(i in 1:n) for(j in 1:k) if(!is.na(coeff[j,i])) {
if(pval[j,i]<.01) symb = 'green'
else if( (pval[j,i]<.05) & (pval[j,i]>=.01)) symb = 'orange'
else if( (pval[j,i]<.1) & (pval[j,i]>=.05)) symb = 'red'
else symb = 'black'
polygon(c(i+.5 ,i+.2 ,i+.5 ,i+.5),
c(k-j+0.5,k-j+0.5,k-j+0.8,k-j+0.5),
col=symb)
if(j==choix) {
rect(xleft=i-.5,
xright=i+.5,
ybottom=k-j+1.5,
ytop=k-j+.5,
lwd=4)
text(i,
k-j+1,
round(coeff[j,i],2),
cex=1.2,
font=2)
}
else{
rect(xleft=i-.5,xright=i+.5,ybottom=k-j+1.5,ytop=k-j+.5)
text(i,k-j+1,round(coeff[j,i],2),cex=1.2,font=1)
}
}
axis(3,1:n,noms)
par(mar=c(0.5,0,0,0.5))
plot(0,axes=F,xlab='',ylab='',type='n',xlim=c(0,8),ylim=c(-.2,.8))
cols <- c('green','orange','red','black')
niv <- c('0','0.01','0.05','0.1')
for(i in 0:3){
polygon(c(1+2*i ,1+2*i ,1+2*i-.5 ,1+2*i),
c(.4 ,.7 , .4 , .4),
col=cols[i+1])
text(2*i,0.5,niv[i+1],cex=1.5)
}
text(8,.5,1,cex=1.5)
text(4,0,'p-value',cex=2)
box()
residus <- arimaSelect.out[[3]][[choix]]$res
par(mar=c(1,2,4,1))
acf(residus,main='')
title('acf',line=.5)
par(mar=c(1,2,4,1))
pacf(residus,main='')
title('pacf',line=.5)
par(mar=c(2,2,4,1))
qqnorm(residus,main='')
title('qq-norm',line=.5)
qqline(residus)
residus
}
if (par2 == 0) x <- log(x)
if (par2 != 0) x <- x^par2
(selection <- arimaSelect(x, order=c(par6,par3,par7), seasonal=list(order=c(par8,par4,par9), period=par5)))
bitmap(file='test1.png')
resid <- arimaSelectplot(selection)
dev.off()
resid
bitmap(file='test2.png')
acf(resid,length(resid)/2, main='Residual Autocorrelation Function')
dev.off()
bitmap(file='test3.png')
pacf(resid,length(resid)/2, main='Residual Partial Autocorrelation Function')
dev.off()
bitmap(file='test4.png')
cpgram(resid, main='Residual Cumulative Periodogram')
dev.off()
bitmap(file='test5.png')
hist(resid, main='Residual Histogram', xlab='values of Residuals')
dev.off()
bitmap(file='test6.png')
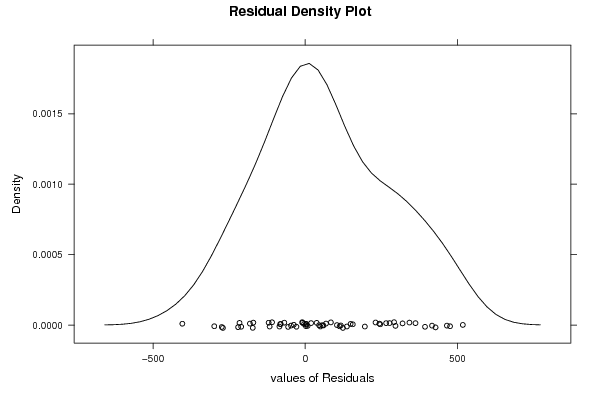
densityplot(~resid,col='black',main='Residual Density Plot', xlab='values of Residuals')
dev.off()
bitmap(file='test7.png')
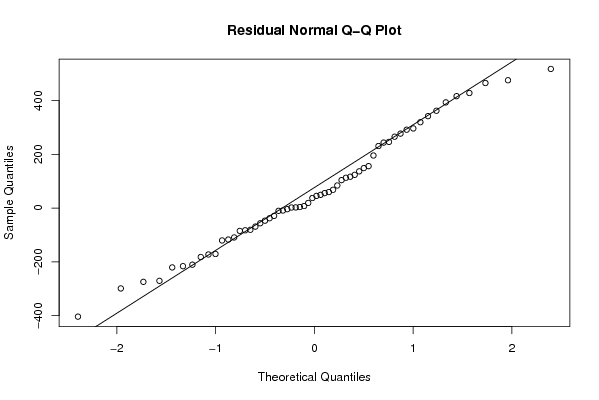
qqnorm(resid, main='Residual Normal Q-Q Plot')
qqline(resid)
dev.off()
ncols <- length(selection[[1]][1,])
nrows <- length(selection[[2]][,1])-1
load(file='createtable')
a<-table.start()
a<-table.row.start(a)
a<-table.element(a,'ARIMA Parameter Estimation and Backward Selection', ncols+1,TRUE)
a<-table.row.end(a)
a<-table.row.start(a)
a<-table.element(a,'Iteration', header=TRUE)
for (i in 1:ncols) {
a<-table.element(a,names(selection[[3]][[1]]$coef)[i],header=TRUE)
}
a<-table.row.end(a)
for (j in 1:nrows) {
a<-table.row.start(a)
mydum <- 'Estimates ('
mydum <- paste(mydum,j)
mydum <- paste(mydum,')')
a<-table.element(a,mydum, header=TRUE)
for (i in 1:ncols) {
a<-table.element(a,round(selection[[1]][j,i],4))
}
a<-table.row.end(a)
a<-table.row.start(a)
a<-table.element(a,'(p-val)', header=TRUE)
for (i in 1:ncols) {
mydum <- '('
mydum <- paste(mydum,round(selection[[2]][j,i],4),sep='')
mydum <- paste(mydum,')')
a<-table.element(a,mydum)
}
a<-table.row.end(a)
}
a<-table.end(a)
table.save(a,file='mytable.tab')
a<-table.start()
a<-table.row.start(a)
a<-table.element(a,'Estimated ARIMA Residuals', 1,TRUE)
a<-table.row.end(a)
a<-table.row.start(a)
a<-table.element(a,'Value', 1,TRUE)
a<-table.row.end(a)
for (i in (par4*par5+par3):length(resid)) {
a<-table.row.start(a)
a<-table.element(a,resid[i])
a<-table.row.end(a)
}
a<-table.end(a)
table.save(a,file='mytable1.tab')