Free Statistics

of Irreproducible Research!

Author's title

Author*The author of this computation has been verified*
R Software Modulerwasp_autocorrelation.wasp
Title produced by software(Partial) Autocorrelation Function
Date of computationThu, 11 Dec 2008 06:58:53 -0700
Cite this page as followsStatistical Computations at FreeStatistics.org, Office for Research Development and Education, URL https://freestatistics.org/blog/index.php?v=date/2008/Dec/11/t1229004533vuk81fme5ra285j.htm/, Retrieved Sun, 19 May 2024 05:51:46 +0000
Statistical Computations at FreeStatistics.org, Office for Research Development and Education, URL https://freestatistics.org/blog/index.php?pk=32243, Retrieved Sun, 19 May 2024 05:51:46 +0000
QR Codes:

Original text written by user:
IsPrivate?No (this computation is public)
User-defined keywords
Estimated Impact185
Family? (F = Feedback message, R = changed R code, M = changed R Module, P = changed Parameters, D = changed Data)
-     [(Partial) Autocorrelation Function] [Autocorrelatie] [2008-12-11 12:13:13] [9f5bfe3b95f9ec3d2ed4c0a560a9648a]
-   PD    [(Partial) Autocorrelation Function] [autocorrelation] [2008-12-11 13:58:53] [a9e6d7cd6e144e8b311d9f96a24c5a25] [Current]
Feedback Forum

Post a new message
Dataseries X:
2648.9
2669.6
3042.3
2604.2
2732.1
2621.7
2483.7
2479.3
2684.6
2834.7
2566.1
2251.2
2350
2299.8
2542.8
2530.2
2508.1
2616.8
2534.1
2181.8
2578.9
2841.9
2529.9
2103.2
2326.2
2452.6
2782.1
2727.3
2648.2
2760.7
2613
2225.4
2713.9
2923.3
2707
2473.9
2521
2531.8
3068.8
2826.9
2674.2
2966.6
2798.8
2629.6
3124.6
3115.7
3083
2863.9
2728.7
2789.4
3225.7
3148.2
2836.5
3153.5
2656.9
2834.7
3172.5
2998.8
3103.1
2735.6
2818.1
2874.4
3438.5
2949.1
3306.8
3530
3003.8
3206.4
3514.6
3522.6
3525.5
2996.2
3231.1
3030
3541.7
3113.2
3390.8
3424.2
3079.8
3123.4
3317.1
3579.9
3317.9
2668.1


Summary of computational transaction
Raw Inputview raw input (R code)
Raw Outputview raw output of R engine
Computing time1 seconds
R Server'George Udny Yule' @ 72.249.76.132

\begin{tabular}{lllllllll}
\hline
Summary of computational transaction \tabularnewline
Raw Input & view raw input (R code)  \tabularnewline
Raw Output & view raw output of R engine  \tabularnewline
Computing time & 1 seconds \tabularnewline
R Server & 'George Udny Yule' @ 72.249.76.132 \tabularnewline
\hline
\end{tabular}
%Source: https://freestatistics.org/blog/index.php?pk=32243&T=0

[TABLE]
[ROW][C]Summary of computational transaction[/C][/ROW]
[ROW][C]Raw Input[/C][C]view raw input (R code) [/C][/ROW]
[ROW][C]Raw Output[/C][C]view raw output of R engine [/C][/ROW]
[ROW][C]Computing time[/C][C]1 seconds[/C][/ROW]
[ROW][C]R Server[/C][C]'George Udny Yule' @ 72.249.76.132[/C][/ROW]
[/TABLE]
Source: https://freestatistics.org/blog/index.php?pk=32243&T=0

Globally Unique Identifier (entire table): ba.freestatistics.org/blog/index.php?pk=32243&T=0

As an alternative you can also use a QR Code:  

The GUIDs for individual cells are displayed in the table below:

Summary of computational transaction
Raw Inputview raw input (R code)
Raw Outputview raw output of R engine
Computing time1 seconds
R Server'George Udny Yule' @ 72.249.76.132


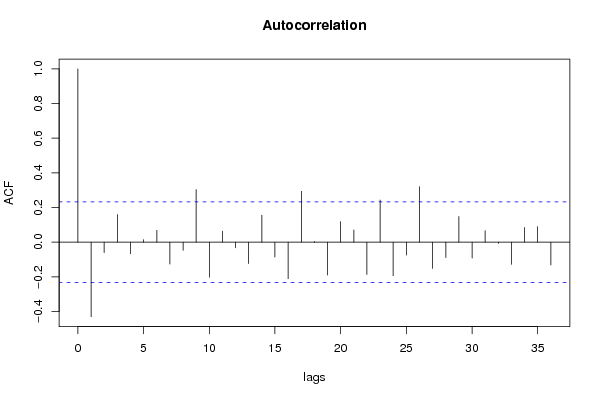
Autocorrelation Function
Time lag kACF(k)T-STATP-value
1-0.43029-3.62570.000269
2-0.060144-0.50680.30694
30.1590721.34040.092201
4-0.066396-0.55950.288802
50.014280.12030.452282
60.0683610.5760.283211
7-0.126717-1.06770.144628
8-0.047079-0.39670.346391
90.30332.55570.006371
10-0.202769-1.70860.04595
110.0630770.53150.298367
12-0.032812-0.27650.391493
13-0.123781-1.0430.150244
140.1556481.31150.096955
15-0.086254-0.72680.234872
16-0.210841-1.77660.039961
170.2936732.47450.007866
180.0037860.03190.487322
19-0.190465-1.60490.056479
200.1186390.99970.160432
210.0705260.59430.277112
22-0.186216-1.56910.060537
230.2432522.04970.022046
24-0.193859-1.63350.053397
25-0.074634-0.62890.265723
260.3203242.69910.004342
27-0.152079-1.28140.102104
28-0.089194-0.75160.2274
290.1475191.2430.108975
30-0.091868-0.77410.220723
310.0659040.55530.290212
32-0.007463-0.06290.475016
33-0.12783-1.07710.142537
340.0846010.71290.239133
350.0889490.74950.228016
36-0.132014-1.11240.134866

\begin{tabular}{lllllllll}
\hline
Autocorrelation Function \tabularnewline
Time lag k & ACF(k) & T-STAT & P-value \tabularnewline
1 & -0.43029 & -3.6257 & 0.000269 \tabularnewline
2 & -0.060144 & -0.5068 & 0.30694 \tabularnewline
3 & 0.159072 & 1.3404 & 0.092201 \tabularnewline
4 & -0.066396 & -0.5595 & 0.288802 \tabularnewline
5 & 0.01428 & 0.1203 & 0.452282 \tabularnewline
6 & 0.068361 & 0.576 & 0.283211 \tabularnewline
7 & -0.126717 & -1.0677 & 0.144628 \tabularnewline
8 & -0.047079 & -0.3967 & 0.346391 \tabularnewline
9 & 0.3033 & 2.5557 & 0.006371 \tabularnewline
10 & -0.202769 & -1.7086 & 0.04595 \tabularnewline
11 & 0.063077 & 0.5315 & 0.298367 \tabularnewline
12 & -0.032812 & -0.2765 & 0.391493 \tabularnewline
13 & -0.123781 & -1.043 & 0.150244 \tabularnewline
14 & 0.155648 & 1.3115 & 0.096955 \tabularnewline
15 & -0.086254 & -0.7268 & 0.234872 \tabularnewline
16 & -0.210841 & -1.7766 & 0.039961 \tabularnewline
17 & 0.293673 & 2.4745 & 0.007866 \tabularnewline
18 & 0.003786 & 0.0319 & 0.487322 \tabularnewline
19 & -0.190465 & -1.6049 & 0.056479 \tabularnewline
20 & 0.118639 & 0.9997 & 0.160432 \tabularnewline
21 & 0.070526 & 0.5943 & 0.277112 \tabularnewline
22 & -0.186216 & -1.5691 & 0.060537 \tabularnewline
23 & 0.243252 & 2.0497 & 0.022046 \tabularnewline
24 & -0.193859 & -1.6335 & 0.053397 \tabularnewline
25 & -0.074634 & -0.6289 & 0.265723 \tabularnewline
26 & 0.320324 & 2.6991 & 0.004342 \tabularnewline
27 & -0.152079 & -1.2814 & 0.102104 \tabularnewline
28 & -0.089194 & -0.7516 & 0.2274 \tabularnewline
29 & 0.147519 & 1.243 & 0.108975 \tabularnewline
30 & -0.091868 & -0.7741 & 0.220723 \tabularnewline
31 & 0.065904 & 0.5553 & 0.290212 \tabularnewline
32 & -0.007463 & -0.0629 & 0.475016 \tabularnewline
33 & -0.12783 & -1.0771 & 0.142537 \tabularnewline
34 & 0.084601 & 0.7129 & 0.239133 \tabularnewline
35 & 0.088949 & 0.7495 & 0.228016 \tabularnewline
36 & -0.132014 & -1.1124 & 0.134866 \tabularnewline
\hline
\end{tabular}
%Source: https://freestatistics.org/blog/index.php?pk=32243&T=1

[TABLE]
[ROW][C]Autocorrelation Function[/C][/ROW]
[ROW][C]Time lag k[/C][C]ACF(k)[/C][C]T-STAT[/C][C]P-value[/C][/ROW]
[ROW][C]1[/C][C]-0.43029[/C][C]-3.6257[/C][C]0.000269[/C][/ROW]
[ROW][C]2[/C][C]-0.060144[/C][C]-0.5068[/C][C]0.30694[/C][/ROW]
[ROW][C]3[/C][C]0.159072[/C][C]1.3404[/C][C]0.092201[/C][/ROW]
[ROW][C]4[/C][C]-0.066396[/C][C]-0.5595[/C][C]0.288802[/C][/ROW]
[ROW][C]5[/C][C]0.01428[/C][C]0.1203[/C][C]0.452282[/C][/ROW]
[ROW][C]6[/C][C]0.068361[/C][C]0.576[/C][C]0.283211[/C][/ROW]
[ROW][C]7[/C][C]-0.126717[/C][C]-1.0677[/C][C]0.144628[/C][/ROW]
[ROW][C]8[/C][C]-0.047079[/C][C]-0.3967[/C][C]0.346391[/C][/ROW]
[ROW][C]9[/C][C]0.3033[/C][C]2.5557[/C][C]0.006371[/C][/ROW]
[ROW][C]10[/C][C]-0.202769[/C][C]-1.7086[/C][C]0.04595[/C][/ROW]
[ROW][C]11[/C][C]0.063077[/C][C]0.5315[/C][C]0.298367[/C][/ROW]
[ROW][C]12[/C][C]-0.032812[/C][C]-0.2765[/C][C]0.391493[/C][/ROW]
[ROW][C]13[/C][C]-0.123781[/C][C]-1.043[/C][C]0.150244[/C][/ROW]
[ROW][C]14[/C][C]0.155648[/C][C]1.3115[/C][C]0.096955[/C][/ROW]
[ROW][C]15[/C][C]-0.086254[/C][C]-0.7268[/C][C]0.234872[/C][/ROW]
[ROW][C]16[/C][C]-0.210841[/C][C]-1.7766[/C][C]0.039961[/C][/ROW]
[ROW][C]17[/C][C]0.293673[/C][C]2.4745[/C][C]0.007866[/C][/ROW]
[ROW][C]18[/C][C]0.003786[/C][C]0.0319[/C][C]0.487322[/C][/ROW]
[ROW][C]19[/C][C]-0.190465[/C][C]-1.6049[/C][C]0.056479[/C][/ROW]
[ROW][C]20[/C][C]0.118639[/C][C]0.9997[/C][C]0.160432[/C][/ROW]
[ROW][C]21[/C][C]0.070526[/C][C]0.5943[/C][C]0.277112[/C][/ROW]
[ROW][C]22[/C][C]-0.186216[/C][C]-1.5691[/C][C]0.060537[/C][/ROW]
[ROW][C]23[/C][C]0.243252[/C][C]2.0497[/C][C]0.022046[/C][/ROW]
[ROW][C]24[/C][C]-0.193859[/C][C]-1.6335[/C][C]0.053397[/C][/ROW]
[ROW][C]25[/C][C]-0.074634[/C][C]-0.6289[/C][C]0.265723[/C][/ROW]
[ROW][C]26[/C][C]0.320324[/C][C]2.6991[/C][C]0.004342[/C][/ROW]
[ROW][C]27[/C][C]-0.152079[/C][C]-1.2814[/C][C]0.102104[/C][/ROW]
[ROW][C]28[/C][C]-0.089194[/C][C]-0.7516[/C][C]0.2274[/C][/ROW]
[ROW][C]29[/C][C]0.147519[/C][C]1.243[/C][C]0.108975[/C][/ROW]
[ROW][C]30[/C][C]-0.091868[/C][C]-0.7741[/C][C]0.220723[/C][/ROW]
[ROW][C]31[/C][C]0.065904[/C][C]0.5553[/C][C]0.290212[/C][/ROW]
[ROW][C]32[/C][C]-0.007463[/C][C]-0.0629[/C][C]0.475016[/C][/ROW]
[ROW][C]33[/C][C]-0.12783[/C][C]-1.0771[/C][C]0.142537[/C][/ROW]
[ROW][C]34[/C][C]0.084601[/C][C]0.7129[/C][C]0.239133[/C][/ROW]
[ROW][C]35[/C][C]0.088949[/C][C]0.7495[/C][C]0.228016[/C][/ROW]
[ROW][C]36[/C][C]-0.132014[/C][C]-1.1124[/C][C]0.134866[/C][/ROW]
[/TABLE]
Source: https://freestatistics.org/blog/index.php?pk=32243&T=1

Globally Unique Identifier (entire table): ba.freestatistics.org/blog/index.php?pk=32243&T=1

As an alternative you can also use a QR Code:  

The GUIDs for individual cells are displayed in the table below:

Autocorrelation Function
Time lag kACF(k)T-STATP-value
1-0.43029-3.62570.000269
2-0.060144-0.50680.30694
30.1590721.34040.092201
4-0.066396-0.55950.288802
50.014280.12030.452282
60.0683610.5760.283211
7-0.126717-1.06770.144628
8-0.047079-0.39670.346391
90.30332.55570.006371
10-0.202769-1.70860.04595
110.0630770.53150.298367
12-0.032812-0.27650.391493
13-0.123781-1.0430.150244
140.1556481.31150.096955
15-0.086254-0.72680.234872
16-0.210841-1.77660.039961
170.2936732.47450.007866
180.0037860.03190.487322
19-0.190465-1.60490.056479
200.1186390.99970.160432
210.0705260.59430.277112
22-0.186216-1.56910.060537
230.2432522.04970.022046
24-0.193859-1.63350.053397
25-0.074634-0.62890.265723
260.3203242.69910.004342
27-0.152079-1.28140.102104
28-0.089194-0.75160.2274
290.1475191.2430.108975
30-0.091868-0.77410.220723
310.0659040.55530.290212
32-0.007463-0.06290.475016
33-0.12783-1.07710.142537
340.0846010.71290.239133
350.0889490.74950.228016
36-0.132014-1.11240.134866


Partial Autocorrelation Function
Time lag kPACF(k)T-STATP-value
1-0.43029-3.62570.000269
2-0.301029-2.53650.006698
3-0.00557-0.04690.481348
40.0030130.02540.489909
50.0354910.29910.382886
60.0970380.81770.208144
7-0.060675-0.51130.30538
8-0.174933-1.4740.072449
90.2201891.85530.033849
100.0773740.6520.258265
110.1170380.98620.163696
12-0.063596-0.53590.296862
13-0.220788-1.86040.033486
14-0.053207-0.44830.327641
15-0.079806-0.67250.251739
16-0.259158-2.18370.016145
170.1250331.05350.147831
180.1791471.50950.067802
19-0.008264-0.06960.472341
20-0.086785-0.73130.233513
210.150431.26750.10455
22-0.015199-0.12810.449229
230.1479521.24670.108309
24-0.025432-0.21430.415465
25-0.089801-0.75670.225875
260.1051930.88640.189204
270.016640.14020.444446
28-0.167571-1.4120.081162
290.0290910.24510.403534
30-0.00488-0.04110.483657
310.0782770.65960.255832
32-0.116828-0.98440.164129
330.0557770.470.319903
340.0566490.47730.317294
35-0.027986-0.23580.407129
36-0.014556-0.12270.451364

\begin{tabular}{lllllllll}
\hline
Partial Autocorrelation Function \tabularnewline
Time lag k & PACF(k) & T-STAT & P-value \tabularnewline
1 & -0.43029 & -3.6257 & 0.000269 \tabularnewline
2 & -0.301029 & -2.5365 & 0.006698 \tabularnewline
3 & -0.00557 & -0.0469 & 0.481348 \tabularnewline
4 & 0.003013 & 0.0254 & 0.489909 \tabularnewline
5 & 0.035491 & 0.2991 & 0.382886 \tabularnewline
6 & 0.097038 & 0.8177 & 0.208144 \tabularnewline
7 & -0.060675 & -0.5113 & 0.30538 \tabularnewline
8 & -0.174933 & -1.474 & 0.072449 \tabularnewline
9 & 0.220189 & 1.8553 & 0.033849 \tabularnewline
10 & 0.077374 & 0.652 & 0.258265 \tabularnewline
11 & 0.117038 & 0.9862 & 0.163696 \tabularnewline
12 & -0.063596 & -0.5359 & 0.296862 \tabularnewline
13 & -0.220788 & -1.8604 & 0.033486 \tabularnewline
14 & -0.053207 & -0.4483 & 0.327641 \tabularnewline
15 & -0.079806 & -0.6725 & 0.251739 \tabularnewline
16 & -0.259158 & -2.1837 & 0.016145 \tabularnewline
17 & 0.125033 & 1.0535 & 0.147831 \tabularnewline
18 & 0.179147 & 1.5095 & 0.067802 \tabularnewline
19 & -0.008264 & -0.0696 & 0.472341 \tabularnewline
20 & -0.086785 & -0.7313 & 0.233513 \tabularnewline
21 & 0.15043 & 1.2675 & 0.10455 \tabularnewline
22 & -0.015199 & -0.1281 & 0.449229 \tabularnewline
23 & 0.147952 & 1.2467 & 0.108309 \tabularnewline
24 & -0.025432 & -0.2143 & 0.415465 \tabularnewline
25 & -0.089801 & -0.7567 & 0.225875 \tabularnewline
26 & 0.105193 & 0.8864 & 0.189204 \tabularnewline
27 & 0.01664 & 0.1402 & 0.444446 \tabularnewline
28 & -0.167571 & -1.412 & 0.081162 \tabularnewline
29 & 0.029091 & 0.2451 & 0.403534 \tabularnewline
30 & -0.00488 & -0.0411 & 0.483657 \tabularnewline
31 & 0.078277 & 0.6596 & 0.255832 \tabularnewline
32 & -0.116828 & -0.9844 & 0.164129 \tabularnewline
33 & 0.055777 & 0.47 & 0.319903 \tabularnewline
34 & 0.056649 & 0.4773 & 0.317294 \tabularnewline
35 & -0.027986 & -0.2358 & 0.407129 \tabularnewline
36 & -0.014556 & -0.1227 & 0.451364 \tabularnewline
\hline
\end{tabular}
%Source: https://freestatistics.org/blog/index.php?pk=32243&T=2

[TABLE]
[ROW][C]Partial Autocorrelation Function[/C][/ROW]
[ROW][C]Time lag k[/C][C]PACF(k)[/C][C]T-STAT[/C][C]P-value[/C][/ROW]
[ROW][C]1[/C][C]-0.43029[/C][C]-3.6257[/C][C]0.000269[/C][/ROW]
[ROW][C]2[/C][C]-0.301029[/C][C]-2.5365[/C][C]0.006698[/C][/ROW]
[ROW][C]3[/C][C]-0.00557[/C][C]-0.0469[/C][C]0.481348[/C][/ROW]
[ROW][C]4[/C][C]0.003013[/C][C]0.0254[/C][C]0.489909[/C][/ROW]
[ROW][C]5[/C][C]0.035491[/C][C]0.2991[/C][C]0.382886[/C][/ROW]
[ROW][C]6[/C][C]0.097038[/C][C]0.8177[/C][C]0.208144[/C][/ROW]
[ROW][C]7[/C][C]-0.060675[/C][C]-0.5113[/C][C]0.30538[/C][/ROW]
[ROW][C]8[/C][C]-0.174933[/C][C]-1.474[/C][C]0.072449[/C][/ROW]
[ROW][C]9[/C][C]0.220189[/C][C]1.8553[/C][C]0.033849[/C][/ROW]
[ROW][C]10[/C][C]0.077374[/C][C]0.652[/C][C]0.258265[/C][/ROW]
[ROW][C]11[/C][C]0.117038[/C][C]0.9862[/C][C]0.163696[/C][/ROW]
[ROW][C]12[/C][C]-0.063596[/C][C]-0.5359[/C][C]0.296862[/C][/ROW]
[ROW][C]13[/C][C]-0.220788[/C][C]-1.8604[/C][C]0.033486[/C][/ROW]
[ROW][C]14[/C][C]-0.053207[/C][C]-0.4483[/C][C]0.327641[/C][/ROW]
[ROW][C]15[/C][C]-0.079806[/C][C]-0.6725[/C][C]0.251739[/C][/ROW]
[ROW][C]16[/C][C]-0.259158[/C][C]-2.1837[/C][C]0.016145[/C][/ROW]
[ROW][C]17[/C][C]0.125033[/C][C]1.0535[/C][C]0.147831[/C][/ROW]
[ROW][C]18[/C][C]0.179147[/C][C]1.5095[/C][C]0.067802[/C][/ROW]
[ROW][C]19[/C][C]-0.008264[/C][C]-0.0696[/C][C]0.472341[/C][/ROW]
[ROW][C]20[/C][C]-0.086785[/C][C]-0.7313[/C][C]0.233513[/C][/ROW]
[ROW][C]21[/C][C]0.15043[/C][C]1.2675[/C][C]0.10455[/C][/ROW]
[ROW][C]22[/C][C]-0.015199[/C][C]-0.1281[/C][C]0.449229[/C][/ROW]
[ROW][C]23[/C][C]0.147952[/C][C]1.2467[/C][C]0.108309[/C][/ROW]
[ROW][C]24[/C][C]-0.025432[/C][C]-0.2143[/C][C]0.415465[/C][/ROW]
[ROW][C]25[/C][C]-0.089801[/C][C]-0.7567[/C][C]0.225875[/C][/ROW]
[ROW][C]26[/C][C]0.105193[/C][C]0.8864[/C][C]0.189204[/C][/ROW]
[ROW][C]27[/C][C]0.01664[/C][C]0.1402[/C][C]0.444446[/C][/ROW]
[ROW][C]28[/C][C]-0.167571[/C][C]-1.412[/C][C]0.081162[/C][/ROW]
[ROW][C]29[/C][C]0.029091[/C][C]0.2451[/C][C]0.403534[/C][/ROW]
[ROW][C]30[/C][C]-0.00488[/C][C]-0.0411[/C][C]0.483657[/C][/ROW]
[ROW][C]31[/C][C]0.078277[/C][C]0.6596[/C][C]0.255832[/C][/ROW]
[ROW][C]32[/C][C]-0.116828[/C][C]-0.9844[/C][C]0.164129[/C][/ROW]
[ROW][C]33[/C][C]0.055777[/C][C]0.47[/C][C]0.319903[/C][/ROW]
[ROW][C]34[/C][C]0.056649[/C][C]0.4773[/C][C]0.317294[/C][/ROW]
[ROW][C]35[/C][C]-0.027986[/C][C]-0.2358[/C][C]0.407129[/C][/ROW]
[ROW][C]36[/C][C]-0.014556[/C][C]-0.1227[/C][C]0.451364[/C][/ROW]
[/TABLE]
Source: https://freestatistics.org/blog/index.php?pk=32243&T=2

Globally Unique Identifier (entire table): ba.freestatistics.org/blog/index.php?pk=32243&T=2

As an alternative you can also use a QR Code:  

The GUIDs for individual cells are displayed in the table below:

Partial Autocorrelation Function
Time lag kPACF(k)T-STATP-value
1-0.43029-3.62570.000269
2-0.301029-2.53650.006698
3-0.00557-0.04690.481348
40.0030130.02540.489909
50.0354910.29910.382886
60.0970380.81770.208144
7-0.060675-0.51130.30538
8-0.174933-1.4740.072449
90.2201891.85530.033849
100.0773740.6520.258265
110.1170380.98620.163696
12-0.063596-0.53590.296862
13-0.220788-1.86040.033486
14-0.053207-0.44830.327641
15-0.079806-0.67250.251739
16-0.259158-2.18370.016145
170.1250331.05350.147831
180.1791471.50950.067802
19-0.008264-0.06960.472341
20-0.086785-0.73130.233513
210.150431.26750.10455
22-0.015199-0.12810.449229
230.1479521.24670.108309
24-0.025432-0.21430.415465
25-0.089801-0.75670.225875
260.1051930.88640.189204
270.016640.14020.444446
28-0.167571-1.4120.081162
290.0290910.24510.403534
30-0.00488-0.04110.483657
310.0782770.65960.255832
32-0.116828-0.98440.164129
330.0557770.470.319903
340.0566490.47730.317294
35-0.027986-0.23580.407129
36-0.014556-0.12270.451364


Parameters (Session):
par1 = 36 ; par2 = 0.0 ; par3 = 1 ; par4 = 1 ; par5 = 12 ;
Parameters (R input):
par1 = 36 ; par2 = 0.0 ; par3 = 1 ; par4 = 1 ; par5 = 12 ;
R code (references can be found in the software module):
if (par1 == 'Default') {
par1 = 10*log10(length(x))
} else {
par1 <- as.numeric(par1)
}
par2 <- as.numeric(par2)
par3 <- as.numeric(par3)
par4 <- as.numeric(par4)
par5 <- as.numeric(par5)
if (par2 == 0) {
x <- log(x)
} else {
x <- (x ^ par2 - 1) / par2
}
if (par3 > 0) x <- diff(x,lag=1,difference=par3)
if (par4 > 0) x <- diff(x,lag=par5,difference=par4)
bitmap(file='pic1.png')
racf <- acf(x,par1,main='Autocorrelation',xlab='lags',ylab='ACF')
dev.off()
bitmap(file='pic2.png')
rpacf <- pacf(x,par1,main='Partial Autocorrelation',xlab='lags',ylab='PACF')
dev.off()
(myacf <- c(racf$acf))
(mypacf <- c(rpacf$acf))
lengthx <- length(x)
sqrtn <- sqrt(lengthx)
load(file='createtable')
a<-table.start()
a<-table.row.start(a)
a<-table.element(a,'Autocorrelation Function',4,TRUE)
a<-table.row.end(a)
a<-table.row.start(a)
a<-table.element(a,'Time lag k',header=TRUE)
a<-table.element(a,hyperlink('basics.htm','ACF(k)','click here for more information about the Autocorrelation Function'),header=TRUE)
a<-table.element(a,'T-STAT',header=TRUE)
a<-table.element(a,'P-value',header=TRUE)
a<-table.row.end(a)
for (i in 2:(par1+1)) {
a<-table.row.start(a)
a<-table.element(a,i-1,header=TRUE)
a<-table.element(a,round(myacf[i],6))
mytstat <- myacf[i]*sqrtn
a<-table.element(a,round(mytstat,4))
a<-table.element(a,round(1-pt(abs(mytstat),lengthx),6))
a<-table.row.end(a)
}
a<-table.end(a)
table.save(a,file='mytable.tab')
a<-table.start()
a<-table.row.start(a)
a<-table.element(a,'Partial Autocorrelation Function',4,TRUE)
a<-table.row.end(a)
a<-table.row.start(a)
a<-table.element(a,'Time lag k',header=TRUE)
a<-table.element(a,hyperlink('basics.htm','PACF(k)','click here for more information about the Partial Autocorrelation Function'),header=TRUE)
a<-table.element(a,'T-STAT',header=TRUE)
a<-table.element(a,'P-value',header=TRUE)
a<-table.row.end(a)
for (i in 1:par1) {
a<-table.row.start(a)
a<-table.element(a,i,header=TRUE)
a<-table.element(a,round(mypacf[i],6))
mytstat <- mypacf[i]*sqrtn
a<-table.element(a,round(mytstat,4))
a<-table.element(a,round(1-pt(abs(mytstat),lengthx),6))
a<-table.row.end(a)
}
a<-table.end(a)
table.save(a,file='mytable1.tab')