Free Statistics

of Irreproducible Research!

Author's title

Author*The author of this computation has been verified*
R Software Modulerwasp_arimabackwardselection.wasp
Title produced by softwareARIMA Backward Selection
Date of computationThu, 11 Dec 2008 06:52:17 -0700
Cite this page as followsStatistical Computations at FreeStatistics.org, Office for Research Development and Education, URL https://freestatistics.org/blog/index.php?v=date/2008/Dec/11/t1229003727evjtmfy9apk6z3p.htm/, Retrieved Sun, 19 May 2024 04:40:19 +0000
Statistical Computations at FreeStatistics.org, Office for Research Development and Education, URL https://freestatistics.org/blog/index.php?pk=32237, Retrieved Sun, 19 May 2024 04:40:19 +0000
QR Codes:

Original text written by user:
IsPrivate?No (this computation is public)
User-defined keywords
Estimated Impact173
Family? (F = Feedback message, R = changed R code, M = changed R Module, P = changed Parameters, D = changed Data)
-     [Univariate Data Series] [data set] [2008-12-01 19:54:57] [b98453cac15ba1066b407e146608df68]
F RMP   [ARIMA Backward Selection] [Arima Backward Se...] [2008-12-07 12:56:11] [7a664918911e34206ce9d0436dd7c1c8]
-   PD      [ARIMA Backward Selection] [ARMA] [2008-12-11 13:52:17] [09074fbe368d26382bb94e5bb318a104] [Current]
Feedback Forum

Post a new message
Dataseries X:
35810356,5
35492936,3
38937434,1
40059102,8
37708710,2
41570965,7
36333563
34181220,1
42593543,9
43119727,6
38497690,9
45473273,4
38399780,4
38882302,6
44051120,6
41677559,9
40699203,5
44150027,6
38225518,7
35447405,7
43075518,3
42302792
39743541,7
44670641,2
37123384
37668266,4
46117528,8
42273156,4
39404153,2
45799994,5
38602505,2
39454830,1
47427901,4
46497980,9
45057149,4
50615569,2
43033396,2
46013056,5
54222266,3
46417306,4
51046271,8
51201279,6
43475288,7
44968981,1
53939345,4
54549319,7
54072107,3
58434230,1
51158751
50039368
57872617,4
51642978,8
54534465,9
56094697,8
48189983,1
47492381
52987449,1
55719803,5
53922860,5
54931231,9


Summary of computational transaction
Raw Inputview raw input (R code)
Raw Outputview raw output of R engine
Computing time17 seconds
R Server'Herman Ole Andreas Wold' @ 193.190.124.10:1001

\begin{tabular}{lllllllll}
\hline
Summary of computational transaction \tabularnewline
Raw Input & view raw input (R code)  \tabularnewline
Raw Output & view raw output of R engine  \tabularnewline
Computing time & 17 seconds \tabularnewline
R Server & 'Herman Ole Andreas Wold' @ 193.190.124.10:1001 \tabularnewline
\hline
\end{tabular}
%Source: https://freestatistics.org/blog/index.php?pk=32237&T=0

[TABLE]
[ROW][C]Summary of computational transaction[/C][/ROW]
[ROW][C]Raw Input[/C][C]view raw input (R code) [/C][/ROW]
[ROW][C]Raw Output[/C][C]view raw output of R engine [/C][/ROW]
[ROW][C]Computing time[/C][C]17 seconds[/C][/ROW]
[ROW][C]R Server[/C][C]'Herman Ole Andreas Wold' @ 193.190.124.10:1001[/C][/ROW]
[/TABLE]
Source: https://freestatistics.org/blog/index.php?pk=32237&T=0

Globally Unique Identifier (entire table): ba.freestatistics.org/blog/index.php?pk=32237&T=0

As an alternative you can also use a QR Code:  

The GUIDs for individual cells are displayed in the table below:

Summary of computational transaction
Raw Inputview raw input (R code)
Raw Outputview raw output of R engine
Computing time17 seconds
R Server'Herman Ole Andreas Wold' @ 193.190.124.10:1001


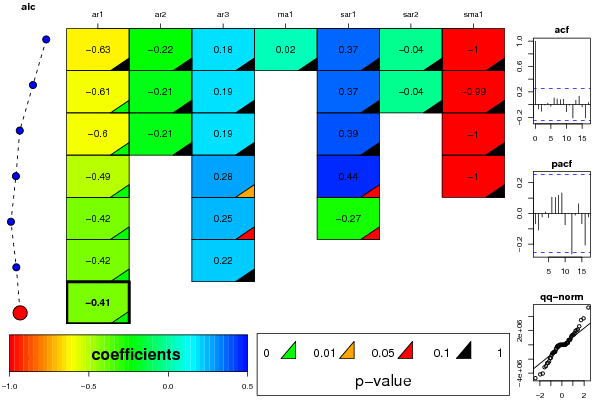
ARIMA Parameter Estimation and Backward Selection
Iterationar1ar2ar3ma1sar1sar2sma1
Estimates ( 1 )-0.629-0.22490.17830.02270.3695-0.0383-0.9979
(p-val)(0.3033 )(0.5893 )(0.4596 )(0.9691 )(0.2321 )(0.8993 )(0.3348 )
Estimates ( 2 )-0.6065-0.21040.185400.3711-0.0375-0.9925
(p-val)(0.0012 )(0.2374 )(0.2235 )(NA )(0.2273 )(0.9008 )(0.3333 )
Estimates ( 3 )-0.596-0.20790.185200.39460-0.9995
(p-val)(3e-04 )(0.2374 )(0.2242 )(NA )(0.1085 )(NA )(0.2287 )
Estimates ( 4 )-0.492600.275500.44270-0.9999
(p-val)(4e-04 )(NA )(0.0445 )(NA )(0.0732 )(NA )(0.2027 )
Estimates ( 5 )-0.417400.25160-0.267200
(p-val)(0.0024 )(NA )(0.0716 )(NA )(0.0869 )(NA )(NA )
Estimates ( 6 )-0.424700.21740000
(p-val)(0.002 )(NA )(0.1076 )(NA )(NA )(NA )(NA )
Estimates ( 7 )-0.4143000000
(p-val)(0.0031 )(NA )(NA )(NA )(NA )(NA )(NA )
Estimates ( 8 )NANANANANANANA
(p-val)(NA )(NA )(NA )(NA )(NA )(NA )(NA )
Estimates ( 9 )NANANANANANANA
(p-val)(NA )(NA )(NA )(NA )(NA )(NA )(NA )
Estimates ( 10 )NANANANANANANA
(p-val)(NA )(NA )(NA )(NA )(NA )(NA )(NA )
Estimates ( 11 )NANANANANANANA
(p-val)(NA )(NA )(NA )(NA )(NA )(NA )(NA )
Estimates ( 12 )NANANANANANANA
(p-val)(NA )(NA )(NA )(NA )(NA )(NA )(NA )
Estimates ( 13 )NANANANANANANA
(p-val)(NA )(NA )(NA )(NA )(NA )(NA )(NA )

\begin{tabular}{lllllllll}
\hline
ARIMA Parameter Estimation and Backward Selection \tabularnewline
Iteration & ar1 & ar2 & ar3 & ma1 & sar1 & sar2 & sma1 \tabularnewline
Estimates ( 1 ) & -0.629 & -0.2249 & 0.1783 & 0.0227 & 0.3695 & -0.0383 & -0.9979 \tabularnewline
(p-val) & (0.3033 ) & (0.5893 ) & (0.4596 ) & (0.9691 ) & (0.2321 ) & (0.8993 ) & (0.3348 ) \tabularnewline
Estimates ( 2 ) & -0.6065 & -0.2104 & 0.1854 & 0 & 0.3711 & -0.0375 & -0.9925 \tabularnewline
(p-val) & (0.0012 ) & (0.2374 ) & (0.2235 ) & (NA ) & (0.2273 ) & (0.9008 ) & (0.3333 ) \tabularnewline
Estimates ( 3 ) & -0.596 & -0.2079 & 0.1852 & 0 & 0.3946 & 0 & -0.9995 \tabularnewline
(p-val) & (3e-04 ) & (0.2374 ) & (0.2242 ) & (NA ) & (0.1085 ) & (NA ) & (0.2287 ) \tabularnewline
Estimates ( 4 ) & -0.4926 & 0 & 0.2755 & 0 & 0.4427 & 0 & -0.9999 \tabularnewline
(p-val) & (4e-04 ) & (NA ) & (0.0445 ) & (NA ) & (0.0732 ) & (NA ) & (0.2027 ) \tabularnewline
Estimates ( 5 ) & -0.4174 & 0 & 0.2516 & 0 & -0.2672 & 0 & 0 \tabularnewline
(p-val) & (0.0024 ) & (NA ) & (0.0716 ) & (NA ) & (0.0869 ) & (NA ) & (NA ) \tabularnewline
Estimates ( 6 ) & -0.4247 & 0 & 0.2174 & 0 & 0 & 0 & 0 \tabularnewline
(p-val) & (0.002 ) & (NA ) & (0.1076 ) & (NA ) & (NA ) & (NA ) & (NA ) \tabularnewline
Estimates ( 7 ) & -0.4143 & 0 & 0 & 0 & 0 & 0 & 0 \tabularnewline
(p-val) & (0.0031 ) & (NA ) & (NA ) & (NA ) & (NA ) & (NA ) & (NA ) \tabularnewline
Estimates ( 8 ) & NA & NA & NA & NA & NA & NA & NA \tabularnewline
(p-val) & (NA ) & (NA ) & (NA ) & (NA ) & (NA ) & (NA ) & (NA ) \tabularnewline
Estimates ( 9 ) & NA & NA & NA & NA & NA & NA & NA \tabularnewline
(p-val) & (NA ) & (NA ) & (NA ) & (NA ) & (NA ) & (NA ) & (NA ) \tabularnewline
Estimates ( 10 ) & NA & NA & NA & NA & NA & NA & NA \tabularnewline
(p-val) & (NA ) & (NA ) & (NA ) & (NA ) & (NA ) & (NA ) & (NA ) \tabularnewline
Estimates ( 11 ) & NA & NA & NA & NA & NA & NA & NA \tabularnewline
(p-val) & (NA ) & (NA ) & (NA ) & (NA ) & (NA ) & (NA ) & (NA ) \tabularnewline
Estimates ( 12 ) & NA & NA & NA & NA & NA & NA & NA \tabularnewline
(p-val) & (NA ) & (NA ) & (NA ) & (NA ) & (NA ) & (NA ) & (NA ) \tabularnewline
Estimates ( 13 ) & NA & NA & NA & NA & NA & NA & NA \tabularnewline
(p-val) & (NA ) & (NA ) & (NA ) & (NA ) & (NA ) & (NA ) & (NA ) \tabularnewline
\hline
\end{tabular}
%Source: https://freestatistics.org/blog/index.php?pk=32237&T=1

[TABLE]
[ROW][C]ARIMA Parameter Estimation and Backward Selection[/C][/ROW]
[ROW][C]Iteration[/C][C]ar1[/C][C]ar2[/C][C]ar3[/C][C]ma1[/C][C]sar1[/C][C]sar2[/C][C]sma1[/C][/ROW]
[ROW][C]Estimates ( 1 )[/C][C]-0.629[/C][C]-0.2249[/C][C]0.1783[/C][C]0.0227[/C][C]0.3695[/C][C]-0.0383[/C][C]-0.9979[/C][/ROW]
[ROW][C](p-val)[/C][C](0.3033 )[/C][C](0.5893 )[/C][C](0.4596 )[/C][C](0.9691 )[/C][C](0.2321 )[/C][C](0.8993 )[/C][C](0.3348 )[/C][/ROW]
[ROW][C]Estimates ( 2 )[/C][C]-0.6065[/C][C]-0.2104[/C][C]0.1854[/C][C]0[/C][C]0.3711[/C][C]-0.0375[/C][C]-0.9925[/C][/ROW]
[ROW][C](p-val)[/C][C](0.0012 )[/C][C](0.2374 )[/C][C](0.2235 )[/C][C](NA )[/C][C](0.2273 )[/C][C](0.9008 )[/C][C](0.3333 )[/C][/ROW]
[ROW][C]Estimates ( 3 )[/C][C]-0.596[/C][C]-0.2079[/C][C]0.1852[/C][C]0[/C][C]0.3946[/C][C]0[/C][C]-0.9995[/C][/ROW]
[ROW][C](p-val)[/C][C](3e-04 )[/C][C](0.2374 )[/C][C](0.2242 )[/C][C](NA )[/C][C](0.1085 )[/C][C](NA )[/C][C](0.2287 )[/C][/ROW]
[ROW][C]Estimates ( 4 )[/C][C]-0.4926[/C][C]0[/C][C]0.2755[/C][C]0[/C][C]0.4427[/C][C]0[/C][C]-0.9999[/C][/ROW]
[ROW][C](p-val)[/C][C](4e-04 )[/C][C](NA )[/C][C](0.0445 )[/C][C](NA )[/C][C](0.0732 )[/C][C](NA )[/C][C](0.2027 )[/C][/ROW]
[ROW][C]Estimates ( 5 )[/C][C]-0.4174[/C][C]0[/C][C]0.2516[/C][C]0[/C][C]-0.2672[/C][C]0[/C][C]0[/C][/ROW]
[ROW][C](p-val)[/C][C](0.0024 )[/C][C](NA )[/C][C](0.0716 )[/C][C](NA )[/C][C](0.0869 )[/C][C](NA )[/C][C](NA )[/C][/ROW]
[ROW][C]Estimates ( 6 )[/C][C]-0.4247[/C][C]0[/C][C]0.2174[/C][C]0[/C][C]0[/C][C]0[/C][C]0[/C][/ROW]
[ROW][C](p-val)[/C][C](0.002 )[/C][C](NA )[/C][C](0.1076 )[/C][C](NA )[/C][C](NA )[/C][C](NA )[/C][C](NA )[/C][/ROW]
[ROW][C]Estimates ( 7 )[/C][C]-0.4143[/C][C]0[/C][C]0[/C][C]0[/C][C]0[/C][C]0[/C][C]0[/C][/ROW]
[ROW][C](p-val)[/C][C](0.0031 )[/C][C](NA )[/C][C](NA )[/C][C](NA )[/C][C](NA )[/C][C](NA )[/C][C](NA )[/C][/ROW]
[ROW][C]Estimates ( 8 )[/C][C]NA[/C][C]NA[/C][C]NA[/C][C]NA[/C][C]NA[/C][C]NA[/C][C]NA[/C][/ROW]
[ROW][C](p-val)[/C][C](NA )[/C][C](NA )[/C][C](NA )[/C][C](NA )[/C][C](NA )[/C][C](NA )[/C][C](NA )[/C][/ROW]
[ROW][C]Estimates ( 9 )[/C][C]NA[/C][C]NA[/C][C]NA[/C][C]NA[/C][C]NA[/C][C]NA[/C][C]NA[/C][/ROW]
[ROW][C](p-val)[/C][C](NA )[/C][C](NA )[/C][C](NA )[/C][C](NA )[/C][C](NA )[/C][C](NA )[/C][C](NA )[/C][/ROW]
[ROW][C]Estimates ( 10 )[/C][C]NA[/C][C]NA[/C][C]NA[/C][C]NA[/C][C]NA[/C][C]NA[/C][C]NA[/C][/ROW]
[ROW][C](p-val)[/C][C](NA )[/C][C](NA )[/C][C](NA )[/C][C](NA )[/C][C](NA )[/C][C](NA )[/C][C](NA )[/C][/ROW]
[ROW][C]Estimates ( 11 )[/C][C]NA[/C][C]NA[/C][C]NA[/C][C]NA[/C][C]NA[/C][C]NA[/C][C]NA[/C][/ROW]
[ROW][C](p-val)[/C][C](NA )[/C][C](NA )[/C][C](NA )[/C][C](NA )[/C][C](NA )[/C][C](NA )[/C][C](NA )[/C][/ROW]
[ROW][C]Estimates ( 12 )[/C][C]NA[/C][C]NA[/C][C]NA[/C][C]NA[/C][C]NA[/C][C]NA[/C][C]NA[/C][/ROW]
[ROW][C](p-val)[/C][C](NA )[/C][C](NA )[/C][C](NA )[/C][C](NA )[/C][C](NA )[/C][C](NA )[/C][C](NA )[/C][/ROW]
[ROW][C]Estimates ( 13 )[/C][C]NA[/C][C]NA[/C][C]NA[/C][C]NA[/C][C]NA[/C][C]NA[/C][C]NA[/C][/ROW]
[ROW][C](p-val)[/C][C](NA )[/C][C](NA )[/C][C](NA )[/C][C](NA )[/C][C](NA )[/C][C](NA )[/C][C](NA )[/C][/ROW]
[/TABLE]
Source: https://freestatistics.org/blog/index.php?pk=32237&T=1

Globally Unique Identifier (entire table): ba.freestatistics.org/blog/index.php?pk=32237&T=1

As an alternative you can also use a QR Code:  

The GUIDs for individual cells are displayed in the table below:

ARIMA Parameter Estimation and Backward Selection
Iterationar1ar2ar3ma1sar1sar2sma1
Estimates ( 1 )-0.629-0.22490.17830.02270.3695-0.0383-0.9979
(p-val)(0.3033 )(0.5893 )(0.4596 )(0.9691 )(0.2321 )(0.8993 )(0.3348 )
Estimates ( 2 )-0.6065-0.21040.185400.3711-0.0375-0.9925
(p-val)(0.0012 )(0.2374 )(0.2235 )(NA )(0.2273 )(0.9008 )(0.3333 )
Estimates ( 3 )-0.596-0.20790.185200.39460-0.9995
(p-val)(3e-04 )(0.2374 )(0.2242 )(NA )(0.1085 )(NA )(0.2287 )
Estimates ( 4 )-0.492600.275500.44270-0.9999
(p-val)(4e-04 )(NA )(0.0445 )(NA )(0.0732 )(NA )(0.2027 )
Estimates ( 5 )-0.417400.25160-0.267200
(p-val)(0.0024 )(NA )(0.0716 )(NA )(0.0869 )(NA )(NA )
Estimates ( 6 )-0.424700.21740000
(p-val)(0.002 )(NA )(0.1076 )(NA )(NA )(NA )(NA )
Estimates ( 7 )-0.4143000000
(p-val)(0.0031 )(NA )(NA )(NA )(NA )(NA )(NA )
Estimates ( 8 )NANANANANANANA
(p-val)(NA )(NA )(NA )(NA )(NA )(NA )(NA )
Estimates ( 9 )NANANANANANANA
(p-val)(NA )(NA )(NA )(NA )(NA )(NA )(NA )
Estimates ( 10 )NANANANANANANA
(p-val)(NA )(NA )(NA )(NA )(NA )(NA )(NA )
Estimates ( 11 )NANANANANANANA
(p-val)(NA )(NA )(NA )(NA )(NA )(NA )(NA )
Estimates ( 12 )NANANANANANANA
(p-val)(NA )(NA )(NA )(NA )(NA )(NA )(NA )
Estimates ( 13 )NANANANANANANA
(p-val)(NA )(NA )(NA )(NA )(NA )(NA )(NA )


Estimated ARIMA Residuals
Value
-129820.581527961
709928.604591452
1990977.90897686
-2585681.34546881
-286148.722086365
-203666.231439528
-101936.535888652
-1215844.25703397
-960500.569167821
-1482548.83651511
1647242.47040147
-1002014.42315439
-1061273.99707989
-587290.685068525
3752280.23295033
25250.0051947677
-2528794.1267513
1428950.71642632
297404.876472644
3500897.96040294
1246381.05184431
266049.380516589
262383.311659336
1031267.77513780
267353.579046607
2176798.80718547
656638.400351599
-4054936.47145692
5286741.9406657
-3004583.09360992
-2317653.58638894
-1213173.63618135
2626453.63831225
2078301.63586281
1478107.81772654
-1003908.15161695
-536105.059530102
-4178301.09276799
-1856562.78623085
1348989.9164579
-177347.868914917
749128.946021803
75528.2034528926
-1889451.10376142
-4711349.01809508
685428.643950224
57954.3309074789
-3158630.53675223

\begin{tabular}{lllllllll}
\hline
Estimated ARIMA Residuals \tabularnewline
Value \tabularnewline
-129820.581527961 \tabularnewline
709928.604591452 \tabularnewline
1990977.90897686 \tabularnewline
-2585681.34546881 \tabularnewline
-286148.722086365 \tabularnewline
-203666.231439528 \tabularnewline
-101936.535888652 \tabularnewline
-1215844.25703397 \tabularnewline
-960500.569167821 \tabularnewline
-1482548.83651511 \tabularnewline
1647242.47040147 \tabularnewline
-1002014.42315439 \tabularnewline
-1061273.99707989 \tabularnewline
-587290.685068525 \tabularnewline
3752280.23295033 \tabularnewline
25250.0051947677 \tabularnewline
-2528794.1267513 \tabularnewline
1428950.71642632 \tabularnewline
297404.876472644 \tabularnewline
3500897.96040294 \tabularnewline
1246381.05184431 \tabularnewline
266049.380516589 \tabularnewline
262383.311659336 \tabularnewline
1031267.77513780 \tabularnewline
267353.579046607 \tabularnewline
2176798.80718547 \tabularnewline
656638.400351599 \tabularnewline
-4054936.47145692 \tabularnewline
5286741.9406657 \tabularnewline
-3004583.09360992 \tabularnewline
-2317653.58638894 \tabularnewline
-1213173.63618135 \tabularnewline
2626453.63831225 \tabularnewline
2078301.63586281 \tabularnewline
1478107.81772654 \tabularnewline
-1003908.15161695 \tabularnewline
-536105.059530102 \tabularnewline
-4178301.09276799 \tabularnewline
-1856562.78623085 \tabularnewline
1348989.9164579 \tabularnewline
-177347.868914917 \tabularnewline
749128.946021803 \tabularnewline
75528.2034528926 \tabularnewline
-1889451.10376142 \tabularnewline
-4711349.01809508 \tabularnewline
685428.643950224 \tabularnewline
57954.3309074789 \tabularnewline
-3158630.53675223 \tabularnewline
\hline
\end{tabular}
%Source: https://freestatistics.org/blog/index.php?pk=32237&T=2

[TABLE]
[ROW][C]Estimated ARIMA Residuals[/C][/ROW]
[ROW][C]Value[/C][/ROW]
[ROW][C]-129820.581527961[/C][/ROW]
[ROW][C]709928.604591452[/C][/ROW]
[ROW][C]1990977.90897686[/C][/ROW]
[ROW][C]-2585681.34546881[/C][/ROW]
[ROW][C]-286148.722086365[/C][/ROW]
[ROW][C]-203666.231439528[/C][/ROW]
[ROW][C]-101936.535888652[/C][/ROW]
[ROW][C]-1215844.25703397[/C][/ROW]
[ROW][C]-960500.569167821[/C][/ROW]
[ROW][C]-1482548.83651511[/C][/ROW]
[ROW][C]1647242.47040147[/C][/ROW]
[ROW][C]-1002014.42315439[/C][/ROW]
[ROW][C]-1061273.99707989[/C][/ROW]
[ROW][C]-587290.685068525[/C][/ROW]
[ROW][C]3752280.23295033[/C][/ROW]
[ROW][C]25250.0051947677[/C][/ROW]
[ROW][C]-2528794.1267513[/C][/ROW]
[ROW][C]1428950.71642632[/C][/ROW]
[ROW][C]297404.876472644[/C][/ROW]
[ROW][C]3500897.96040294[/C][/ROW]
[ROW][C]1246381.05184431[/C][/ROW]
[ROW][C]266049.380516589[/C][/ROW]
[ROW][C]262383.311659336[/C][/ROW]
[ROW][C]1031267.77513780[/C][/ROW]
[ROW][C]267353.579046607[/C][/ROW]
[ROW][C]2176798.80718547[/C][/ROW]
[ROW][C]656638.400351599[/C][/ROW]
[ROW][C]-4054936.47145692[/C][/ROW]
[ROW][C]5286741.9406657[/C][/ROW]
[ROW][C]-3004583.09360992[/C][/ROW]
[ROW][C]-2317653.58638894[/C][/ROW]
[ROW][C]-1213173.63618135[/C][/ROW]
[ROW][C]2626453.63831225[/C][/ROW]
[ROW][C]2078301.63586281[/C][/ROW]
[ROW][C]1478107.81772654[/C][/ROW]
[ROW][C]-1003908.15161695[/C][/ROW]
[ROW][C]-536105.059530102[/C][/ROW]
[ROW][C]-4178301.09276799[/C][/ROW]
[ROW][C]-1856562.78623085[/C][/ROW]
[ROW][C]1348989.9164579[/C][/ROW]
[ROW][C]-177347.868914917[/C][/ROW]
[ROW][C]749128.946021803[/C][/ROW]
[ROW][C]75528.2034528926[/C][/ROW]
[ROW][C]-1889451.10376142[/C][/ROW]
[ROW][C]-4711349.01809508[/C][/ROW]
[ROW][C]685428.643950224[/C][/ROW]
[ROW][C]57954.3309074789[/C][/ROW]
[ROW][C]-3158630.53675223[/C][/ROW]
[/TABLE]
Source: https://freestatistics.org/blog/index.php?pk=32237&T=2

Globally Unique Identifier (entire table): ba.freestatistics.org/blog/index.php?pk=32237&T=2

As an alternative you can also use a QR Code:  

The GUIDs for individual cells are displayed in the table below:

Estimated ARIMA Residuals
Value
-129820.581527961
709928.604591452
1990977.90897686
-2585681.34546881
-286148.722086365
-203666.231439528
-101936.535888652
-1215844.25703397
-960500.569167821
-1482548.83651511
1647242.47040147
-1002014.42315439
-1061273.99707989
-587290.685068525
3752280.23295033
25250.0051947677
-2528794.1267513
1428950.71642632
297404.876472644
3500897.96040294
1246381.05184431
266049.380516589
262383.311659336
1031267.77513780
267353.579046607
2176798.80718547
656638.400351599
-4054936.47145692
5286741.9406657
-3004583.09360992
-2317653.58638894
-1213173.63618135
2626453.63831225
2078301.63586281
1478107.81772654
-1003908.15161695
-536105.059530102
-4178301.09276799
-1856562.78623085
1348989.9164579
-177347.868914917
749128.946021803
75528.2034528926
-1889451.10376142
-4711349.01809508
685428.643950224
57954.3309074789
-3158630.53675223


Parameters (Session):
par1 = FALSE ; par2 = 1 ; par3 = 1 ; par4 = 1 ; par5 = 12 ; par6 = 3 ; par7 = 1 ; par8 = 2 ; par9 = 1 ;
Parameters (R input):
par1 = FALSE ; par2 = 1 ; par3 = 1 ; par4 = 1 ; par5 = 12 ; par6 = 3 ; par7 = 1 ; par8 = 2 ; par9 = 1 ;
R code (references can be found in the software module):
library(lattice)
if (par1 == 'TRUE') par1 <- TRUE
if (par1 == 'FALSE') par1 <- FALSE
par2 <- as.numeric(par2) #Box-Cox lambda transformation parameter
par3 <- as.numeric(par3) #degree of non-seasonal differencing
par4 <- as.numeric(par4) #degree of seasonal differencing
par5 <- as.numeric(par5) #seasonal period
par6 <- as.numeric(par6) #degree (p) of the non-seasonal AR(p) polynomial
par7 <- as.numeric(par7) #degree (q) of the non-seasonal MA(q) polynomial
par8 <- as.numeric(par8) #degree (P) of the seasonal AR(P) polynomial
par9 <- as.numeric(par9) #degree (Q) of the seasonal MA(Q) polynomial
armaGR <- function(arima.out, names, n){
try1 <- arima.out$coef
try2 <- sqrt(diag(arima.out$var.coef))
try.data.frame <- data.frame(matrix(NA,ncol=4,nrow=length(names)))
dimnames(try.data.frame) <- list(names,c('coef','std','tstat','pv'))
try.data.frame[,1] <- try1
for(i in 1:length(try2)) try.data.frame[which(rownames(try.data.frame)==names(try2)[i]),2] <- try2[i]
try.data.frame[,3] <- try.data.frame[,1] / try.data.frame[,2]
try.data.frame[,4] <- round((1-pt(abs(try.data.frame[,3]),df=n-(length(try2)+1)))*2,5)
vector <- rep(NA,length(names))
vector[is.na(try.data.frame[,4])] <- 0
maxi <- which.max(try.data.frame[,4])
continue <- max(try.data.frame[,4],na.rm=TRUE) > .05
vector[maxi] <- 0
list(summary=try.data.frame,next.vector=vector,continue=continue)
}
arimaSelect <- function(series, order=c(13,0,0), seasonal=list(order=c(2,0,0),period=12), include.mean=F){
nrc <- order[1]+order[3]+seasonal$order[1]+seasonal$order[3]
coeff <- matrix(NA, nrow=nrc*2, ncol=nrc)
pval <- matrix(NA, nrow=nrc*2, ncol=nrc)
mylist <- rep(list(NULL), nrc)
names <- NULL
if(order[1] > 0) names <- paste('ar',1:order[1],sep='')
if(order[3] > 0) names <- c( names , paste('ma',1:order[3],sep='') )
if(seasonal$order[1] > 0) names <- c(names, paste('sar',1:seasonal$order[1],sep=''))
if(seasonal$order[3] > 0) names <- c(names, paste('sma',1:seasonal$order[3],sep=''))
arima.out <- arima(series, order=order, seasonal=seasonal, include.mean=include.mean, method='ML')
mylist[[1]] <- arima.out
last.arma <- armaGR(arima.out, names, length(series))
mystop <- FALSE
i <- 1
coeff[i,] <- last.arma[[1]][,1]
pval [i,] <- last.arma[[1]][,4]
i <- 2
aic <- arima.out$aic
while(!mystop){
mylist[[i]] <- arima.out
arima.out <- arima(series, order=order, seasonal=seasonal, include.mean=include.mean, method='ML', fixed=last.arma$next.vector)
aic <- c(aic, arima.out$aic)
last.arma <- armaGR(arima.out, names, length(series))
mystop <- !last.arma$continue
coeff[i,] <- last.arma[[1]][,1]
pval [i,] <- last.arma[[1]][,4]
i <- i+1
}
list(coeff, pval, mylist, aic=aic)
}
arimaSelectplot <- function(arimaSelect.out,noms,choix){
noms <- names(arimaSelect.out[[3]][[1]]$coef)
coeff <- arimaSelect.out[[1]]
k <- min(which(is.na(coeff[,1])))-1
coeff <- coeff[1:k,]
pval <- arimaSelect.out[[2]][1:k,]
aic <- arimaSelect.out$aic[1:k]
coeff[coeff==0] <- NA
n <- ncol(coeff)
if(missing(choix)) choix <- k
layout(matrix(c(1,1,1,2,
3,3,3,2,
3,3,3,4,
5,6,7,7),nr=4),
widths=c(10,35,45,15),
heights=c(30,30,15,15))
couleurs <- rainbow(75)[1:50]#(50)
ticks <- pretty(coeff)
par(mar=c(1,1,3,1))
plot(aic,k:1-.5,type='o',pch=21,bg='blue',cex=2,axes=F,lty=2,xpd=NA)
points(aic[choix],k-choix+.5,pch=21,cex=4,bg=2,xpd=NA)
title('aic',line=2)
par(mar=c(3,0,0,0))
plot(0,axes=F,xlab='',ylab='',xlim=range(ticks),ylim=c(.1,1))
rect(xleft = min(ticks) + (0:49)/50*(max(ticks)-min(ticks)),
xright = min(ticks) + (1:50)/50*(max(ticks)-min(ticks)),
ytop = rep(1,50),
ybottom= rep(0,50),col=couleurs,border=NA)
axis(1,ticks)
rect(xleft=min(ticks),xright=max(ticks),ytop=1,ybottom=0)
text(mean(coeff,na.rm=T),.5,'coefficients',cex=2,font=2)
par(mar=c(1,1,3,1))
image(1:n,1:k,t(coeff[k:1,]),axes=F,col=couleurs,zlim=range(ticks))
for(i in 1:n) for(j in 1:k) if(!is.na(coeff[j,i])) {
if(pval[j,i]<.01) symb = 'green'
else if( (pval[j,i]<.05) & (pval[j,i]>=.01)) symb = 'orange'
else if( (pval[j,i]<.1) & (pval[j,i]>=.05)) symb = 'red'
else symb = 'black'
polygon(c(i+.5 ,i+.2 ,i+.5 ,i+.5),
c(k-j+0.5,k-j+0.5,k-j+0.8,k-j+0.5),
col=symb)
if(j==choix) {
rect(xleft=i-.5,
xright=i+.5,
ybottom=k-j+1.5,
ytop=k-j+.5,
lwd=4)
text(i,
k-j+1,
round(coeff[j,i],2),
cex=1.2,
font=2)
}
else{
rect(xleft=i-.5,xright=i+.5,ybottom=k-j+1.5,ytop=k-j+.5)
text(i,k-j+1,round(coeff[j,i],2),cex=1.2,font=1)
}
}
axis(3,1:n,noms)
par(mar=c(0.5,0,0,0.5))
plot(0,axes=F,xlab='',ylab='',type='n',xlim=c(0,8),ylim=c(-.2,.8))
cols <- c('green','orange','red','black')
niv <- c('0','0.01','0.05','0.1')
for(i in 0:3){
polygon(c(1+2*i ,1+2*i ,1+2*i-.5 ,1+2*i),
c(.4 ,.7 , .4 , .4),
col=cols[i+1])
text(2*i,0.5,niv[i+1],cex=1.5)
}
text(8,.5,1,cex=1.5)
text(4,0,'p-value',cex=2)
box()
residus <- arimaSelect.out[[3]][[choix]]$res
par(mar=c(1,2,4,1))
acf(residus,main='')
title('acf',line=.5)
par(mar=c(1,2,4,1))
pacf(residus,main='')
title('pacf',line=.5)
par(mar=c(2,2,4,1))
qqnorm(residus,main='')
title('qq-norm',line=.5)
qqline(residus)
residus
}
if (par2 == 0) x <- log(x)
if (par2 != 0) x <- x^par2
(selection <- arimaSelect(x, order=c(par6,par3,par7), seasonal=list(order=c(par8,par4,par9), period=par5)))
bitmap(file='test1.png')
resid <- arimaSelectplot(selection)
dev.off()
resid
bitmap(file='test2.png')
acf(resid,length(resid)/2, main='Residual Autocorrelation Function')
dev.off()
bitmap(file='test3.png')
pacf(resid,length(resid)/2, main='Residual Partial Autocorrelation Function')
dev.off()
bitmap(file='test4.png')
cpgram(resid, main='Residual Cumulative Periodogram')
dev.off()
bitmap(file='test5.png')
hist(resid, main='Residual Histogram', xlab='values of Residuals')
dev.off()
bitmap(file='test6.png')
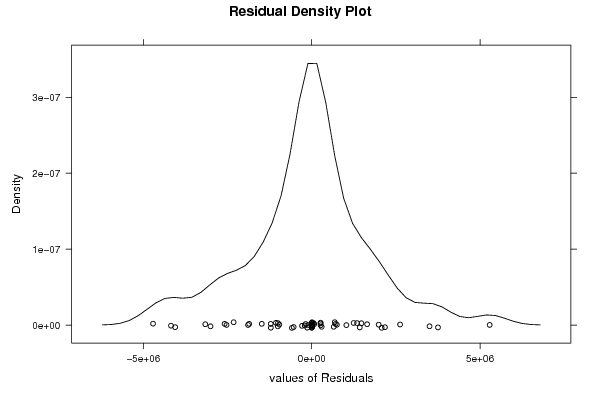
densityplot(~resid,col='black',main='Residual Density Plot', xlab='values of Residuals')
dev.off()
bitmap(file='test7.png')
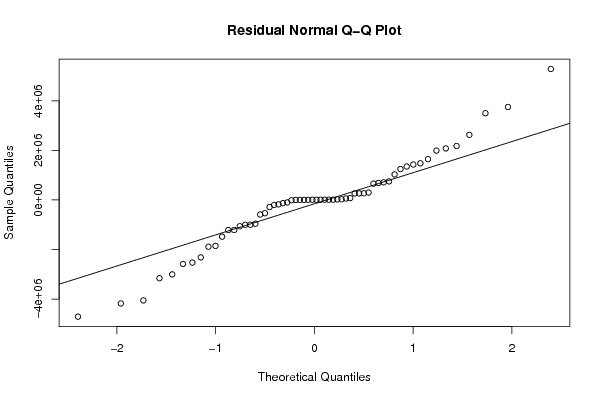
qqnorm(resid, main='Residual Normal Q-Q Plot')
qqline(resid)
dev.off()
ncols <- length(selection[[1]][1,])
nrows <- length(selection[[2]][,1])-1
load(file='createtable')
a<-table.start()
a<-table.row.start(a)
a<-table.element(a,'ARIMA Parameter Estimation and Backward Selection', ncols+1,TRUE)
a<-table.row.end(a)
a<-table.row.start(a)
a<-table.element(a,'Iteration', header=TRUE)
for (i in 1:ncols) {
a<-table.element(a,names(selection[[3]][[1]]$coef)[i],header=TRUE)
}
a<-table.row.end(a)
for (j in 1:nrows) {
a<-table.row.start(a)
mydum <- 'Estimates ('
mydum <- paste(mydum,j)
mydum <- paste(mydum,')')
a<-table.element(a,mydum, header=TRUE)
for (i in 1:ncols) {
a<-table.element(a,round(selection[[1]][j,i],4))
}
a<-table.row.end(a)
a<-table.row.start(a)
a<-table.element(a,'(p-val)', header=TRUE)
for (i in 1:ncols) {
mydum <- '('
mydum <- paste(mydum,round(selection[[2]][j,i],4),sep='')
mydum <- paste(mydum,')')
a<-table.element(a,mydum)
}
a<-table.row.end(a)
}
a<-table.end(a)
table.save(a,file='mytable.tab')
a<-table.start()
a<-table.row.start(a)
a<-table.element(a,'Estimated ARIMA Residuals', 1,TRUE)
a<-table.row.end(a)
a<-table.row.start(a)
a<-table.element(a,'Value', 1,TRUE)
a<-table.row.end(a)
for (i in (par4*par5+par3):length(resid)) {
a<-table.row.start(a)
a<-table.element(a,resid[i])
a<-table.row.end(a)
}
a<-table.end(a)
table.save(a,file='mytable1.tab')