Free Statistics

of Irreproducible Research!

Author's title

Author*The author of this computation has been verified*
R Software Modulerwasp_autocorrelation.wasp
Title produced by software(Partial) Autocorrelation Function
Date of computationThu, 11 Dec 2008 05:53:51 -0700
Cite this page as followsStatistical Computations at FreeStatistics.org, Office for Research Development and Education, URL https://freestatistics.org/blog/index.php?v=date/2008/Dec/11/t12290000963uzm3t7pktvjxx0.htm/, Retrieved Sun, 19 May 2024 07:13:26 +0000
Statistical Computations at FreeStatistics.org, Office for Research Development and Education, URL https://freestatistics.org/blog/index.php?pk=32205, Retrieved Sun, 19 May 2024 07:13:26 +0000
QR Codes:

Original text written by user:
IsPrivate?No (this computation is public)
User-defined keywords
Estimated Impact162
Family? (F = Feedback message, R = changed R code, M = changed R Module, P = changed Parameters, D = changed Data)
-       [(Partial) Autocorrelation Function] [autocorrelatie d=...] [2008-12-11 12:53:51] [a9e6d7cd6e144e8b311d9f96a24c5a25] [Current]
Feedback Forum

Post a new message
Dataseries X:
2648.9
2669.6
3042.3
2604.2
2732.1
2621.7
2483.7
2479.3
2684.6
2834.7
2566.1
2251.2
2350
2299.8
2542.8
2530.2
2508.1
2616.8
2534.1
2181.8
2578.9
2841.9
2529.9
2103.2
2326.2
2452.6
2782.1
2727.3
2648.2
2760.7
2613
2225.4
2713.9
2923.3
2707
2473.9
2521
2531.8
3068.8
2826.9
2674.2
2966.6
2798.8
2629.6
3124.6
3115.7
3083
2863.9
2728.7
2789.4
3225.7
3148.2
2836.5
3153.5
2656.9
2834.7
3172.5
2998.8
3103.1
2735.6
2818.1
2874.4
3438.5
2949.1
3306.8
3530
3003.8
3206.4
3514.6
3522.6
3525.5
2996.2
3231.1
3030
3541.7
3113.2
3390.8
3424.2
3079.8
3123.4
3317.1
3579.9
3317.9
2668.1


Summary of computational transaction
Raw Inputview raw input (R code)
Raw Outputview raw output of R engine
Computing time2 seconds
R Server'Sir Ronald Aylmer Fisher' @ 193.190.124.24

\begin{tabular}{lllllllll}
\hline
Summary of computational transaction \tabularnewline
Raw Input & view raw input (R code)  \tabularnewline
Raw Output & view raw output of R engine  \tabularnewline
Computing time & 2 seconds \tabularnewline
R Server & 'Sir Ronald Aylmer Fisher' @ 193.190.124.24 \tabularnewline
\hline
\end{tabular}
%Source: https://freestatistics.org/blog/index.php?pk=32205&T=0

[TABLE]
[ROW][C]Summary of computational transaction[/C][/ROW]
[ROW][C]Raw Input[/C][C]view raw input (R code) [/C][/ROW]
[ROW][C]Raw Output[/C][C]view raw output of R engine [/C][/ROW]
[ROW][C]Computing time[/C][C]2 seconds[/C][/ROW]
[ROW][C]R Server[/C][C]'Sir Ronald Aylmer Fisher' @ 193.190.124.24[/C][/ROW]
[/TABLE]
Source: https://freestatistics.org/blog/index.php?pk=32205&T=0

Globally Unique Identifier (entire table): ba.freestatistics.org/blog/index.php?pk=32205&T=0

As an alternative you can also use a QR Code:  

The GUIDs for individual cells are displayed in the table below:

Summary of computational transaction
Raw Inputview raw input (R code)
Raw Outputview raw output of R engine
Computing time2 seconds
R Server'Sir Ronald Aylmer Fisher' @ 193.190.124.24


Autocorrelation Function
Time lag kACF(k)T-STATP-value
1-0.467235-3.9379.5e-05
2-0.012439-0.10480.458409
30.1625371.36960.087571
4-0.079773-0.67220.251826
50.0279630.23560.407202
60.0699560.58950.278713
7-0.114557-0.96530.168843
8-0.077825-0.65580.257047
90.3095972.60870.005537
10-0.220689-1.85960.033546
110.0681790.57450.283728
12-0.026762-0.22550.411119
13-0.138487-1.16690.123575
140.1758031.48130.07147
15-0.116584-0.98240.164631
16-0.175575-1.47940.071726
170.2823142.37880.01003
18-0.035711-0.30090.382181
19-0.145071-1.22240.112801
200.1009820.85090.198846
210.0756330.63730.26299
22-0.200065-1.68580.048114
230.2592082.18410.016129
24-0.173926-1.46550.073596
25-0.092976-0.78340.217991
260.3210912.70560.004266
27-0.159135-1.34090.092114
28-0.058989-0.49710.310343
290.1188151.00120.160077
30-0.076541-0.64490.260521
310.0457970.38590.350366
320.0062540.05270.479059
33-0.133728-1.12680.131808
340.091110.76770.222603
350.0787910.66390.25445
36-0.123013-1.03650.151738

\begin{tabular}{lllllllll}
\hline
Autocorrelation Function \tabularnewline
Time lag k & ACF(k) & T-STAT & P-value \tabularnewline
1 & -0.467235 & -3.937 & 9.5e-05 \tabularnewline
2 & -0.012439 & -0.1048 & 0.458409 \tabularnewline
3 & 0.162537 & 1.3696 & 0.087571 \tabularnewline
4 & -0.079773 & -0.6722 & 0.251826 \tabularnewline
5 & 0.027963 & 0.2356 & 0.407202 \tabularnewline
6 & 0.069956 & 0.5895 & 0.278713 \tabularnewline
7 & -0.114557 & -0.9653 & 0.168843 \tabularnewline
8 & -0.077825 & -0.6558 & 0.257047 \tabularnewline
9 & 0.309597 & 2.6087 & 0.005537 \tabularnewline
10 & -0.220689 & -1.8596 & 0.033546 \tabularnewline
11 & 0.068179 & 0.5745 & 0.283728 \tabularnewline
12 & -0.026762 & -0.2255 & 0.411119 \tabularnewline
13 & -0.138487 & -1.1669 & 0.123575 \tabularnewline
14 & 0.175803 & 1.4813 & 0.07147 \tabularnewline
15 & -0.116584 & -0.9824 & 0.164631 \tabularnewline
16 & -0.175575 & -1.4794 & 0.071726 \tabularnewline
17 & 0.282314 & 2.3788 & 0.01003 \tabularnewline
18 & -0.035711 & -0.3009 & 0.382181 \tabularnewline
19 & -0.145071 & -1.2224 & 0.112801 \tabularnewline
20 & 0.100982 & 0.8509 & 0.198846 \tabularnewline
21 & 0.075633 & 0.6373 & 0.26299 \tabularnewline
22 & -0.200065 & -1.6858 & 0.048114 \tabularnewline
23 & 0.259208 & 2.1841 & 0.016129 \tabularnewline
24 & -0.173926 & -1.4655 & 0.073596 \tabularnewline
25 & -0.092976 & -0.7834 & 0.217991 \tabularnewline
26 & 0.321091 & 2.7056 & 0.004266 \tabularnewline
27 & -0.159135 & -1.3409 & 0.092114 \tabularnewline
28 & -0.058989 & -0.4971 & 0.310343 \tabularnewline
29 & 0.118815 & 1.0012 & 0.160077 \tabularnewline
30 & -0.076541 & -0.6449 & 0.260521 \tabularnewline
31 & 0.045797 & 0.3859 & 0.350366 \tabularnewline
32 & 0.006254 & 0.0527 & 0.479059 \tabularnewline
33 & -0.133728 & -1.1268 & 0.131808 \tabularnewline
34 & 0.09111 & 0.7677 & 0.222603 \tabularnewline
35 & 0.078791 & 0.6639 & 0.25445 \tabularnewline
36 & -0.123013 & -1.0365 & 0.151738 \tabularnewline
\hline
\end{tabular}
%Source: https://freestatistics.org/blog/index.php?pk=32205&T=1

[TABLE]
[ROW][C]Autocorrelation Function[/C][/ROW]
[ROW][C]Time lag k[/C][C]ACF(k)[/C][C]T-STAT[/C][C]P-value[/C][/ROW]
[ROW][C]1[/C][C]-0.467235[/C][C]-3.937[/C][C]9.5e-05[/C][/ROW]
[ROW][C]2[/C][C]-0.012439[/C][C]-0.1048[/C][C]0.458409[/C][/ROW]
[ROW][C]3[/C][C]0.162537[/C][C]1.3696[/C][C]0.087571[/C][/ROW]
[ROW][C]4[/C][C]-0.079773[/C][C]-0.6722[/C][C]0.251826[/C][/ROW]
[ROW][C]5[/C][C]0.027963[/C][C]0.2356[/C][C]0.407202[/C][/ROW]
[ROW][C]6[/C][C]0.069956[/C][C]0.5895[/C][C]0.278713[/C][/ROW]
[ROW][C]7[/C][C]-0.114557[/C][C]-0.9653[/C][C]0.168843[/C][/ROW]
[ROW][C]8[/C][C]-0.077825[/C][C]-0.6558[/C][C]0.257047[/C][/ROW]
[ROW][C]9[/C][C]0.309597[/C][C]2.6087[/C][C]0.005537[/C][/ROW]
[ROW][C]10[/C][C]-0.220689[/C][C]-1.8596[/C][C]0.033546[/C][/ROW]
[ROW][C]11[/C][C]0.068179[/C][C]0.5745[/C][C]0.283728[/C][/ROW]
[ROW][C]12[/C][C]-0.026762[/C][C]-0.2255[/C][C]0.411119[/C][/ROW]
[ROW][C]13[/C][C]-0.138487[/C][C]-1.1669[/C][C]0.123575[/C][/ROW]
[ROW][C]14[/C][C]0.175803[/C][C]1.4813[/C][C]0.07147[/C][/ROW]
[ROW][C]15[/C][C]-0.116584[/C][C]-0.9824[/C][C]0.164631[/C][/ROW]
[ROW][C]16[/C][C]-0.175575[/C][C]-1.4794[/C][C]0.071726[/C][/ROW]
[ROW][C]17[/C][C]0.282314[/C][C]2.3788[/C][C]0.01003[/C][/ROW]
[ROW][C]18[/C][C]-0.035711[/C][C]-0.3009[/C][C]0.382181[/C][/ROW]
[ROW][C]19[/C][C]-0.145071[/C][C]-1.2224[/C][C]0.112801[/C][/ROW]
[ROW][C]20[/C][C]0.100982[/C][C]0.8509[/C][C]0.198846[/C][/ROW]
[ROW][C]21[/C][C]0.075633[/C][C]0.6373[/C][C]0.26299[/C][/ROW]
[ROW][C]22[/C][C]-0.200065[/C][C]-1.6858[/C][C]0.048114[/C][/ROW]
[ROW][C]23[/C][C]0.259208[/C][C]2.1841[/C][C]0.016129[/C][/ROW]
[ROW][C]24[/C][C]-0.173926[/C][C]-1.4655[/C][C]0.073596[/C][/ROW]
[ROW][C]25[/C][C]-0.092976[/C][C]-0.7834[/C][C]0.217991[/C][/ROW]
[ROW][C]26[/C][C]0.321091[/C][C]2.7056[/C][C]0.004266[/C][/ROW]
[ROW][C]27[/C][C]-0.159135[/C][C]-1.3409[/C][C]0.092114[/C][/ROW]
[ROW][C]28[/C][C]-0.058989[/C][C]-0.4971[/C][C]0.310343[/C][/ROW]
[ROW][C]29[/C][C]0.118815[/C][C]1.0012[/C][C]0.160077[/C][/ROW]
[ROW][C]30[/C][C]-0.076541[/C][C]-0.6449[/C][C]0.260521[/C][/ROW]
[ROW][C]31[/C][C]0.045797[/C][C]0.3859[/C][C]0.350366[/C][/ROW]
[ROW][C]32[/C][C]0.006254[/C][C]0.0527[/C][C]0.479059[/C][/ROW]
[ROW][C]33[/C][C]-0.133728[/C][C]-1.1268[/C][C]0.131808[/C][/ROW]
[ROW][C]34[/C][C]0.09111[/C][C]0.7677[/C][C]0.222603[/C][/ROW]
[ROW][C]35[/C][C]0.078791[/C][C]0.6639[/C][C]0.25445[/C][/ROW]
[ROW][C]36[/C][C]-0.123013[/C][C]-1.0365[/C][C]0.151738[/C][/ROW]
[/TABLE]
Source: https://freestatistics.org/blog/index.php?pk=32205&T=1

Globally Unique Identifier (entire table): ba.freestatistics.org/blog/index.php?pk=32205&T=1

As an alternative you can also use a QR Code:  

The GUIDs for individual cells are displayed in the table below:

Autocorrelation Function
Time lag kACF(k)T-STATP-value
1-0.467235-3.9379.5e-05
2-0.012439-0.10480.458409
30.1625371.36960.087571
4-0.079773-0.67220.251826
50.0279630.23560.407202
60.0699560.58950.278713
7-0.114557-0.96530.168843
8-0.077825-0.65580.257047
90.3095972.60870.005537
10-0.220689-1.85960.033546
110.0681790.57450.283728
12-0.026762-0.22550.411119
13-0.138487-1.16690.123575
140.1758031.48130.07147
15-0.116584-0.98240.164631
16-0.175575-1.47940.071726
170.2823142.37880.01003
18-0.035711-0.30090.382181
19-0.145071-1.22240.112801
200.1009820.85090.198846
210.0756330.63730.26299
22-0.200065-1.68580.048114
230.2592082.18410.016129
24-0.173926-1.46550.073596
25-0.092976-0.78340.217991
260.3210912.70560.004266
27-0.159135-1.34090.092114
28-0.058989-0.49710.310343
290.1188151.00120.160077
30-0.076541-0.64490.260521
310.0457970.38590.350366
320.0062540.05270.479059
33-0.133728-1.12680.131808
340.091110.76770.222603
350.0787910.66390.25445
36-0.123013-1.03650.151738


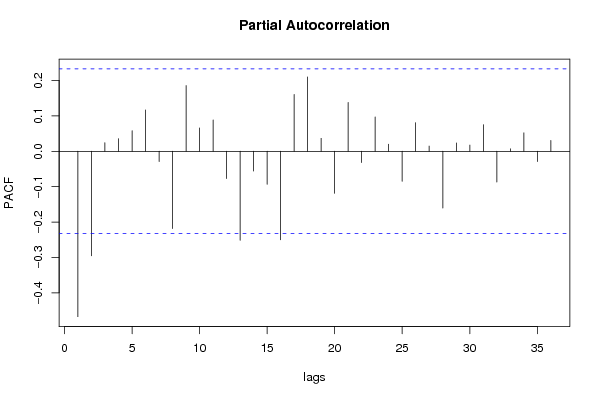
Partial Autocorrelation Function
Time lag kPACF(k)T-STATP-value
1-0.467235-3.9379.5e-05
2-0.295189-2.48730.007611
30.0239450.20180.420341
40.0352440.2970.383679
50.0578810.48770.313628
60.1169150.98510.163949
7-0.028891-0.24340.404182
8-0.218292-1.83940.035022
90.1856381.56420.061107
100.065950.55570.290079
110.0885090.74580.229128
12-0.076957-0.64840.259393
13-0.251353-2.11790.018841
14-0.055671-0.46910.32022
15-0.093286-0.7860.21723
16-0.249952-2.10610.019364
170.1606831.35390.090024
180.2099291.76890.040603
190.0365640.30810.379458
20-0.118594-0.99930.160524
210.1379241.16220.124529
22-0.031551-0.26590.39556
230.0966620.81450.209045
240.0197180.16620.434256
25-0.08468-0.71350.238929
260.0808870.68160.248865
270.0146080.12310.451191
28-0.160476-1.35220.090302
290.0234690.19780.421901
300.0174740.14720.441679
310.0749750.63180.264789
32-0.086811-0.73150.233445
330.0068020.05730.477228
340.0521310.43930.330902
35-0.028869-0.24330.404255
360.0307020.25870.398309

\begin{tabular}{lllllllll}
\hline
Partial Autocorrelation Function \tabularnewline
Time lag k & PACF(k) & T-STAT & P-value \tabularnewline
1 & -0.467235 & -3.937 & 9.5e-05 \tabularnewline
2 & -0.295189 & -2.4873 & 0.007611 \tabularnewline
3 & 0.023945 & 0.2018 & 0.420341 \tabularnewline
4 & 0.035244 & 0.297 & 0.383679 \tabularnewline
5 & 0.057881 & 0.4877 & 0.313628 \tabularnewline
6 & 0.116915 & 0.9851 & 0.163949 \tabularnewline
7 & -0.028891 & -0.2434 & 0.404182 \tabularnewline
8 & -0.218292 & -1.8394 & 0.035022 \tabularnewline
9 & 0.185638 & 1.5642 & 0.061107 \tabularnewline
10 & 0.06595 & 0.5557 & 0.290079 \tabularnewline
11 & 0.088509 & 0.7458 & 0.229128 \tabularnewline
12 & -0.076957 & -0.6484 & 0.259393 \tabularnewline
13 & -0.251353 & -2.1179 & 0.018841 \tabularnewline
14 & -0.055671 & -0.4691 & 0.32022 \tabularnewline
15 & -0.093286 & -0.786 & 0.21723 \tabularnewline
16 & -0.249952 & -2.1061 & 0.019364 \tabularnewline
17 & 0.160683 & 1.3539 & 0.090024 \tabularnewline
18 & 0.209929 & 1.7689 & 0.040603 \tabularnewline
19 & 0.036564 & 0.3081 & 0.379458 \tabularnewline
20 & -0.118594 & -0.9993 & 0.160524 \tabularnewline
21 & 0.137924 & 1.1622 & 0.124529 \tabularnewline
22 & -0.031551 & -0.2659 & 0.39556 \tabularnewline
23 & 0.096662 & 0.8145 & 0.209045 \tabularnewline
24 & 0.019718 & 0.1662 & 0.434256 \tabularnewline
25 & -0.08468 & -0.7135 & 0.238929 \tabularnewline
26 & 0.080887 & 0.6816 & 0.248865 \tabularnewline
27 & 0.014608 & 0.1231 & 0.451191 \tabularnewline
28 & -0.160476 & -1.3522 & 0.090302 \tabularnewline
29 & 0.023469 & 0.1978 & 0.421901 \tabularnewline
30 & 0.017474 & 0.1472 & 0.441679 \tabularnewline
31 & 0.074975 & 0.6318 & 0.264789 \tabularnewline
32 & -0.086811 & -0.7315 & 0.233445 \tabularnewline
33 & 0.006802 & 0.0573 & 0.477228 \tabularnewline
34 & 0.052131 & 0.4393 & 0.330902 \tabularnewline
35 & -0.028869 & -0.2433 & 0.404255 \tabularnewline
36 & 0.030702 & 0.2587 & 0.398309 \tabularnewline
\hline
\end{tabular}
%Source: https://freestatistics.org/blog/index.php?pk=32205&T=2

[TABLE]
[ROW][C]Partial Autocorrelation Function[/C][/ROW]
[ROW][C]Time lag k[/C][C]PACF(k)[/C][C]T-STAT[/C][C]P-value[/C][/ROW]
[ROW][C]1[/C][C]-0.467235[/C][C]-3.937[/C][C]9.5e-05[/C][/ROW]
[ROW][C]2[/C][C]-0.295189[/C][C]-2.4873[/C][C]0.007611[/C][/ROW]
[ROW][C]3[/C][C]0.023945[/C][C]0.2018[/C][C]0.420341[/C][/ROW]
[ROW][C]4[/C][C]0.035244[/C][C]0.297[/C][C]0.383679[/C][/ROW]
[ROW][C]5[/C][C]0.057881[/C][C]0.4877[/C][C]0.313628[/C][/ROW]
[ROW][C]6[/C][C]0.116915[/C][C]0.9851[/C][C]0.163949[/C][/ROW]
[ROW][C]7[/C][C]-0.028891[/C][C]-0.2434[/C][C]0.404182[/C][/ROW]
[ROW][C]8[/C][C]-0.218292[/C][C]-1.8394[/C][C]0.035022[/C][/ROW]
[ROW][C]9[/C][C]0.185638[/C][C]1.5642[/C][C]0.061107[/C][/ROW]
[ROW][C]10[/C][C]0.06595[/C][C]0.5557[/C][C]0.290079[/C][/ROW]
[ROW][C]11[/C][C]0.088509[/C][C]0.7458[/C][C]0.229128[/C][/ROW]
[ROW][C]12[/C][C]-0.076957[/C][C]-0.6484[/C][C]0.259393[/C][/ROW]
[ROW][C]13[/C][C]-0.251353[/C][C]-2.1179[/C][C]0.018841[/C][/ROW]
[ROW][C]14[/C][C]-0.055671[/C][C]-0.4691[/C][C]0.32022[/C][/ROW]
[ROW][C]15[/C][C]-0.093286[/C][C]-0.786[/C][C]0.21723[/C][/ROW]
[ROW][C]16[/C][C]-0.249952[/C][C]-2.1061[/C][C]0.019364[/C][/ROW]
[ROW][C]17[/C][C]0.160683[/C][C]1.3539[/C][C]0.090024[/C][/ROW]
[ROW][C]18[/C][C]0.209929[/C][C]1.7689[/C][C]0.040603[/C][/ROW]
[ROW][C]19[/C][C]0.036564[/C][C]0.3081[/C][C]0.379458[/C][/ROW]
[ROW][C]20[/C][C]-0.118594[/C][C]-0.9993[/C][C]0.160524[/C][/ROW]
[ROW][C]21[/C][C]0.137924[/C][C]1.1622[/C][C]0.124529[/C][/ROW]
[ROW][C]22[/C][C]-0.031551[/C][C]-0.2659[/C][C]0.39556[/C][/ROW]
[ROW][C]23[/C][C]0.096662[/C][C]0.8145[/C][C]0.209045[/C][/ROW]
[ROW][C]24[/C][C]0.019718[/C][C]0.1662[/C][C]0.434256[/C][/ROW]
[ROW][C]25[/C][C]-0.08468[/C][C]-0.7135[/C][C]0.238929[/C][/ROW]
[ROW][C]26[/C][C]0.080887[/C][C]0.6816[/C][C]0.248865[/C][/ROW]
[ROW][C]27[/C][C]0.014608[/C][C]0.1231[/C][C]0.451191[/C][/ROW]
[ROW][C]28[/C][C]-0.160476[/C][C]-1.3522[/C][C]0.090302[/C][/ROW]
[ROW][C]29[/C][C]0.023469[/C][C]0.1978[/C][C]0.421901[/C][/ROW]
[ROW][C]30[/C][C]0.017474[/C][C]0.1472[/C][C]0.441679[/C][/ROW]
[ROW][C]31[/C][C]0.074975[/C][C]0.6318[/C][C]0.264789[/C][/ROW]
[ROW][C]32[/C][C]-0.086811[/C][C]-0.7315[/C][C]0.233445[/C][/ROW]
[ROW][C]33[/C][C]0.006802[/C][C]0.0573[/C][C]0.477228[/C][/ROW]
[ROW][C]34[/C][C]0.052131[/C][C]0.4393[/C][C]0.330902[/C][/ROW]
[ROW][C]35[/C][C]-0.028869[/C][C]-0.2433[/C][C]0.404255[/C][/ROW]
[ROW][C]36[/C][C]0.030702[/C][C]0.2587[/C][C]0.398309[/C][/ROW]
[/TABLE]
Source: https://freestatistics.org/blog/index.php?pk=32205&T=2

Globally Unique Identifier (entire table): ba.freestatistics.org/blog/index.php?pk=32205&T=2

As an alternative you can also use a QR Code:  

The GUIDs for individual cells are displayed in the table below:

Partial Autocorrelation Function
Time lag kPACF(k)T-STATP-value
1-0.467235-3.9379.5e-05
2-0.295189-2.48730.007611
30.0239450.20180.420341
40.0352440.2970.383679
50.0578810.48770.313628
60.1169150.98510.163949
7-0.028891-0.24340.404182
8-0.218292-1.83940.035022
90.1856381.56420.061107
100.065950.55570.290079
110.0885090.74580.229128
12-0.076957-0.64840.259393
13-0.251353-2.11790.018841
14-0.055671-0.46910.32022
15-0.093286-0.7860.21723
16-0.249952-2.10610.019364
170.1606831.35390.090024
180.2099291.76890.040603
190.0365640.30810.379458
20-0.118594-0.99930.160524
210.1379241.16220.124529
22-0.031551-0.26590.39556
230.0966620.81450.209045
240.0197180.16620.434256
25-0.08468-0.71350.238929
260.0808870.68160.248865
270.0146080.12310.451191
28-0.160476-1.35220.090302
290.0234690.19780.421901
300.0174740.14720.441679
310.0749750.63180.264789
32-0.086811-0.73150.233445
330.0068020.05730.477228
340.0521310.43930.330902
35-0.028869-0.24330.404255
360.0307020.25870.398309


Parameters (Session):
par1 = 36 ; par2 = 1 ; par3 = 1 ; par4 = 1 ; par5 = 12 ;
Parameters (R input):
par1 = 36 ; par2 = 1 ; par3 = 1 ; par4 = 1 ; par5 = 12 ;
R code (references can be found in the software module):
if (par1 == 'Default') {
par1 = 10*log10(length(x))
} else {
par1 <- as.numeric(par1)
}
par2 <- as.numeric(par2)
par3 <- as.numeric(par3)
par4 <- as.numeric(par4)
par5 <- as.numeric(par5)
if (par2 == 0) {
x <- log(x)
} else {
x <- (x ^ par2 - 1) / par2
}
if (par3 > 0) x <- diff(x,lag=1,difference=par3)
if (par4 > 0) x <- diff(x,lag=par5,difference=par4)
bitmap(file='pic1.png')
racf <- acf(x,par1,main='Autocorrelation',xlab='lags',ylab='ACF')
dev.off()
bitmap(file='pic2.png')
rpacf <- pacf(x,par1,main='Partial Autocorrelation',xlab='lags',ylab='PACF')
dev.off()
(myacf <- c(racf$acf))
(mypacf <- c(rpacf$acf))
lengthx <- length(x)
sqrtn <- sqrt(lengthx)
load(file='createtable')
a<-table.start()
a<-table.row.start(a)
a<-table.element(a,'Autocorrelation Function',4,TRUE)
a<-table.row.end(a)
a<-table.row.start(a)
a<-table.element(a,'Time lag k',header=TRUE)
a<-table.element(a,hyperlink('basics.htm','ACF(k)','click here for more information about the Autocorrelation Function'),header=TRUE)
a<-table.element(a,'T-STAT',header=TRUE)
a<-table.element(a,'P-value',header=TRUE)
a<-table.row.end(a)
for (i in 2:(par1+1)) {
a<-table.row.start(a)
a<-table.element(a,i-1,header=TRUE)
a<-table.element(a,round(myacf[i],6))
mytstat <- myacf[i]*sqrtn
a<-table.element(a,round(mytstat,4))
a<-table.element(a,round(1-pt(abs(mytstat),lengthx),6))
a<-table.row.end(a)
}
a<-table.end(a)
table.save(a,file='mytable.tab')
a<-table.start()
a<-table.row.start(a)
a<-table.element(a,'Partial Autocorrelation Function',4,TRUE)
a<-table.row.end(a)
a<-table.row.start(a)
a<-table.element(a,'Time lag k',header=TRUE)
a<-table.element(a,hyperlink('basics.htm','PACF(k)','click here for more information about the Partial Autocorrelation Function'),header=TRUE)
a<-table.element(a,'T-STAT',header=TRUE)
a<-table.element(a,'P-value',header=TRUE)
a<-table.row.end(a)
for (i in 1:par1) {
a<-table.row.start(a)
a<-table.element(a,i,header=TRUE)
a<-table.element(a,round(mypacf[i],6))
mytstat <- mypacf[i]*sqrtn
a<-table.element(a,round(mytstat,4))
a<-table.element(a,round(1-pt(abs(mytstat),lengthx),6))
a<-table.row.end(a)
}
a<-table.end(a)
table.save(a,file='mytable1.tab')