Free Statistics

of Irreproducible Research!

Author's title

Author*The author of this computation has been verified*
R Software Modulerwasp_autocorrelation.wasp
Title produced by software(Partial) Autocorrelation Function
Date of computationThu, 11 Dec 2008 05:47:22 -0700
Cite this page as followsStatistical Computations at FreeStatistics.org, Office for Research Development and Education, URL https://freestatistics.org/blog/index.php?v=date/2008/Dec/11/t12289996833boog7mpsby8393.htm/, Retrieved Sun, 19 May 2024 08:01:21 +0000
Statistical Computations at FreeStatistics.org, Office for Research Development and Education, URL https://freestatistics.org/blog/index.php?pk=32202, Retrieved Sun, 19 May 2024 08:01:21 +0000
QR Codes:

Original text written by user:
IsPrivate?No (this computation is public)
User-defined keywords
Estimated Impact156
Family? (F = Feedback message, R = changed R code, M = changed R Module, P = changed Parameters, D = changed Data)
-       [(Partial) Autocorrelation Function] [Autocorrelatie d=1] [2008-12-11 12:47:22] [a9e6d7cd6e144e8b311d9f96a24c5a25] [Current]
Feedback Forum

Post a new message
Dataseries X:
2648.9
2669.6
3042.3
2604.2
2732.1
2621.7
2483.7
2479.3
2684.6
2834.7
2566.1
2251.2
2350
2299.8
2542.8
2530.2
2508.1
2616.8
2534.1
2181.8
2578.9
2841.9
2529.9
2103.2
2326.2
2452.6
2782.1
2727.3
2648.2
2760.7
2613
2225.4
2713.9
2923.3
2707
2473.9
2521
2531.8
3068.8
2826.9
2674.2
2966.6
2798.8
2629.6
3124.6
3115.7
3083
2863.9
2728.7
2789.4
3225.7
3148.2
2836.5
3153.5
2656.9
2834.7
3172.5
2998.8
3103.1
2735.6
2818.1
2874.4
3438.5
2949.1
3306.8
3530
3003.8
3206.4
3514.6
3522.6
3525.5
2996.2
3231.1
3030
3541.7
3113.2
3390.8
3424.2
3079.8
3123.4
3317.1
3579.9
3317.9
2668.1


Summary of computational transaction
Raw Inputview raw input (R code)
Raw Outputview raw output of R engine
Computing time1 seconds
R Server'George Udny Yule' @ 72.249.76.132

\begin{tabular}{lllllllll}
\hline
Summary of computational transaction \tabularnewline
Raw Input & view raw input (R code)  \tabularnewline
Raw Output & view raw output of R engine  \tabularnewline
Computing time & 1 seconds \tabularnewline
R Server & 'George Udny Yule' @ 72.249.76.132 \tabularnewline
\hline
\end{tabular}
%Source: https://freestatistics.org/blog/index.php?pk=32202&T=0

[TABLE]
[ROW][C]Summary of computational transaction[/C][/ROW]
[ROW][C]Raw Input[/C][C]view raw input (R code) [/C][/ROW]
[ROW][C]Raw Output[/C][C]view raw output of R engine [/C][/ROW]
[ROW][C]Computing time[/C][C]1 seconds[/C][/ROW]
[ROW][C]R Server[/C][C]'George Udny Yule' @ 72.249.76.132[/C][/ROW]
[/TABLE]
Source: https://freestatistics.org/blog/index.php?pk=32202&T=0

Globally Unique Identifier (entire table): ba.freestatistics.org/blog/index.php?pk=32202&T=0

As an alternative you can also use a QR Code:  

The GUIDs for individual cells are displayed in the table below:

Summary of computational transaction
Raw Inputview raw input (R code)
Raw Outputview raw output of R engine
Computing time1 seconds
R Server'George Udny Yule' @ 72.249.76.132


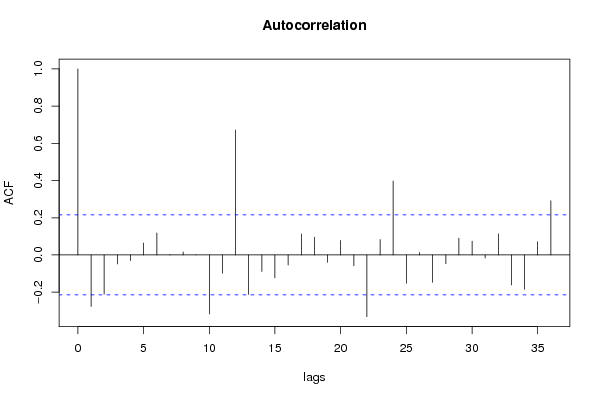
Autocorrelation Function
Time lag kACF(k)T-STATP-value
1-0.276828-2.5220.006789
2-0.210699-1.91960.029175
3-0.047904-0.43640.331831
4-0.03039-0.27690.391285
50.0641380.58430.280293
60.1185611.08010.141604
70.0019240.01750.493028
80.0163450.14890.440994
90.0011670.01060.495771
10-0.316753-2.88580.002487
11-0.098324-0.89580.186481
120.6712166.11510
13-0.212171-1.9330.028325
14-0.088477-0.80610.211254
15-0.122735-1.11820.13336
16-0.054509-0.49660.31039
170.1122481.02260.154727
180.095450.86960.193516
19-0.039567-0.36050.359705
200.0782660.7130.23891
21-0.058415-0.53220.298011
22-0.331598-3.0210.001674
230.0825450.7520.227082
240.3971423.61810.000254
25-0.151535-1.38050.085562
260.0139350.1270.449643
27-0.147079-1.340.091958
28-0.047014-0.42830.334764
290.0904960.82450.206021
300.0740880.6750.250785
31-0.016334-0.14880.441032
320.1134141.03320.152245
33-0.161369-1.47010.072652
34-0.184004-1.67640.048716
350.0716710.6530.257794
360.2911692.65270.004783

\begin{tabular}{lllllllll}
\hline
Autocorrelation Function \tabularnewline
Time lag k & ACF(k) & T-STAT & P-value \tabularnewline
1 & -0.276828 & -2.522 & 0.006789 \tabularnewline
2 & -0.210699 & -1.9196 & 0.029175 \tabularnewline
3 & -0.047904 & -0.4364 & 0.331831 \tabularnewline
4 & -0.03039 & -0.2769 & 0.391285 \tabularnewline
5 & 0.064138 & 0.5843 & 0.280293 \tabularnewline
6 & 0.118561 & 1.0801 & 0.141604 \tabularnewline
7 & 0.001924 & 0.0175 & 0.493028 \tabularnewline
8 & 0.016345 & 0.1489 & 0.440994 \tabularnewline
9 & 0.001167 & 0.0106 & 0.495771 \tabularnewline
10 & -0.316753 & -2.8858 & 0.002487 \tabularnewline
11 & -0.098324 & -0.8958 & 0.186481 \tabularnewline
12 & 0.671216 & 6.1151 & 0 \tabularnewline
13 & -0.212171 & -1.933 & 0.028325 \tabularnewline
14 & -0.088477 & -0.8061 & 0.211254 \tabularnewline
15 & -0.122735 & -1.1182 & 0.13336 \tabularnewline
16 & -0.054509 & -0.4966 & 0.31039 \tabularnewline
17 & 0.112248 & 1.0226 & 0.154727 \tabularnewline
18 & 0.09545 & 0.8696 & 0.193516 \tabularnewline
19 & -0.039567 & -0.3605 & 0.359705 \tabularnewline
20 & 0.078266 & 0.713 & 0.23891 \tabularnewline
21 & -0.058415 & -0.5322 & 0.298011 \tabularnewline
22 & -0.331598 & -3.021 & 0.001674 \tabularnewline
23 & 0.082545 & 0.752 & 0.227082 \tabularnewline
24 & 0.397142 & 3.6181 & 0.000254 \tabularnewline
25 & -0.151535 & -1.3805 & 0.085562 \tabularnewline
26 & 0.013935 & 0.127 & 0.449643 \tabularnewline
27 & -0.147079 & -1.34 & 0.091958 \tabularnewline
28 & -0.047014 & -0.4283 & 0.334764 \tabularnewline
29 & 0.090496 & 0.8245 & 0.206021 \tabularnewline
30 & 0.074088 & 0.675 & 0.250785 \tabularnewline
31 & -0.016334 & -0.1488 & 0.441032 \tabularnewline
32 & 0.113414 & 1.0332 & 0.152245 \tabularnewline
33 & -0.161369 & -1.4701 & 0.072652 \tabularnewline
34 & -0.184004 & -1.6764 & 0.048716 \tabularnewline
35 & 0.071671 & 0.653 & 0.257794 \tabularnewline
36 & 0.291169 & 2.6527 & 0.004783 \tabularnewline
\hline
\end{tabular}
%Source: https://freestatistics.org/blog/index.php?pk=32202&T=1

[TABLE]
[ROW][C]Autocorrelation Function[/C][/ROW]
[ROW][C]Time lag k[/C][C]ACF(k)[/C][C]T-STAT[/C][C]P-value[/C][/ROW]
[ROW][C]1[/C][C]-0.276828[/C][C]-2.522[/C][C]0.006789[/C][/ROW]
[ROW][C]2[/C][C]-0.210699[/C][C]-1.9196[/C][C]0.029175[/C][/ROW]
[ROW][C]3[/C][C]-0.047904[/C][C]-0.4364[/C][C]0.331831[/C][/ROW]
[ROW][C]4[/C][C]-0.03039[/C][C]-0.2769[/C][C]0.391285[/C][/ROW]
[ROW][C]5[/C][C]0.064138[/C][C]0.5843[/C][C]0.280293[/C][/ROW]
[ROW][C]6[/C][C]0.118561[/C][C]1.0801[/C][C]0.141604[/C][/ROW]
[ROW][C]7[/C][C]0.001924[/C][C]0.0175[/C][C]0.493028[/C][/ROW]
[ROW][C]8[/C][C]0.016345[/C][C]0.1489[/C][C]0.440994[/C][/ROW]
[ROW][C]9[/C][C]0.001167[/C][C]0.0106[/C][C]0.495771[/C][/ROW]
[ROW][C]10[/C][C]-0.316753[/C][C]-2.8858[/C][C]0.002487[/C][/ROW]
[ROW][C]11[/C][C]-0.098324[/C][C]-0.8958[/C][C]0.186481[/C][/ROW]
[ROW][C]12[/C][C]0.671216[/C][C]6.1151[/C][C]0[/C][/ROW]
[ROW][C]13[/C][C]-0.212171[/C][C]-1.933[/C][C]0.028325[/C][/ROW]
[ROW][C]14[/C][C]-0.088477[/C][C]-0.8061[/C][C]0.211254[/C][/ROW]
[ROW][C]15[/C][C]-0.122735[/C][C]-1.1182[/C][C]0.13336[/C][/ROW]
[ROW][C]16[/C][C]-0.054509[/C][C]-0.4966[/C][C]0.31039[/C][/ROW]
[ROW][C]17[/C][C]0.112248[/C][C]1.0226[/C][C]0.154727[/C][/ROW]
[ROW][C]18[/C][C]0.09545[/C][C]0.8696[/C][C]0.193516[/C][/ROW]
[ROW][C]19[/C][C]-0.039567[/C][C]-0.3605[/C][C]0.359705[/C][/ROW]
[ROW][C]20[/C][C]0.078266[/C][C]0.713[/C][C]0.23891[/C][/ROW]
[ROW][C]21[/C][C]-0.058415[/C][C]-0.5322[/C][C]0.298011[/C][/ROW]
[ROW][C]22[/C][C]-0.331598[/C][C]-3.021[/C][C]0.001674[/C][/ROW]
[ROW][C]23[/C][C]0.082545[/C][C]0.752[/C][C]0.227082[/C][/ROW]
[ROW][C]24[/C][C]0.397142[/C][C]3.6181[/C][C]0.000254[/C][/ROW]
[ROW][C]25[/C][C]-0.151535[/C][C]-1.3805[/C][C]0.085562[/C][/ROW]
[ROW][C]26[/C][C]0.013935[/C][C]0.127[/C][C]0.449643[/C][/ROW]
[ROW][C]27[/C][C]-0.147079[/C][C]-1.34[/C][C]0.091958[/C][/ROW]
[ROW][C]28[/C][C]-0.047014[/C][C]-0.4283[/C][C]0.334764[/C][/ROW]
[ROW][C]29[/C][C]0.090496[/C][C]0.8245[/C][C]0.206021[/C][/ROW]
[ROW][C]30[/C][C]0.074088[/C][C]0.675[/C][C]0.250785[/C][/ROW]
[ROW][C]31[/C][C]-0.016334[/C][C]-0.1488[/C][C]0.441032[/C][/ROW]
[ROW][C]32[/C][C]0.113414[/C][C]1.0332[/C][C]0.152245[/C][/ROW]
[ROW][C]33[/C][C]-0.161369[/C][C]-1.4701[/C][C]0.072652[/C][/ROW]
[ROW][C]34[/C][C]-0.184004[/C][C]-1.6764[/C][C]0.048716[/C][/ROW]
[ROW][C]35[/C][C]0.071671[/C][C]0.653[/C][C]0.257794[/C][/ROW]
[ROW][C]36[/C][C]0.291169[/C][C]2.6527[/C][C]0.004783[/C][/ROW]
[/TABLE]
Source: https://freestatistics.org/blog/index.php?pk=32202&T=1

Globally Unique Identifier (entire table): ba.freestatistics.org/blog/index.php?pk=32202&T=1

As an alternative you can also use a QR Code:  

The GUIDs for individual cells are displayed in the table below:

Autocorrelation Function
Time lag kACF(k)T-STATP-value
1-0.276828-2.5220.006789
2-0.210699-1.91960.029175
3-0.047904-0.43640.331831
4-0.03039-0.27690.391285
50.0641380.58430.280293
60.1185611.08010.141604
70.0019240.01750.493028
80.0163450.14890.440994
90.0011670.01060.495771
10-0.316753-2.88580.002487
11-0.098324-0.89580.186481
120.6712166.11510
13-0.212171-1.9330.028325
14-0.088477-0.80610.211254
15-0.122735-1.11820.13336
16-0.054509-0.49660.31039
170.1122481.02260.154727
180.095450.86960.193516
19-0.039567-0.36050.359705
200.0782660.7130.23891
21-0.058415-0.53220.298011
22-0.331598-3.0210.001674
230.0825450.7520.227082
240.3971423.61810.000254
25-0.151535-1.38050.085562
260.0139350.1270.449643
27-0.147079-1.340.091958
28-0.047014-0.42830.334764
290.0904960.82450.206021
300.0740880.6750.250785
31-0.016334-0.14880.441032
320.1134141.03320.152245
33-0.161369-1.47010.072652
34-0.184004-1.67640.048716
350.0716710.6530.257794
360.2911692.65270.004783


Partial Autocorrelation Function
Time lag kPACF(k)T-STATP-value
1-0.276828-2.5220.006789
2-0.31118-2.8350.002877
3-0.252442-2.29990.011984
4-0.264208-2.40710.00915
5-0.174321-1.58810.058028
6-0.01114-0.10150.459701
70.0461830.42080.337512
80.1590291.44880.075578
90.225742.05660.021433
10-0.201858-1.8390.034745
11-0.470742-4.28872.4e-05
120.406513.70350.000191
130.0772450.70370.241785
140.0779390.71010.239829
15-0.03882-0.35370.362243
16-0.056332-0.51320.304585
17-0.011651-0.10610.45786
180.0092110.08390.466663
19-0.017832-0.16250.435669
200.0279220.25440.399913
21-0.101357-0.92340.179237
22-0.152133-1.3860.084729
230.045110.4110.341075
24-0.028007-0.25520.399618
25-0.090861-0.82780.205084
260.0102090.0930.463061
270.0736540.6710.252034
280.0804960.73340.232703
29-0.029617-0.26980.393982
300.0106360.09690.46152
310.0218360.19890.4214
32-0.013439-0.12240.451426
33-0.126324-1.15090.126546
340.115141.0490.148618
35-0.109259-0.99540.161219
360.0744370.67810.249782

\begin{tabular}{lllllllll}
\hline
Partial Autocorrelation Function \tabularnewline
Time lag k & PACF(k) & T-STAT & P-value \tabularnewline
1 & -0.276828 & -2.522 & 0.006789 \tabularnewline
2 & -0.31118 & -2.835 & 0.002877 \tabularnewline
3 & -0.252442 & -2.2999 & 0.011984 \tabularnewline
4 & -0.264208 & -2.4071 & 0.00915 \tabularnewline
5 & -0.174321 & -1.5881 & 0.058028 \tabularnewline
6 & -0.01114 & -0.1015 & 0.459701 \tabularnewline
7 & 0.046183 & 0.4208 & 0.337512 \tabularnewline
8 & 0.159029 & 1.4488 & 0.075578 \tabularnewline
9 & 0.22574 & 2.0566 & 0.021433 \tabularnewline
10 & -0.201858 & -1.839 & 0.034745 \tabularnewline
11 & -0.470742 & -4.2887 & 2.4e-05 \tabularnewline
12 & 0.40651 & 3.7035 & 0.000191 \tabularnewline
13 & 0.077245 & 0.7037 & 0.241785 \tabularnewline
14 & 0.077939 & 0.7101 & 0.239829 \tabularnewline
15 & -0.03882 & -0.3537 & 0.362243 \tabularnewline
16 & -0.056332 & -0.5132 & 0.304585 \tabularnewline
17 & -0.011651 & -0.1061 & 0.45786 \tabularnewline
18 & 0.009211 & 0.0839 & 0.466663 \tabularnewline
19 & -0.017832 & -0.1625 & 0.435669 \tabularnewline
20 & 0.027922 & 0.2544 & 0.399913 \tabularnewline
21 & -0.101357 & -0.9234 & 0.179237 \tabularnewline
22 & -0.152133 & -1.386 & 0.084729 \tabularnewline
23 & 0.04511 & 0.411 & 0.341075 \tabularnewline
24 & -0.028007 & -0.2552 & 0.399618 \tabularnewline
25 & -0.090861 & -0.8278 & 0.205084 \tabularnewline
26 & 0.010209 & 0.093 & 0.463061 \tabularnewline
27 & 0.073654 & 0.671 & 0.252034 \tabularnewline
28 & 0.080496 & 0.7334 & 0.232703 \tabularnewline
29 & -0.029617 & -0.2698 & 0.393982 \tabularnewline
30 & 0.010636 & 0.0969 & 0.46152 \tabularnewline
31 & 0.021836 & 0.1989 & 0.4214 \tabularnewline
32 & -0.013439 & -0.1224 & 0.451426 \tabularnewline
33 & -0.126324 & -1.1509 & 0.126546 \tabularnewline
34 & 0.11514 & 1.049 & 0.148618 \tabularnewline
35 & -0.109259 & -0.9954 & 0.161219 \tabularnewline
36 & 0.074437 & 0.6781 & 0.249782 \tabularnewline
\hline
\end{tabular}
%Source: https://freestatistics.org/blog/index.php?pk=32202&T=2

[TABLE]
[ROW][C]Partial Autocorrelation Function[/C][/ROW]
[ROW][C]Time lag k[/C][C]PACF(k)[/C][C]T-STAT[/C][C]P-value[/C][/ROW]
[ROW][C]1[/C][C]-0.276828[/C][C]-2.522[/C][C]0.006789[/C][/ROW]
[ROW][C]2[/C][C]-0.31118[/C][C]-2.835[/C][C]0.002877[/C][/ROW]
[ROW][C]3[/C][C]-0.252442[/C][C]-2.2999[/C][C]0.011984[/C][/ROW]
[ROW][C]4[/C][C]-0.264208[/C][C]-2.4071[/C][C]0.00915[/C][/ROW]
[ROW][C]5[/C][C]-0.174321[/C][C]-1.5881[/C][C]0.058028[/C][/ROW]
[ROW][C]6[/C][C]-0.01114[/C][C]-0.1015[/C][C]0.459701[/C][/ROW]
[ROW][C]7[/C][C]0.046183[/C][C]0.4208[/C][C]0.337512[/C][/ROW]
[ROW][C]8[/C][C]0.159029[/C][C]1.4488[/C][C]0.075578[/C][/ROW]
[ROW][C]9[/C][C]0.22574[/C][C]2.0566[/C][C]0.021433[/C][/ROW]
[ROW][C]10[/C][C]-0.201858[/C][C]-1.839[/C][C]0.034745[/C][/ROW]
[ROW][C]11[/C][C]-0.470742[/C][C]-4.2887[/C][C]2.4e-05[/C][/ROW]
[ROW][C]12[/C][C]0.40651[/C][C]3.7035[/C][C]0.000191[/C][/ROW]
[ROW][C]13[/C][C]0.077245[/C][C]0.7037[/C][C]0.241785[/C][/ROW]
[ROW][C]14[/C][C]0.077939[/C][C]0.7101[/C][C]0.239829[/C][/ROW]
[ROW][C]15[/C][C]-0.03882[/C][C]-0.3537[/C][C]0.362243[/C][/ROW]
[ROW][C]16[/C][C]-0.056332[/C][C]-0.5132[/C][C]0.304585[/C][/ROW]
[ROW][C]17[/C][C]-0.011651[/C][C]-0.1061[/C][C]0.45786[/C][/ROW]
[ROW][C]18[/C][C]0.009211[/C][C]0.0839[/C][C]0.466663[/C][/ROW]
[ROW][C]19[/C][C]-0.017832[/C][C]-0.1625[/C][C]0.435669[/C][/ROW]
[ROW][C]20[/C][C]0.027922[/C][C]0.2544[/C][C]0.399913[/C][/ROW]
[ROW][C]21[/C][C]-0.101357[/C][C]-0.9234[/C][C]0.179237[/C][/ROW]
[ROW][C]22[/C][C]-0.152133[/C][C]-1.386[/C][C]0.084729[/C][/ROW]
[ROW][C]23[/C][C]0.04511[/C][C]0.411[/C][C]0.341075[/C][/ROW]
[ROW][C]24[/C][C]-0.028007[/C][C]-0.2552[/C][C]0.399618[/C][/ROW]
[ROW][C]25[/C][C]-0.090861[/C][C]-0.8278[/C][C]0.205084[/C][/ROW]
[ROW][C]26[/C][C]0.010209[/C][C]0.093[/C][C]0.463061[/C][/ROW]
[ROW][C]27[/C][C]0.073654[/C][C]0.671[/C][C]0.252034[/C][/ROW]
[ROW][C]28[/C][C]0.080496[/C][C]0.7334[/C][C]0.232703[/C][/ROW]
[ROW][C]29[/C][C]-0.029617[/C][C]-0.2698[/C][C]0.393982[/C][/ROW]
[ROW][C]30[/C][C]0.010636[/C][C]0.0969[/C][C]0.46152[/C][/ROW]
[ROW][C]31[/C][C]0.021836[/C][C]0.1989[/C][C]0.4214[/C][/ROW]
[ROW][C]32[/C][C]-0.013439[/C][C]-0.1224[/C][C]0.451426[/C][/ROW]
[ROW][C]33[/C][C]-0.126324[/C][C]-1.1509[/C][C]0.126546[/C][/ROW]
[ROW][C]34[/C][C]0.11514[/C][C]1.049[/C][C]0.148618[/C][/ROW]
[ROW][C]35[/C][C]-0.109259[/C][C]-0.9954[/C][C]0.161219[/C][/ROW]
[ROW][C]36[/C][C]0.074437[/C][C]0.6781[/C][C]0.249782[/C][/ROW]
[/TABLE]
Source: https://freestatistics.org/blog/index.php?pk=32202&T=2

Globally Unique Identifier (entire table): ba.freestatistics.org/blog/index.php?pk=32202&T=2

As an alternative you can also use a QR Code:  

The GUIDs for individual cells are displayed in the table below:

Partial Autocorrelation Function
Time lag kPACF(k)T-STATP-value
1-0.276828-2.5220.006789
2-0.31118-2.8350.002877
3-0.252442-2.29990.011984
4-0.264208-2.40710.00915
5-0.174321-1.58810.058028
6-0.01114-0.10150.459701
70.0461830.42080.337512
80.1590291.44880.075578
90.225742.05660.021433
10-0.201858-1.8390.034745
11-0.470742-4.28872.4e-05
120.406513.70350.000191
130.0772450.70370.241785
140.0779390.71010.239829
15-0.03882-0.35370.362243
16-0.056332-0.51320.304585
17-0.011651-0.10610.45786
180.0092110.08390.466663
19-0.017832-0.16250.435669
200.0279220.25440.399913
21-0.101357-0.92340.179237
22-0.152133-1.3860.084729
230.045110.4110.341075
24-0.028007-0.25520.399618
25-0.090861-0.82780.205084
260.0102090.0930.463061
270.0736540.6710.252034
280.0804960.73340.232703
29-0.029617-0.26980.393982
300.0106360.09690.46152
310.0218360.19890.4214
32-0.013439-0.12240.451426
33-0.126324-1.15090.126546
340.115141.0490.148618
35-0.109259-0.99540.161219
360.0744370.67810.249782


Parameters (Session):
par1 = 36 ; par2 = 1 ; par3 = 1 ; par4 = 0 ; par5 = 12 ;
Parameters (R input):
par1 = 36 ; par2 = 1 ; par3 = 1 ; par4 = 0 ; par5 = 12 ;
R code (references can be found in the software module):
if (par1 == 'Default') {
par1 = 10*log10(length(x))
} else {
par1 <- as.numeric(par1)
}
par2 <- as.numeric(par2)
par3 <- as.numeric(par3)
par4 <- as.numeric(par4)
par5 <- as.numeric(par5)
if (par2 == 0) {
x <- log(x)
} else {
x <- (x ^ par2 - 1) / par2
}
if (par3 > 0) x <- diff(x,lag=1,difference=par3)
if (par4 > 0) x <- diff(x,lag=par5,difference=par4)
bitmap(file='pic1.png')
racf <- acf(x,par1,main='Autocorrelation',xlab='lags',ylab='ACF')
dev.off()
bitmap(file='pic2.png')
rpacf <- pacf(x,par1,main='Partial Autocorrelation',xlab='lags',ylab='PACF')
dev.off()
(myacf <- c(racf$acf))
(mypacf <- c(rpacf$acf))
lengthx <- length(x)
sqrtn <- sqrt(lengthx)
load(file='createtable')
a<-table.start()
a<-table.row.start(a)
a<-table.element(a,'Autocorrelation Function',4,TRUE)
a<-table.row.end(a)
a<-table.row.start(a)
a<-table.element(a,'Time lag k',header=TRUE)
a<-table.element(a,hyperlink('basics.htm','ACF(k)','click here for more information about the Autocorrelation Function'),header=TRUE)
a<-table.element(a,'T-STAT',header=TRUE)
a<-table.element(a,'P-value',header=TRUE)
a<-table.row.end(a)
for (i in 2:(par1+1)) {
a<-table.row.start(a)
a<-table.element(a,i-1,header=TRUE)
a<-table.element(a,round(myacf[i],6))
mytstat <- myacf[i]*sqrtn
a<-table.element(a,round(mytstat,4))
a<-table.element(a,round(1-pt(abs(mytstat),lengthx),6))
a<-table.row.end(a)
}
a<-table.end(a)
table.save(a,file='mytable.tab')
a<-table.start()
a<-table.row.start(a)
a<-table.element(a,'Partial Autocorrelation Function',4,TRUE)
a<-table.row.end(a)
a<-table.row.start(a)
a<-table.element(a,'Time lag k',header=TRUE)
a<-table.element(a,hyperlink('basics.htm','PACF(k)','click here for more information about the Partial Autocorrelation Function'),header=TRUE)
a<-table.element(a,'T-STAT',header=TRUE)
a<-table.element(a,'P-value',header=TRUE)
a<-table.row.end(a)
for (i in 1:par1) {
a<-table.row.start(a)
a<-table.element(a,i,header=TRUE)
a<-table.element(a,round(mypacf[i],6))
mytstat <- mypacf[i]*sqrtn
a<-table.element(a,round(mytstat,4))
a<-table.element(a,round(1-pt(abs(mytstat),lengthx),6))
a<-table.row.end(a)
}
a<-table.end(a)
table.save(a,file='mytable1.tab')