Free Statistics

of Irreproducible Research!

Author's title

Author*The author of this computation has been verified*
R Software Modulerwasp_autocorrelation.wasp
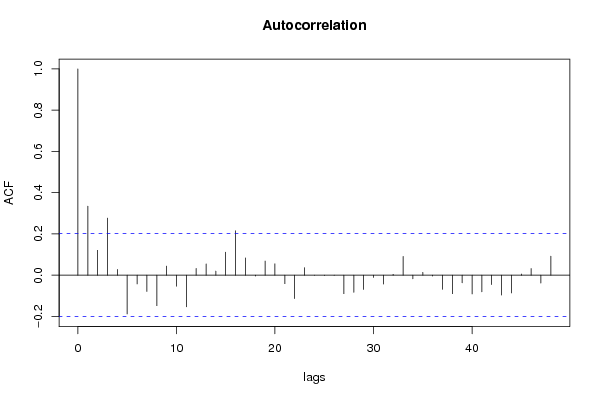
Title produced by software(Partial) Autocorrelation Function
Date of computationWed, 10 Dec 2008 13:56:24 -0700
Cite this page as followsStatistical Computations at FreeStatistics.org, Office for Research Development and Education, URL https://freestatistics.org/blog/index.php?v=date/2008/Dec/10/t1228942618q3vicbm3aajvrbn.htm/, Retrieved Sun, 19 May 2024 06:06:38 +0000
Statistical Computations at FreeStatistics.org, Office for Research Development and Education, URL https://freestatistics.org/blog/index.php?pk=32117, Retrieved Sun, 19 May 2024 06:06:38 +0000
QR Codes:

Original text written by user:
IsPrivate?No (this computation is public)
User-defined keywords
Estimated Impact152
Family? (F = Feedback message, R = changed R code, M = changed R Module, P = changed Parameters, D = changed Data)
-       [(Partial) Autocorrelation Function] [tijdreeks - evolu...] [2008-12-10 20:56:24] [5a908f428dae694075b2a25ba39af7a8] [Current]
Feedback Forum

Post a new message
Dataseries X:
93.4
98.5
100.8
102.3
104.7
101.1
101.4
99.5
98.4
96.3
100.7
101.2
100.3
97.8
97.4
98.6
99.7
99
98.1
97
98.5
103.8
114.4
124.5
134.2
131.8
125.6
119.9
114.9
115.5
112.5
111.4
115.3
110.8
103.7
111.1
113
111.2
117.6
121.7
127.3
129.8
137.1
141.4
137.4
130.7
117.2
110.8
111.4
108.2
108.8
110.2
109.5
109.5
116
111.2
112.1
114
119.1
114.1
115.1
115.4
110.8
116
119.2
126.5
127.8
131.3
140.3
137.3
143
134.5
139.9
159.3
170.4
175
175.8
180.9
180.3
169.6
172.3
184.8
177.7
184.6
211.4
215.3
215.9
244.7
259.3
289
310.9
321
315.1
333.2
314.1
284.7


Summary of computational transaction
Raw Inputview raw input (R code)
Raw Outputview raw output of R engine
Computing time1 seconds
R Server'Gwilym Jenkins' @ 72.249.127.135

\begin{tabular}{lllllllll}
\hline
Summary of computational transaction \tabularnewline
Raw Input & view raw input (R code)  \tabularnewline
Raw Output & view raw output of R engine  \tabularnewline
Computing time & 1 seconds \tabularnewline
R Server & 'Gwilym Jenkins' @ 72.249.127.135 \tabularnewline
\hline
\end{tabular}
%Source: https://freestatistics.org/blog/index.php?pk=32117&T=0

[TABLE]
[ROW][C]Summary of computational transaction[/C][/ROW]
[ROW][C]Raw Input[/C][C]view raw input (R code) [/C][/ROW]
[ROW][C]Raw Output[/C][C]view raw output of R engine [/C][/ROW]
[ROW][C]Computing time[/C][C]1 seconds[/C][/ROW]
[ROW][C]R Server[/C][C]'Gwilym Jenkins' @ 72.249.127.135[/C][/ROW]
[/TABLE]
Source: https://freestatistics.org/blog/index.php?pk=32117&T=0

Globally Unique Identifier (entire table): ba.freestatistics.org/blog/index.php?pk=32117&T=0

As an alternative you can also use a QR Code:  

The GUIDs for individual cells are displayed in the table below:

Summary of computational transaction
Raw Inputview raw input (R code)
Raw Outputview raw output of R engine
Computing time1 seconds
R Server'Gwilym Jenkins' @ 72.249.127.135


Autocorrelation Function
Time lag kACF(k)T-STATP-value
10.3347663.26290.000766
20.1206641.17610.12125
30.27672.69690.00414
40.0279920.27280.392787
5-0.187664-1.82910.035259
6-0.042536-0.41460.339688
7-0.078972-0.76970.221687
8-0.148172-1.44420.075987
90.0439270.42810.334757
10-0.053094-0.51750.303006
11-0.153164-1.49290.069394
120.0327470.31920.375147
130.0543310.52960.298829
140.0196880.19190.424117
150.1116531.08830.139617
160.215262.09810.019275
170.0833730.81260.209233
18-0.004054-0.03950.484282
190.0685680.66830.252776
200.0549070.53520.296892
21-0.041478-0.40430.343457
22-0.113277-1.10410.136172
230.0363730.35450.361867
240.0002280.00220.499115
25-0.001038-0.01010.495973
26-0.000818-0.0080.496826
27-0.089779-0.87510.191876
28-0.083354-0.81240.209286
29-0.068897-0.67150.251758
30-0.010745-0.10470.458405
31-0.043168-0.42070.337444
320.0042340.04130.483584
330.090720.88420.189403
34-0.017575-0.17130.432176
350.0136380.13290.447267
36-0.0043-0.04190.483329
37-0.068374-0.66640.253377
38-0.089475-0.87210.192677
39-0.037111-0.36170.359184
40-0.09101-0.88710.188645
41-0.080713-0.78670.216711
42-0.045517-0.44360.329154
43-0.096586-0.94140.174442
44-0.085987-0.83810.20204
450.0051850.05050.4799
460.0322720.31460.376896
47-0.038246-0.37280.355074
480.0918350.89510.186499

\begin{tabular}{lllllllll}
\hline
Autocorrelation Function \tabularnewline
Time lag k & ACF(k) & T-STAT & P-value \tabularnewline
1 & 0.334766 & 3.2629 & 0.000766 \tabularnewline
2 & 0.120664 & 1.1761 & 0.12125 \tabularnewline
3 & 0.2767 & 2.6969 & 0.00414 \tabularnewline
4 & 0.027992 & 0.2728 & 0.392787 \tabularnewline
5 & -0.187664 & -1.8291 & 0.035259 \tabularnewline
6 & -0.042536 & -0.4146 & 0.339688 \tabularnewline
7 & -0.078972 & -0.7697 & 0.221687 \tabularnewline
8 & -0.148172 & -1.4442 & 0.075987 \tabularnewline
9 & 0.043927 & 0.4281 & 0.334757 \tabularnewline
10 & -0.053094 & -0.5175 & 0.303006 \tabularnewline
11 & -0.153164 & -1.4929 & 0.069394 \tabularnewline
12 & 0.032747 & 0.3192 & 0.375147 \tabularnewline
13 & 0.054331 & 0.5296 & 0.298829 \tabularnewline
14 & 0.019688 & 0.1919 & 0.424117 \tabularnewline
15 & 0.111653 & 1.0883 & 0.139617 \tabularnewline
16 & 0.21526 & 2.0981 & 0.019275 \tabularnewline
17 & 0.083373 & 0.8126 & 0.209233 \tabularnewline
18 & -0.004054 & -0.0395 & 0.484282 \tabularnewline
19 & 0.068568 & 0.6683 & 0.252776 \tabularnewline
20 & 0.054907 & 0.5352 & 0.296892 \tabularnewline
21 & -0.041478 & -0.4043 & 0.343457 \tabularnewline
22 & -0.113277 & -1.1041 & 0.136172 \tabularnewline
23 & 0.036373 & 0.3545 & 0.361867 \tabularnewline
24 & 0.000228 & 0.0022 & 0.499115 \tabularnewline
25 & -0.001038 & -0.0101 & 0.495973 \tabularnewline
26 & -0.000818 & -0.008 & 0.496826 \tabularnewline
27 & -0.089779 & -0.8751 & 0.191876 \tabularnewline
28 & -0.083354 & -0.8124 & 0.209286 \tabularnewline
29 & -0.068897 & -0.6715 & 0.251758 \tabularnewline
30 & -0.010745 & -0.1047 & 0.458405 \tabularnewline
31 & -0.043168 & -0.4207 & 0.337444 \tabularnewline
32 & 0.004234 & 0.0413 & 0.483584 \tabularnewline
33 & 0.09072 & 0.8842 & 0.189403 \tabularnewline
34 & -0.017575 & -0.1713 & 0.432176 \tabularnewline
35 & 0.013638 & 0.1329 & 0.447267 \tabularnewline
36 & -0.0043 & -0.0419 & 0.483329 \tabularnewline
37 & -0.068374 & -0.6664 & 0.253377 \tabularnewline
38 & -0.089475 & -0.8721 & 0.192677 \tabularnewline
39 & -0.037111 & -0.3617 & 0.359184 \tabularnewline
40 & -0.09101 & -0.8871 & 0.188645 \tabularnewline
41 & -0.080713 & -0.7867 & 0.216711 \tabularnewline
42 & -0.045517 & -0.4436 & 0.329154 \tabularnewline
43 & -0.096586 & -0.9414 & 0.174442 \tabularnewline
44 & -0.085987 & -0.8381 & 0.20204 \tabularnewline
45 & 0.005185 & 0.0505 & 0.4799 \tabularnewline
46 & 0.032272 & 0.3146 & 0.376896 \tabularnewline
47 & -0.038246 & -0.3728 & 0.355074 \tabularnewline
48 & 0.091835 & 0.8951 & 0.186499 \tabularnewline
\hline
\end{tabular}
%Source: https://freestatistics.org/blog/index.php?pk=32117&T=1

[TABLE]
[ROW][C]Autocorrelation Function[/C][/ROW]
[ROW][C]Time lag k[/C][C]ACF(k)[/C][C]T-STAT[/C][C]P-value[/C][/ROW]
[ROW][C]1[/C][C]0.334766[/C][C]3.2629[/C][C]0.000766[/C][/ROW]
[ROW][C]2[/C][C]0.120664[/C][C]1.1761[/C][C]0.12125[/C][/ROW]
[ROW][C]3[/C][C]0.2767[/C][C]2.6969[/C][C]0.00414[/C][/ROW]
[ROW][C]4[/C][C]0.027992[/C][C]0.2728[/C][C]0.392787[/C][/ROW]
[ROW][C]5[/C][C]-0.187664[/C][C]-1.8291[/C][C]0.035259[/C][/ROW]
[ROW][C]6[/C][C]-0.042536[/C][C]-0.4146[/C][C]0.339688[/C][/ROW]
[ROW][C]7[/C][C]-0.078972[/C][C]-0.7697[/C][C]0.221687[/C][/ROW]
[ROW][C]8[/C][C]-0.148172[/C][C]-1.4442[/C][C]0.075987[/C][/ROW]
[ROW][C]9[/C][C]0.043927[/C][C]0.4281[/C][C]0.334757[/C][/ROW]
[ROW][C]10[/C][C]-0.053094[/C][C]-0.5175[/C][C]0.303006[/C][/ROW]
[ROW][C]11[/C][C]-0.153164[/C][C]-1.4929[/C][C]0.069394[/C][/ROW]
[ROW][C]12[/C][C]0.032747[/C][C]0.3192[/C][C]0.375147[/C][/ROW]
[ROW][C]13[/C][C]0.054331[/C][C]0.5296[/C][C]0.298829[/C][/ROW]
[ROW][C]14[/C][C]0.019688[/C][C]0.1919[/C][C]0.424117[/C][/ROW]
[ROW][C]15[/C][C]0.111653[/C][C]1.0883[/C][C]0.139617[/C][/ROW]
[ROW][C]16[/C][C]0.21526[/C][C]2.0981[/C][C]0.019275[/C][/ROW]
[ROW][C]17[/C][C]0.083373[/C][C]0.8126[/C][C]0.209233[/C][/ROW]
[ROW][C]18[/C][C]-0.004054[/C][C]-0.0395[/C][C]0.484282[/C][/ROW]
[ROW][C]19[/C][C]0.068568[/C][C]0.6683[/C][C]0.252776[/C][/ROW]
[ROW][C]20[/C][C]0.054907[/C][C]0.5352[/C][C]0.296892[/C][/ROW]
[ROW][C]21[/C][C]-0.041478[/C][C]-0.4043[/C][C]0.343457[/C][/ROW]
[ROW][C]22[/C][C]-0.113277[/C][C]-1.1041[/C][C]0.136172[/C][/ROW]
[ROW][C]23[/C][C]0.036373[/C][C]0.3545[/C][C]0.361867[/C][/ROW]
[ROW][C]24[/C][C]0.000228[/C][C]0.0022[/C][C]0.499115[/C][/ROW]
[ROW][C]25[/C][C]-0.001038[/C][C]-0.0101[/C][C]0.495973[/C][/ROW]
[ROW][C]26[/C][C]-0.000818[/C][C]-0.008[/C][C]0.496826[/C][/ROW]
[ROW][C]27[/C][C]-0.089779[/C][C]-0.8751[/C][C]0.191876[/C][/ROW]
[ROW][C]28[/C][C]-0.083354[/C][C]-0.8124[/C][C]0.209286[/C][/ROW]
[ROW][C]29[/C][C]-0.068897[/C][C]-0.6715[/C][C]0.251758[/C][/ROW]
[ROW][C]30[/C][C]-0.010745[/C][C]-0.1047[/C][C]0.458405[/C][/ROW]
[ROW][C]31[/C][C]-0.043168[/C][C]-0.4207[/C][C]0.337444[/C][/ROW]
[ROW][C]32[/C][C]0.004234[/C][C]0.0413[/C][C]0.483584[/C][/ROW]
[ROW][C]33[/C][C]0.09072[/C][C]0.8842[/C][C]0.189403[/C][/ROW]
[ROW][C]34[/C][C]-0.017575[/C][C]-0.1713[/C][C]0.432176[/C][/ROW]
[ROW][C]35[/C][C]0.013638[/C][C]0.1329[/C][C]0.447267[/C][/ROW]
[ROW][C]36[/C][C]-0.0043[/C][C]-0.0419[/C][C]0.483329[/C][/ROW]
[ROW][C]37[/C][C]-0.068374[/C][C]-0.6664[/C][C]0.253377[/C][/ROW]
[ROW][C]38[/C][C]-0.089475[/C][C]-0.8721[/C][C]0.192677[/C][/ROW]
[ROW][C]39[/C][C]-0.037111[/C][C]-0.3617[/C][C]0.359184[/C][/ROW]
[ROW][C]40[/C][C]-0.09101[/C][C]-0.8871[/C][C]0.188645[/C][/ROW]
[ROW][C]41[/C][C]-0.080713[/C][C]-0.7867[/C][C]0.216711[/C][/ROW]
[ROW][C]42[/C][C]-0.045517[/C][C]-0.4436[/C][C]0.329154[/C][/ROW]
[ROW][C]43[/C][C]-0.096586[/C][C]-0.9414[/C][C]0.174442[/C][/ROW]
[ROW][C]44[/C][C]-0.085987[/C][C]-0.8381[/C][C]0.20204[/C][/ROW]
[ROW][C]45[/C][C]0.005185[/C][C]0.0505[/C][C]0.4799[/C][/ROW]
[ROW][C]46[/C][C]0.032272[/C][C]0.3146[/C][C]0.376896[/C][/ROW]
[ROW][C]47[/C][C]-0.038246[/C][C]-0.3728[/C][C]0.355074[/C][/ROW]
[ROW][C]48[/C][C]0.091835[/C][C]0.8951[/C][C]0.186499[/C][/ROW]
[/TABLE]
Source: https://freestatistics.org/blog/index.php?pk=32117&T=1

Globally Unique Identifier (entire table): ba.freestatistics.org/blog/index.php?pk=32117&T=1

As an alternative you can also use a QR Code:  

The GUIDs for individual cells are displayed in the table below:

Autocorrelation Function
Time lag kACF(k)T-STATP-value
10.3347663.26290.000766
20.1206641.17610.12125
30.27672.69690.00414
40.0279920.27280.392787
5-0.187664-1.82910.035259
6-0.042536-0.41460.339688
7-0.078972-0.76970.221687
8-0.148172-1.44420.075987
90.0439270.42810.334757
10-0.053094-0.51750.303006
11-0.153164-1.49290.069394
120.0327470.31920.375147
130.0543310.52960.298829
140.0196880.19190.424117
150.1116531.08830.139617
160.215262.09810.019275
170.0833730.81260.209233
18-0.004054-0.03950.484282
190.0685680.66830.252776
200.0549070.53520.296892
21-0.041478-0.40430.343457
22-0.113277-1.10410.136172
230.0363730.35450.361867
240.0002280.00220.499115
25-0.001038-0.01010.495973
26-0.000818-0.0080.496826
27-0.089779-0.87510.191876
28-0.083354-0.81240.209286
29-0.068897-0.67150.251758
30-0.010745-0.10470.458405
31-0.043168-0.42070.337444
320.0042340.04130.483584
330.090720.88420.189403
34-0.017575-0.17130.432176
350.0136380.13290.447267
36-0.0043-0.04190.483329
37-0.068374-0.66640.253377
38-0.089475-0.87210.192677
39-0.037111-0.36170.359184
40-0.09101-0.88710.188645
41-0.080713-0.78670.216711
42-0.045517-0.44360.329154
43-0.096586-0.94140.174442
44-0.085987-0.83810.20204
450.0051850.05050.4799
460.0322720.31460.376896
47-0.038246-0.37280.355074
480.0918350.89510.186499


Partial Autocorrelation Function
Time lag kPACF(k)T-STATP-value
10.3347663.26290.000766
20.009680.09440.462514
30.2629462.56290.005976
4-0.171468-1.67130.04898
5-0.192166-1.8730.032071
60.019560.19060.424606
7-0.042605-0.41530.339444
80.0003240.00320.498745
90.1163481.1340.12982
10-0.147245-1.43520.077262
11-0.087511-0.8530.197916
120.0586010.57120.284616
130.0559270.54510.293477
140.1144541.11560.133712
150.0213430.2080.417828
160.1151491.12230.132274
17-0.044288-0.43170.333482
18-0.115342-1.12420.131876
190.0613260.59770.27572
200.1095211.06750.144231
21-0.011762-0.11460.454487
22-0.156557-1.52590.065175
230.1018610.99280.161659
240.0106520.10380.458765
250.0866220.84430.200314
26-0.055681-0.54270.2943
27-0.114106-1.11220.134435
28-0.06595-0.64280.260952
29-0.084167-0.82040.207032
300.1628721.58750.057864
310.0178530.1740.431113
32-0.079042-0.77040.221486
330.0201880.19680.422214
34-0.099196-0.96680.168039
350.0665280.64840.259136
36-0.044803-0.43670.331665
37-0.025623-0.24970.401662
38-0.023709-0.23110.40887
39-0.115652-1.12720.13124
40-0.087963-0.85740.196704
410.0876440.85420.197559
42-0.012401-0.12090.452025
43-0.020826-0.2030.41979
44-0.10289-1.00280.159242
450.0364850.35560.361462
460.086330.84140.201106
47-0.048003-0.46790.320471
480.1380091.34510.09089

\begin{tabular}{lllllllll}
\hline
Partial Autocorrelation Function \tabularnewline
Time lag k & PACF(k) & T-STAT & P-value \tabularnewline
1 & 0.334766 & 3.2629 & 0.000766 \tabularnewline
2 & 0.00968 & 0.0944 & 0.462514 \tabularnewline
3 & 0.262946 & 2.5629 & 0.005976 \tabularnewline
4 & -0.171468 & -1.6713 & 0.04898 \tabularnewline
5 & -0.192166 & -1.873 & 0.032071 \tabularnewline
6 & 0.01956 & 0.1906 & 0.424606 \tabularnewline
7 & -0.042605 & -0.4153 & 0.339444 \tabularnewline
8 & 0.000324 & 0.0032 & 0.498745 \tabularnewline
9 & 0.116348 & 1.134 & 0.12982 \tabularnewline
10 & -0.147245 & -1.4352 & 0.077262 \tabularnewline
11 & -0.087511 & -0.853 & 0.197916 \tabularnewline
12 & 0.058601 & 0.5712 & 0.284616 \tabularnewline
13 & 0.055927 & 0.5451 & 0.293477 \tabularnewline
14 & 0.114454 & 1.1156 & 0.133712 \tabularnewline
15 & 0.021343 & 0.208 & 0.417828 \tabularnewline
16 & 0.115149 & 1.1223 & 0.132274 \tabularnewline
17 & -0.044288 & -0.4317 & 0.333482 \tabularnewline
18 & -0.115342 & -1.1242 & 0.131876 \tabularnewline
19 & 0.061326 & 0.5977 & 0.27572 \tabularnewline
20 & 0.109521 & 1.0675 & 0.144231 \tabularnewline
21 & -0.011762 & -0.1146 & 0.454487 \tabularnewline
22 & -0.156557 & -1.5259 & 0.065175 \tabularnewline
23 & 0.101861 & 0.9928 & 0.161659 \tabularnewline
24 & 0.010652 & 0.1038 & 0.458765 \tabularnewline
25 & 0.086622 & 0.8443 & 0.200314 \tabularnewline
26 & -0.055681 & -0.5427 & 0.2943 \tabularnewline
27 & -0.114106 & -1.1122 & 0.134435 \tabularnewline
28 & -0.06595 & -0.6428 & 0.260952 \tabularnewline
29 & -0.084167 & -0.8204 & 0.207032 \tabularnewline
30 & 0.162872 & 1.5875 & 0.057864 \tabularnewline
31 & 0.017853 & 0.174 & 0.431113 \tabularnewline
32 & -0.079042 & -0.7704 & 0.221486 \tabularnewline
33 & 0.020188 & 0.1968 & 0.422214 \tabularnewline
34 & -0.099196 & -0.9668 & 0.168039 \tabularnewline
35 & 0.066528 & 0.6484 & 0.259136 \tabularnewline
36 & -0.044803 & -0.4367 & 0.331665 \tabularnewline
37 & -0.025623 & -0.2497 & 0.401662 \tabularnewline
38 & -0.023709 & -0.2311 & 0.40887 \tabularnewline
39 & -0.115652 & -1.1272 & 0.13124 \tabularnewline
40 & -0.087963 & -0.8574 & 0.196704 \tabularnewline
41 & 0.087644 & 0.8542 & 0.197559 \tabularnewline
42 & -0.012401 & -0.1209 & 0.452025 \tabularnewline
43 & -0.020826 & -0.203 & 0.41979 \tabularnewline
44 & -0.10289 & -1.0028 & 0.159242 \tabularnewline
45 & 0.036485 & 0.3556 & 0.361462 \tabularnewline
46 & 0.08633 & 0.8414 & 0.201106 \tabularnewline
47 & -0.048003 & -0.4679 & 0.320471 \tabularnewline
48 & 0.138009 & 1.3451 & 0.09089 \tabularnewline
\hline
\end{tabular}
%Source: https://freestatistics.org/blog/index.php?pk=32117&T=2

[TABLE]
[ROW][C]Partial Autocorrelation Function[/C][/ROW]
[ROW][C]Time lag k[/C][C]PACF(k)[/C][C]T-STAT[/C][C]P-value[/C][/ROW]
[ROW][C]1[/C][C]0.334766[/C][C]3.2629[/C][C]0.000766[/C][/ROW]
[ROW][C]2[/C][C]0.00968[/C][C]0.0944[/C][C]0.462514[/C][/ROW]
[ROW][C]3[/C][C]0.262946[/C][C]2.5629[/C][C]0.005976[/C][/ROW]
[ROW][C]4[/C][C]-0.171468[/C][C]-1.6713[/C][C]0.04898[/C][/ROW]
[ROW][C]5[/C][C]-0.192166[/C][C]-1.873[/C][C]0.032071[/C][/ROW]
[ROW][C]6[/C][C]0.01956[/C][C]0.1906[/C][C]0.424606[/C][/ROW]
[ROW][C]7[/C][C]-0.042605[/C][C]-0.4153[/C][C]0.339444[/C][/ROW]
[ROW][C]8[/C][C]0.000324[/C][C]0.0032[/C][C]0.498745[/C][/ROW]
[ROW][C]9[/C][C]0.116348[/C][C]1.134[/C][C]0.12982[/C][/ROW]
[ROW][C]10[/C][C]-0.147245[/C][C]-1.4352[/C][C]0.077262[/C][/ROW]
[ROW][C]11[/C][C]-0.087511[/C][C]-0.853[/C][C]0.197916[/C][/ROW]
[ROW][C]12[/C][C]0.058601[/C][C]0.5712[/C][C]0.284616[/C][/ROW]
[ROW][C]13[/C][C]0.055927[/C][C]0.5451[/C][C]0.293477[/C][/ROW]
[ROW][C]14[/C][C]0.114454[/C][C]1.1156[/C][C]0.133712[/C][/ROW]
[ROW][C]15[/C][C]0.021343[/C][C]0.208[/C][C]0.417828[/C][/ROW]
[ROW][C]16[/C][C]0.115149[/C][C]1.1223[/C][C]0.132274[/C][/ROW]
[ROW][C]17[/C][C]-0.044288[/C][C]-0.4317[/C][C]0.333482[/C][/ROW]
[ROW][C]18[/C][C]-0.115342[/C][C]-1.1242[/C][C]0.131876[/C][/ROW]
[ROW][C]19[/C][C]0.061326[/C][C]0.5977[/C][C]0.27572[/C][/ROW]
[ROW][C]20[/C][C]0.109521[/C][C]1.0675[/C][C]0.144231[/C][/ROW]
[ROW][C]21[/C][C]-0.011762[/C][C]-0.1146[/C][C]0.454487[/C][/ROW]
[ROW][C]22[/C][C]-0.156557[/C][C]-1.5259[/C][C]0.065175[/C][/ROW]
[ROW][C]23[/C][C]0.101861[/C][C]0.9928[/C][C]0.161659[/C][/ROW]
[ROW][C]24[/C][C]0.010652[/C][C]0.1038[/C][C]0.458765[/C][/ROW]
[ROW][C]25[/C][C]0.086622[/C][C]0.8443[/C][C]0.200314[/C][/ROW]
[ROW][C]26[/C][C]-0.055681[/C][C]-0.5427[/C][C]0.2943[/C][/ROW]
[ROW][C]27[/C][C]-0.114106[/C][C]-1.1122[/C][C]0.134435[/C][/ROW]
[ROW][C]28[/C][C]-0.06595[/C][C]-0.6428[/C][C]0.260952[/C][/ROW]
[ROW][C]29[/C][C]-0.084167[/C][C]-0.8204[/C][C]0.207032[/C][/ROW]
[ROW][C]30[/C][C]0.162872[/C][C]1.5875[/C][C]0.057864[/C][/ROW]
[ROW][C]31[/C][C]0.017853[/C][C]0.174[/C][C]0.431113[/C][/ROW]
[ROW][C]32[/C][C]-0.079042[/C][C]-0.7704[/C][C]0.221486[/C][/ROW]
[ROW][C]33[/C][C]0.020188[/C][C]0.1968[/C][C]0.422214[/C][/ROW]
[ROW][C]34[/C][C]-0.099196[/C][C]-0.9668[/C][C]0.168039[/C][/ROW]
[ROW][C]35[/C][C]0.066528[/C][C]0.6484[/C][C]0.259136[/C][/ROW]
[ROW][C]36[/C][C]-0.044803[/C][C]-0.4367[/C][C]0.331665[/C][/ROW]
[ROW][C]37[/C][C]-0.025623[/C][C]-0.2497[/C][C]0.401662[/C][/ROW]
[ROW][C]38[/C][C]-0.023709[/C][C]-0.2311[/C][C]0.40887[/C][/ROW]
[ROW][C]39[/C][C]-0.115652[/C][C]-1.1272[/C][C]0.13124[/C][/ROW]
[ROW][C]40[/C][C]-0.087963[/C][C]-0.8574[/C][C]0.196704[/C][/ROW]
[ROW][C]41[/C][C]0.087644[/C][C]0.8542[/C][C]0.197559[/C][/ROW]
[ROW][C]42[/C][C]-0.012401[/C][C]-0.1209[/C][C]0.452025[/C][/ROW]
[ROW][C]43[/C][C]-0.020826[/C][C]-0.203[/C][C]0.41979[/C][/ROW]
[ROW][C]44[/C][C]-0.10289[/C][C]-1.0028[/C][C]0.159242[/C][/ROW]
[ROW][C]45[/C][C]0.036485[/C][C]0.3556[/C][C]0.361462[/C][/ROW]
[ROW][C]46[/C][C]0.08633[/C][C]0.8414[/C][C]0.201106[/C][/ROW]
[ROW][C]47[/C][C]-0.048003[/C][C]-0.4679[/C][C]0.320471[/C][/ROW]
[ROW][C]48[/C][C]0.138009[/C][C]1.3451[/C][C]0.09089[/C][/ROW]
[/TABLE]
Source: https://freestatistics.org/blog/index.php?pk=32117&T=2

Globally Unique Identifier (entire table): ba.freestatistics.org/blog/index.php?pk=32117&T=2

As an alternative you can also use a QR Code:  

The GUIDs for individual cells are displayed in the table below:

Partial Autocorrelation Function
Time lag kPACF(k)T-STATP-value
10.3347663.26290.000766
20.009680.09440.462514
30.2629462.56290.005976
4-0.171468-1.67130.04898
5-0.192166-1.8730.032071
60.019560.19060.424606
7-0.042605-0.41530.339444
80.0003240.00320.498745
90.1163481.1340.12982
10-0.147245-1.43520.077262
11-0.087511-0.8530.197916
120.0586010.57120.284616
130.0559270.54510.293477
140.1144541.11560.133712
150.0213430.2080.417828
160.1151491.12230.132274
17-0.044288-0.43170.333482
18-0.115342-1.12420.131876
190.0613260.59770.27572
200.1095211.06750.144231
21-0.011762-0.11460.454487
22-0.156557-1.52590.065175
230.1018610.99280.161659
240.0106520.10380.458765
250.0866220.84430.200314
26-0.055681-0.54270.2943
27-0.114106-1.11220.134435
28-0.06595-0.64280.260952
29-0.084167-0.82040.207032
300.1628721.58750.057864
310.0178530.1740.431113
32-0.079042-0.77040.221486
330.0201880.19680.422214
34-0.099196-0.96680.168039
350.0665280.64840.259136
36-0.044803-0.43670.331665
37-0.025623-0.24970.401662
38-0.023709-0.23110.40887
39-0.115652-1.12720.13124
40-0.087963-0.85740.196704
410.0876440.85420.197559
42-0.012401-0.12090.452025
43-0.020826-0.2030.41979
44-0.10289-1.00280.159242
450.0364850.35560.361462
460.086330.84140.201106
47-0.048003-0.46790.320471
480.1380091.34510.09089


Parameters (Session):
par1 = 48 ; par2 = 1 ; par3 = 0 ; par4 = 0 ; par5 = 12 ;
Parameters (R input):
par1 = 48 ; par2 = 1 ; par3 = 1 ; par4 = 0 ; par5 = 12 ;
R code (references can be found in the software module):
if (par1 == 'Default') {
par1 = 10*log10(length(x))
} else {
par1 <- as.numeric(par1)
}
par2 <- as.numeric(par2)
par3 <- as.numeric(par3)
par4 <- as.numeric(par4)
par5 <- as.numeric(par5)
if (par2 == 0) {
x <- log(x)
} else {
x <- (x ^ par2 - 1) / par2
}
if (par3 > 0) x <- diff(x,lag=1,difference=par3)
if (par4 > 0) x <- diff(x,lag=par5,difference=par4)
bitmap(file='pic1.png')
racf <- acf(x,par1,main='Autocorrelation',xlab='lags',ylab='ACF')
dev.off()
bitmap(file='pic2.png')
rpacf <- pacf(x,par1,main='Partial Autocorrelation',xlab='lags',ylab='PACF')
dev.off()
(myacf <- c(racf$acf))
(mypacf <- c(rpacf$acf))
lengthx <- length(x)
sqrtn <- sqrt(lengthx)
load(file='createtable')
a<-table.start()
a<-table.row.start(a)
a<-table.element(a,'Autocorrelation Function',4,TRUE)
a<-table.row.end(a)
a<-table.row.start(a)
a<-table.element(a,'Time lag k',header=TRUE)
a<-table.element(a,hyperlink('basics.htm','ACF(k)','click here for more information about the Autocorrelation Function'),header=TRUE)
a<-table.element(a,'T-STAT',header=TRUE)
a<-table.element(a,'P-value',header=TRUE)
a<-table.row.end(a)
for (i in 2:(par1+1)) {
a<-table.row.start(a)
a<-table.element(a,i-1,header=TRUE)
a<-table.element(a,round(myacf[i],6))
mytstat <- myacf[i]*sqrtn
a<-table.element(a,round(mytstat,4))
a<-table.element(a,round(1-pt(abs(mytstat),lengthx),6))
a<-table.row.end(a)
}
a<-table.end(a)
table.save(a,file='mytable.tab')
a<-table.start()
a<-table.row.start(a)
a<-table.element(a,'Partial Autocorrelation Function',4,TRUE)
a<-table.row.end(a)
a<-table.row.start(a)
a<-table.element(a,'Time lag k',header=TRUE)
a<-table.element(a,hyperlink('basics.htm','PACF(k)','click here for more information about the Partial Autocorrelation Function'),header=TRUE)
a<-table.element(a,'T-STAT',header=TRUE)
a<-table.element(a,'P-value',header=TRUE)
a<-table.row.end(a)
for (i in 1:par1) {
a<-table.row.start(a)
a<-table.element(a,i,header=TRUE)
a<-table.element(a,round(mypacf[i],6))
mytstat <- mypacf[i]*sqrtn
a<-table.element(a,round(mytstat,4))
a<-table.element(a,round(1-pt(abs(mytstat),lengthx),6))
a<-table.row.end(a)
}
a<-table.end(a)
table.save(a,file='mytable1.tab')