Free Statistics
of Irreproducible Research!
Description of Statistical Computation | |||||||||||||||||||||||||||||||||||||||||||||||||||||||||||||||||||||||||||||||||||||||||||||||||||||||||||||||||||||||||||||||||||||||||||||||||||||||||||||||||||||||||||||||||||||
|---|---|---|---|---|---|---|---|---|---|---|---|---|---|---|---|---|---|---|---|---|---|---|---|---|---|---|---|---|---|---|---|---|---|---|---|---|---|---|---|---|---|---|---|---|---|---|---|---|---|---|---|---|---|---|---|---|---|---|---|---|---|---|---|---|---|---|---|---|---|---|---|---|---|---|---|---|---|---|---|---|---|---|---|---|---|---|---|---|---|---|---|---|---|---|---|---|---|---|---|---|---|---|---|---|---|---|---|---|---|---|---|---|---|---|---|---|---|---|---|---|---|---|---|---|---|---|---|---|---|---|---|---|---|---|---|---|---|---|---|---|---|---|---|---|---|---|---|---|---|---|---|---|---|---|---|---|---|---|---|---|---|---|---|---|---|---|---|---|---|---|---|---|---|---|---|---|---|---|---|---|---|
| Author's title | |||||||||||||||||||||||||||||||||||||||||||||||||||||||||||||||||||||||||||||||||||||||||||||||||||||||||||||||||||||||||||||||||||||||||||||||||||||||||||||||||||||||||||||||||||||
| Author | *The author of this computation has been verified* | ||||||||||||||||||||||||||||||||||||||||||||||||||||||||||||||||||||||||||||||||||||||||||||||||||||||||||||||||||||||||||||||||||||||||||||||||||||||||||||||||||||||||||||||||||||
| R Software Module | rwasp_notchedbox1.wasp | ||||||||||||||||||||||||||||||||||||||||||||||||||||||||||||||||||||||||||||||||||||||||||||||||||||||||||||||||||||||||||||||||||||||||||||||||||||||||||||||||||||||||||||||||||||
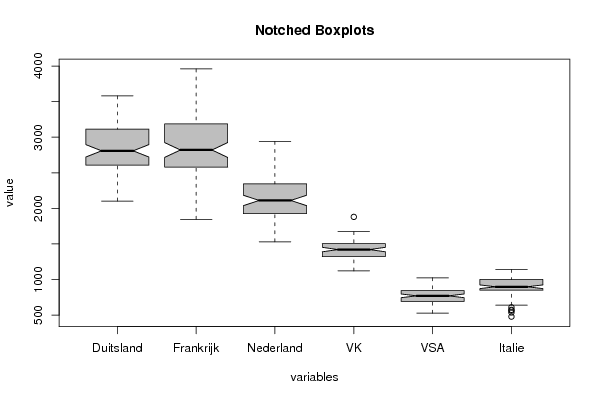
| Title produced by software | Notched Boxplots | ||||||||||||||||||||||||||||||||||||||||||||||||||||||||||||||||||||||||||||||||||||||||||||||||||||||||||||||||||||||||||||||||||||||||||||||||||||||||||||||||||||||||||||||||||||
| Date of computation | Wed, 10 Dec 2008 12:35:55 -0700 | ||||||||||||||||||||||||||||||||||||||||||||||||||||||||||||||||||||||||||||||||||||||||||||||||||||||||||||||||||||||||||||||||||||||||||||||||||||||||||||||||||||||||||||||||||||
| Cite this page as follows | Statistical Computations at FreeStatistics.org, Office for Research Development and Education, URL https://freestatistics.org/blog/index.php?v=date/2008/Dec/10/t12289380206qpiosrg5uqhnpi.htm/, Retrieved Sun, 19 May 2024 07:55:48 +0000 | ||||||||||||||||||||||||||||||||||||||||||||||||||||||||||||||||||||||||||||||||||||||||||||||||||||||||||||||||||||||||||||||||||||||||||||||||||||||||||||||||||||||||||||||||||||
| Statistical Computations at FreeStatistics.org, Office for Research Development and Education, URL https://freestatistics.org/blog/index.php?pk=32082, Retrieved Sun, 19 May 2024 07:55:48 +0000 | |||||||||||||||||||||||||||||||||||||||||||||||||||||||||||||||||||||||||||||||||||||||||||||||||||||||||||||||||||||||||||||||||||||||||||||||||||||||||||||||||||||||||||||||||||||
| QR Codes: | |||||||||||||||||||||||||||||||||||||||||||||||||||||||||||||||||||||||||||||||||||||||||||||||||||||||||||||||||||||||||||||||||||||||||||||||||||||||||||||||||||||||||||||||||||||
|
| |||||||||||||||||||||||||||||||||||||||||||||||||||||||||||||||||||||||||||||||||||||||||||||||||||||||||||||||||||||||||||||||||||||||||||||||||||||||||||||||||||||||||||||||||||||
| Original text written by user: | |||||||||||||||||||||||||||||||||||||||||||||||||||||||||||||||||||||||||||||||||||||||||||||||||||||||||||||||||||||||||||||||||||||||||||||||||||||||||||||||||||||||||||||||||||||
| IsPrivate? | No (this computation is public) | ||||||||||||||||||||||||||||||||||||||||||||||||||||||||||||||||||||||||||||||||||||||||||||||||||||||||||||||||||||||||||||||||||||||||||||||||||||||||||||||||||||||||||||||||||||
| User-defined keywords | |||||||||||||||||||||||||||||||||||||||||||||||||||||||||||||||||||||||||||||||||||||||||||||||||||||||||||||||||||||||||||||||||||||||||||||||||||||||||||||||||||||||||||||||||||||
| Estimated Impact | 154 | ||||||||||||||||||||||||||||||||||||||||||||||||||||||||||||||||||||||||||||||||||||||||||||||||||||||||||||||||||||||||||||||||||||||||||||||||||||||||||||||||||||||||||||||||||||
Tree of Dependent Computations | |||||||||||||||||||||||||||||||||||||||||||||||||||||||||||||||||||||||||||||||||||||||||||||||||||||||||||||||||||||||||||||||||||||||||||||||||||||||||||||||||||||||||||||||||||||
| Family? (F = Feedback message, R = changed R code, M = changed R Module, P = changed Parameters, D = changed Data) | |||||||||||||||||||||||||||||||||||||||||||||||||||||||||||||||||||||||||||||||||||||||||||||||||||||||||||||||||||||||||||||||||||||||||||||||||||||||||||||||||||||||||||||||||||||
| - [Notched Boxplots] [notched boxplots] [2008-12-10 19:35:55] [a9e6d7cd6e144e8b311d9f96a24c5a25] [Current] | |||||||||||||||||||||||||||||||||||||||||||||||||||||||||||||||||||||||||||||||||||||||||||||||||||||||||||||||||||||||||||||||||||||||||||||||||||||||||||||||||||||||||||||||||||||
| Feedback Forum | |||||||||||||||||||||||||||||||||||||||||||||||||||||||||||||||||||||||||||||||||||||||||||||||||||||||||||||||||||||||||||||||||||||||||||||||||||||||||||||||||||||||||||||||||||||
Post a new message | |||||||||||||||||||||||||||||||||||||||||||||||||||||||||||||||||||||||||||||||||||||||||||||||||||||||||||||||||||||||||||||||||||||||||||||||||||||||||||||||||||||||||||||||||||||
Dataset | |||||||||||||||||||||||||||||||||||||||||||||||||||||||||||||||||||||||||||||||||||||||||||||||||||||||||||||||||||||||||||||||||||||||||||||||||||||||||||||||||||||||||||||||||||||
| Dataseries X: | |||||||||||||||||||||||||||||||||||||||||||||||||||||||||||||||||||||||||||||||||||||||||||||||||||||||||||||||||||||||||||||||||||||||||||||||||||||||||||||||||||||||||||||||||||||
2648.9 2678.9 1924.8 1404.1 774.7 875.9 2669.6 2582 1787 1334 910.6 885.4 3042.3 2780 2092.2 1516.2 911.6 1003.4 2604.2 2512.4 1829 1209.8 697.7 813.2 2732.1 2658.4 1940.9 1432.2 829.8 876.2 2621.7 2708.7 2065.5 1425.5 824.3 859.8 2483.7 2518.7 1638.1 1317.6 885.6 820.4 2479.3 2018.3 1724 1254 538.9 564.8 2684.6 2579.3 1913.3 1413.9 686 895.1 2834.7 2693.5 2072 1436.4 878.7 960.5 2566.1 2468.8 1921.4 1340.3 812.7 889.8 2251.2 2122.8 1699.1 1121.2 640.4 712.4 2350 2412.8 1839.7 1406.6 773.9 885.8 2299.8 2370.6 1765.5 1478.5 795.9 855.7 2542.8 2642.5 2057.5 1658 836.3 980.8 2530.2 2634.2 2027.2 1434.3 876.1 899.8 2508.1 2457.5 1999.7 1437.8 851.7 915.2 2616.8 2579.1 1959.1 1364.3 692.4 842.7 2534.1 2505.9 1738 1439.3 877.3 827.4 2181.8 1903.2 1688.6 1312.6 536.8 536.5 2578.9 2660.2 2021.5 1564.1 705.9 915.3 2841.9 2844.1 2166.7 1581.1 951 968.1 2529.9 2607.1 1821.5 1411.2 755.7 878.2 2103.2 2356 1788.2 1143.9 695.5 780.9 2326.2 2659.9 1981.9 1332.7 744.8 862.6 2452.6 2531.4 1864.5 1343.8 672.1 869.3 2782.1 2845.7 2130.4 1421.6 666.6 940.2 2727.3 2654.3 1950 1329.8 760.8 853.1 2648.2 2588.2 1925.3 1306.8 756 871.5 2760.7 2789.6 1933.6 1412.8 604.4 901.6 2613 2533.1 1714.8 1358.1 883.9 826.4 2225.4 1846.5 1530.9 1163.9 527.9 478.7 2713.9 2796.3 2220.6 1467.9 756.2 908.5 2923.3 2895.6 2161.5 1433.7 812.9 943.1 2707 2472.2 1863.6 1362.2 655.6 880.6 2473.9 2584.4 1955.1 1299 707.6 743.4 2521 2630.4 1907.4 1291.5 612.6 807.9 2531.8 2663.1 1889.4 1452.7 659.2 875.8 3068.8 3176.2 2246.3 1555.4 833.4 1044.3 2826.9 2856.7 2213 1402.5 727.8 909.2 2674.2 2551.4 1965 1242.9 797.2 890.3 2966.6 3088.7 2285.6 1514.6 753 1050.7 2798.8 2628.3 1983.8 1308.6 762 849.5 2629.6 2226.2 1872.4 1239.3 613.7 574.7 3124.6 3023.6 2371.4 1519.9 759.2 1025.5 3115.7 3077.9 2287 1659.4 816.4 992.1 3083 3084.1 2198.2 1597.6 736.8 961.9 2863.9 2990.3 2330.4 1340.6 680.1 862.9 2728.7 2949.6 2014.4 1427.2 736.5 891.2 2789.4 3014.7 2066.1 1438.1 637.2 974.2 3225.7 3517.7 2355.8 1616.2 801.9 1072.1 3148.2 3121.2 2232.5 1392.8 772.3 945.1 2836.5 3067.4 2091.7 1318.7 897.3 933.1 3153.5 3174.6 2376.5 1420.9 792.1 975.9 2656.9 2676.3 1931.9 1221 826.8 842.5 2834.7 2424 2025.7 1310 666.8 609.8 3172.5 3195.1 2404.9 1466.7 906.6 1064.2 2998.8 3146.6 2316.1 1299.3 871.4 984 3103.1 3506.7 2368.1 1640 891 1034.1 2735.6 3528.5 2282.5 1506.3 739.2 828.5 2818.1 3365.1 2158.6 1530.2 833.6 873.8 2874.4 3153 2174.8 1661.9 715.6 931.8 3438.5 3843.3 2594.1 1880.3 871.6 1070.5 2949.1 3123.2 2281.4 1230.8 751.6 880.7 3306.8 3361.1 2547.9 1406.5 1005.5 1002.5 3530 3481.9 2606.3 1523.5 681.2 1053.2 3003.8 2970.5 2190.8 1323.2 837.3 897.7 3206.4 2537 2262.3 1319.2 674.7 639.1 3514.6 3257.6 2423.8 1500.7 806.3 1073.3 3522.6 3301.3 2520.4 1483 860.2 1127.3 3525.5 3391.6 2482.9 1497 689.8 1100.3 2996.2 2933.6 2215.9 1219.8 691.6 827.6 3231.1 3283.2 2441.9 1472.9 682.6 1004.9 3030 3139.7 2333.8 1423.9 800.1 1035.5 3541.7 3486.4 2670.2 1629.6 1023.7 1131.5 3113.2 3202.2 2431 1353.4 733.5 1002.1 3390.8 3294.4 2559.3 1366.8 875.3 1068.9 3424.2 3550.3 2661.4 1527.1 770.2 1102.7 3079.8 3279.3 2404.6 1487.6 1005.7 961.7 3123.4 2678.6 2378.3 1478.6 982.3 645.4 3317.1 3451.4 2489.2 1536.7 742.9 1015.6 3579.9 3958.7 2941 1673.2 977.6 1139.6 3317.9 3800 2700.9 1568.1 823.9 1055.6 2668.1 3300.5 2335.6 1273.6 791.6 788.8 | |||||||||||||||||||||||||||||||||||||||||||||||||||||||||||||||||||||||||||||||||||||||||||||||||||||||||||||||||||||||||||||||||||||||||||||||||||||||||||||||||||||||||||||||||||||
Tables (Output of Computation) | |||||||||||||||||||||||||||||||||||||||||||||||||||||||||||||||||||||||||||||||||||||||||||||||||||||||||||||||||||||||||||||||||||||||||||||||||||||||||||||||||||||||||||||||||||||
| |||||||||||||||||||||||||||||||||||||||||||||||||||||||||||||||||||||||||||||||||||||||||||||||||||||||||||||||||||||||||||||||||||||||||||||||||||||||||||||||||||||||||||||||||||||
Figures (Output of Computation) | |||||||||||||||||||||||||||||||||||||||||||||||||||||||||||||||||||||||||||||||||||||||||||||||||||||||||||||||||||||||||||||||||||||||||||||||||||||||||||||||||||||||||||||||||||||
Input Parameters & R Code | |||||||||||||||||||||||||||||||||||||||||||||||||||||||||||||||||||||||||||||||||||||||||||||||||||||||||||||||||||||||||||||||||||||||||||||||||||||||||||||||||||||||||||||||||||||
| Parameters (Session): | |||||||||||||||||||||||||||||||||||||||||||||||||||||||||||||||||||||||||||||||||||||||||||||||||||||||||||||||||||||||||||||||||||||||||||||||||||||||||||||||||||||||||||||||||||||
| par1 = grey ; | |||||||||||||||||||||||||||||||||||||||||||||||||||||||||||||||||||||||||||||||||||||||||||||||||||||||||||||||||||||||||||||||||||||||||||||||||||||||||||||||||||||||||||||||||||||
| Parameters (R input): | |||||||||||||||||||||||||||||||||||||||||||||||||||||||||||||||||||||||||||||||||||||||||||||||||||||||||||||||||||||||||||||||||||||||||||||||||||||||||||||||||||||||||||||||||||||
| par1 = grey ; | |||||||||||||||||||||||||||||||||||||||||||||||||||||||||||||||||||||||||||||||||||||||||||||||||||||||||||||||||||||||||||||||||||||||||||||||||||||||||||||||||||||||||||||||||||||
| R code (references can be found in the software module): | |||||||||||||||||||||||||||||||||||||||||||||||||||||||||||||||||||||||||||||||||||||||||||||||||||||||||||||||||||||||||||||||||||||||||||||||||||||||||||||||||||||||||||||||||||||
z <- as.data.frame(t(y)) | |||||||||||||||||||||||||||||||||||||||||||||||||||||||||||||||||||||||||||||||||||||||||||||||||||||||||||||||||||||||||||||||||||||||||||||||||||||||||||||||||||||||||||||||||||||
