Free Statistics

of Irreproducible Research!

Author's title

Author*The author of this computation has been verified*
R Software Modulerwasp_autocorrelation.wasp
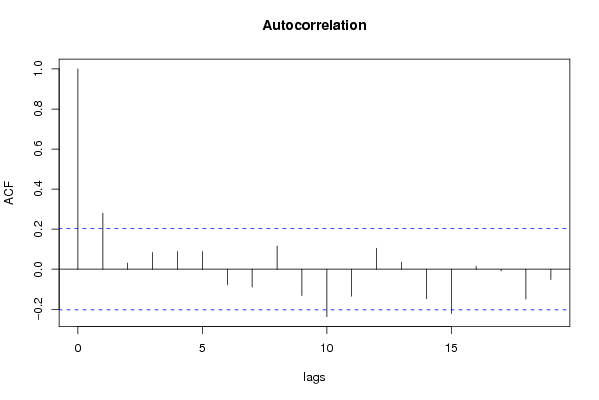
Title produced by software(Partial) Autocorrelation Function
Date of computationWed, 10 Dec 2008 10:27:36 -0700
Cite this page as followsStatistical Computations at FreeStatistics.org, Office for Research Development and Education, URL https://freestatistics.org/blog/index.php?v=date/2008/Dec/10/t1228930162rfcntljhinwk4c3.htm/, Retrieved Sun, 19 May 2024 07:08:14 +0000
Statistical Computations at FreeStatistics.org, Office for Research Development and Education, URL https://freestatistics.org/blog/index.php?pk=32042, Retrieved Sun, 19 May 2024 07:08:14 +0000
QR Codes:

Original text written by user:
IsPrivate?No (this computation is public)
User-defined keywords
Estimated Impact175
Family? (F = Feedback message, R = changed R code, M = changed R Module, P = changed Parameters, D = changed Data)
-       [(Partial) Autocorrelation Function] [(Partial) Autocor...] [2008-12-10 17:27:36] [6912578025c824de531bc660dd61b996] [Current]
Feedback Forum

Post a new message
Dataseries X:
101.8
103.4
104.9
105.1
105.6
104.5
105.5
105.1
106.9
106.6
106.6
106.5
109.7
109.5
109.2
109.1
109
109
109
109
109
109
109
109
109
109
109
109
109
109
109
109
109
109
109
109.2
113.3
112.3
112.3
116.3
118.3
119.4
119.4
119.4
120.1
121.7
123.7
123.7
128.5
127.1
122.6
119.8
122.7
123.4
123.8
121.8
121.2
121.2
121.2
121.2
129.6
131
131
129.8
129.8
134.9
131.2
127.1
130.5
130.5
131.7
131.7
131.7
131.7
128.7
125
124.5
123
122.8
123.1
124.8
126.9
131.7
136.8
143.7
150.1
152.7
152.6
150.5
154.9
158
158.1
160.6
160.6


Summary of computational transaction
Raw Inputview raw input (R code)
Raw Outputview raw output of R engine
Computing time2 seconds
R Server'Sir Ronald Aylmer Fisher' @ 193.190.124.24

\begin{tabular}{lllllllll}
\hline
Summary of computational transaction \tabularnewline
Raw Input & view raw input (R code)  \tabularnewline
Raw Output & view raw output of R engine  \tabularnewline
Computing time & 2 seconds \tabularnewline
R Server & 'Sir Ronald Aylmer Fisher' @ 193.190.124.24 \tabularnewline
\hline
\end{tabular}
%Source: https://freestatistics.org/blog/index.php?pk=32042&T=0

[TABLE]
[ROW][C]Summary of computational transaction[/C][/ROW]
[ROW][C]Raw Input[/C][C]view raw input (R code) [/C][/ROW]
[ROW][C]Raw Output[/C][C]view raw output of R engine [/C][/ROW]
[ROW][C]Computing time[/C][C]2 seconds[/C][/ROW]
[ROW][C]R Server[/C][C]'Sir Ronald Aylmer Fisher' @ 193.190.124.24[/C][/ROW]
[/TABLE]
Source: https://freestatistics.org/blog/index.php?pk=32042&T=0

Globally Unique Identifier (entire table): ba.freestatistics.org/blog/index.php?pk=32042&T=0

As an alternative you can also use a QR Code:  

The GUIDs for individual cells are displayed in the table below:

Summary of computational transaction
Raw Inputview raw input (R code)
Raw Outputview raw output of R engine
Computing time2 seconds
R Server'Sir Ronald Aylmer Fisher' @ 193.190.124.24


Autocorrelation Function
Time lag kACF(k)T-STATP-value
10.2795212.69560.00417
20.0305070.29420.384632
30.083510.80530.211339
40.0886690.85510.197349
50.0873260.84210.200934
6-0.077563-0.7480.228177
7-0.089376-0.86190.195476
80.115681.11560.133738
9-0.131478-1.26790.103994
10-0.236866-2.28430.012316
11-0.134665-1.29870.098635
120.1051051.01360.156702
130.0350940.33840.367899
14-0.147812-1.42540.078688
15-0.221008-2.13130.01785
160.0146080.14090.444137
17-0.007544-0.07280.471081
18-0.149337-1.44020.076591
19-0.051757-0.49910.309434

\begin{tabular}{lllllllll}
\hline
Autocorrelation Function \tabularnewline
Time lag k & ACF(k) & T-STAT & P-value \tabularnewline
1 & 0.279521 & 2.6956 & 0.00417 \tabularnewline
2 & 0.030507 & 0.2942 & 0.384632 \tabularnewline
3 & 0.08351 & 0.8053 & 0.211339 \tabularnewline
4 & 0.088669 & 0.8551 & 0.197349 \tabularnewline
5 & 0.087326 & 0.8421 & 0.200934 \tabularnewline
6 & -0.077563 & -0.748 & 0.228177 \tabularnewline
7 & -0.089376 & -0.8619 & 0.195476 \tabularnewline
8 & 0.11568 & 1.1156 & 0.133738 \tabularnewline
9 & -0.131478 & -1.2679 & 0.103994 \tabularnewline
10 & -0.236866 & -2.2843 & 0.012316 \tabularnewline
11 & -0.134665 & -1.2987 & 0.098635 \tabularnewline
12 & 0.105105 & 1.0136 & 0.156702 \tabularnewline
13 & 0.035094 & 0.3384 & 0.367899 \tabularnewline
14 & -0.147812 & -1.4254 & 0.078688 \tabularnewline
15 & -0.221008 & -2.1313 & 0.01785 \tabularnewline
16 & 0.014608 & 0.1409 & 0.444137 \tabularnewline
17 & -0.007544 & -0.0728 & 0.471081 \tabularnewline
18 & -0.149337 & -1.4402 & 0.076591 \tabularnewline
19 & -0.051757 & -0.4991 & 0.309434 \tabularnewline
\hline
\end{tabular}
%Source: https://freestatistics.org/blog/index.php?pk=32042&T=1

[TABLE]
[ROW][C]Autocorrelation Function[/C][/ROW]
[ROW][C]Time lag k[/C][C]ACF(k)[/C][C]T-STAT[/C][C]P-value[/C][/ROW]
[ROW][C]1[/C][C]0.279521[/C][C]2.6956[/C][C]0.00417[/C][/ROW]
[ROW][C]2[/C][C]0.030507[/C][C]0.2942[/C][C]0.384632[/C][/ROW]
[ROW][C]3[/C][C]0.08351[/C][C]0.8053[/C][C]0.211339[/C][/ROW]
[ROW][C]4[/C][C]0.088669[/C][C]0.8551[/C][C]0.197349[/C][/ROW]
[ROW][C]5[/C][C]0.087326[/C][C]0.8421[/C][C]0.200934[/C][/ROW]
[ROW][C]6[/C][C]-0.077563[/C][C]-0.748[/C][C]0.228177[/C][/ROW]
[ROW][C]7[/C][C]-0.089376[/C][C]-0.8619[/C][C]0.195476[/C][/ROW]
[ROW][C]8[/C][C]0.11568[/C][C]1.1156[/C][C]0.133738[/C][/ROW]
[ROW][C]9[/C][C]-0.131478[/C][C]-1.2679[/C][C]0.103994[/C][/ROW]
[ROW][C]10[/C][C]-0.236866[/C][C]-2.2843[/C][C]0.012316[/C][/ROW]
[ROW][C]11[/C][C]-0.134665[/C][C]-1.2987[/C][C]0.098635[/C][/ROW]
[ROW][C]12[/C][C]0.105105[/C][C]1.0136[/C][C]0.156702[/C][/ROW]
[ROW][C]13[/C][C]0.035094[/C][C]0.3384[/C][C]0.367899[/C][/ROW]
[ROW][C]14[/C][C]-0.147812[/C][C]-1.4254[/C][C]0.078688[/C][/ROW]
[ROW][C]15[/C][C]-0.221008[/C][C]-2.1313[/C][C]0.01785[/C][/ROW]
[ROW][C]16[/C][C]0.014608[/C][C]0.1409[/C][C]0.444137[/C][/ROW]
[ROW][C]17[/C][C]-0.007544[/C][C]-0.0728[/C][C]0.471081[/C][/ROW]
[ROW][C]18[/C][C]-0.149337[/C][C]-1.4402[/C][C]0.076591[/C][/ROW]
[ROW][C]19[/C][C]-0.051757[/C][C]-0.4991[/C][C]0.309434[/C][/ROW]
[/TABLE]
Source: https://freestatistics.org/blog/index.php?pk=32042&T=1

Globally Unique Identifier (entire table): ba.freestatistics.org/blog/index.php?pk=32042&T=1

As an alternative you can also use a QR Code:  

The GUIDs for individual cells are displayed in the table below:

Autocorrelation Function
Time lag kACF(k)T-STATP-value
10.2795212.69560.00417
20.0305070.29420.384632
30.083510.80530.211339
40.0886690.85510.197349
50.0873260.84210.200934
6-0.077563-0.7480.228177
7-0.089376-0.86190.195476
80.115681.11560.133738
9-0.131478-1.26790.103994
10-0.236866-2.28430.012316
11-0.134665-1.29870.098635
120.1051051.01360.156702
130.0350940.33840.367899
14-0.147812-1.42540.078688
15-0.221008-2.13130.01785
160.0146080.14090.444137
17-0.007544-0.07280.471081
18-0.149337-1.44020.076591
19-0.051757-0.49910.309434


Partial Autocorrelation Function
Time lag kPACF(k)T-STATP-value
10.2795212.69560.00417
2-0.051662-0.49820.309756
30.0967830.93330.176531
40.0429230.41390.339939
50.0583310.56250.287555
6-0.132811-1.28080.101728
7-0.039598-0.38190.351714
80.1493241.440.076609
9-0.233634-2.25310.013302
10-0.132018-1.27310.103071
11-0.030305-0.29230.385372
120.1946051.87670.031847
13-0.065983-0.63630.263067
14-0.096182-0.92750.178021
15-0.164597-1.58730.057917
160.0691650.6670.25321
17-0.039777-0.38360.351076
18-0.097517-0.94040.17472
190.045170.43560.332066

\begin{tabular}{lllllllll}
\hline
Partial Autocorrelation Function \tabularnewline
Time lag k & PACF(k) & T-STAT & P-value \tabularnewline
1 & 0.279521 & 2.6956 & 0.00417 \tabularnewline
2 & -0.051662 & -0.4982 & 0.309756 \tabularnewline
3 & 0.096783 & 0.9333 & 0.176531 \tabularnewline
4 & 0.042923 & 0.4139 & 0.339939 \tabularnewline
5 & 0.058331 & 0.5625 & 0.287555 \tabularnewline
6 & -0.132811 & -1.2808 & 0.101728 \tabularnewline
7 & -0.039598 & -0.3819 & 0.351714 \tabularnewline
8 & 0.149324 & 1.44 & 0.076609 \tabularnewline
9 & -0.233634 & -2.2531 & 0.013302 \tabularnewline
10 & -0.132018 & -1.2731 & 0.103071 \tabularnewline
11 & -0.030305 & -0.2923 & 0.385372 \tabularnewline
12 & 0.194605 & 1.8767 & 0.031847 \tabularnewline
13 & -0.065983 & -0.6363 & 0.263067 \tabularnewline
14 & -0.096182 & -0.9275 & 0.178021 \tabularnewline
15 & -0.164597 & -1.5873 & 0.057917 \tabularnewline
16 & 0.069165 & 0.667 & 0.25321 \tabularnewline
17 & -0.039777 & -0.3836 & 0.351076 \tabularnewline
18 & -0.097517 & -0.9404 & 0.17472 \tabularnewline
19 & 0.04517 & 0.4356 & 0.332066 \tabularnewline
\hline
\end{tabular}
%Source: https://freestatistics.org/blog/index.php?pk=32042&T=2

[TABLE]
[ROW][C]Partial Autocorrelation Function[/C][/ROW]
[ROW][C]Time lag k[/C][C]PACF(k)[/C][C]T-STAT[/C][C]P-value[/C][/ROW]
[ROW][C]1[/C][C]0.279521[/C][C]2.6956[/C][C]0.00417[/C][/ROW]
[ROW][C]2[/C][C]-0.051662[/C][C]-0.4982[/C][C]0.309756[/C][/ROW]
[ROW][C]3[/C][C]0.096783[/C][C]0.9333[/C][C]0.176531[/C][/ROW]
[ROW][C]4[/C][C]0.042923[/C][C]0.4139[/C][C]0.339939[/C][/ROW]
[ROW][C]5[/C][C]0.058331[/C][C]0.5625[/C][C]0.287555[/C][/ROW]
[ROW][C]6[/C][C]-0.132811[/C][C]-1.2808[/C][C]0.101728[/C][/ROW]
[ROW][C]7[/C][C]-0.039598[/C][C]-0.3819[/C][C]0.351714[/C][/ROW]
[ROW][C]8[/C][C]0.149324[/C][C]1.44[/C][C]0.076609[/C][/ROW]
[ROW][C]9[/C][C]-0.233634[/C][C]-2.2531[/C][C]0.013302[/C][/ROW]
[ROW][C]10[/C][C]-0.132018[/C][C]-1.2731[/C][C]0.103071[/C][/ROW]
[ROW][C]11[/C][C]-0.030305[/C][C]-0.2923[/C][C]0.385372[/C][/ROW]
[ROW][C]12[/C][C]0.194605[/C][C]1.8767[/C][C]0.031847[/C][/ROW]
[ROW][C]13[/C][C]-0.065983[/C][C]-0.6363[/C][C]0.263067[/C][/ROW]
[ROW][C]14[/C][C]-0.096182[/C][C]-0.9275[/C][C]0.178021[/C][/ROW]
[ROW][C]15[/C][C]-0.164597[/C][C]-1.5873[/C][C]0.057917[/C][/ROW]
[ROW][C]16[/C][C]0.069165[/C][C]0.667[/C][C]0.25321[/C][/ROW]
[ROW][C]17[/C][C]-0.039777[/C][C]-0.3836[/C][C]0.351076[/C][/ROW]
[ROW][C]18[/C][C]-0.097517[/C][C]-0.9404[/C][C]0.17472[/C][/ROW]
[ROW][C]19[/C][C]0.04517[/C][C]0.4356[/C][C]0.332066[/C][/ROW]
[/TABLE]
Source: https://freestatistics.org/blog/index.php?pk=32042&T=2

Globally Unique Identifier (entire table): ba.freestatistics.org/blog/index.php?pk=32042&T=2

As an alternative you can also use a QR Code:  

The GUIDs for individual cells are displayed in the table below:

Partial Autocorrelation Function
Time lag kPACF(k)T-STATP-value
10.2795212.69560.00417
2-0.051662-0.49820.309756
30.0967830.93330.176531
40.0429230.41390.339939
50.0583310.56250.287555
6-0.132811-1.28080.101728
7-0.039598-0.38190.351714
80.1493241.440.076609
9-0.233634-2.25310.013302
10-0.132018-1.27310.103071
11-0.030305-0.29230.385372
120.1946051.87670.031847
13-0.065983-0.63630.263067
14-0.096182-0.92750.178021
15-0.164597-1.58730.057917
160.0691650.6670.25321
17-0.039777-0.38360.351076
18-0.097517-0.94040.17472
190.045170.43560.332066


Parameters (Session):
par1 = Default ; par2 = 1 ; par3 = 1 ; par4 = 0 ; par5 = 12 ;
Parameters (R input):
par1 = Default ; par2 = 1 ; par3 = 1 ; par4 = 0 ; par5 = 12 ;
R code (references can be found in the software module):
if (par1 == 'Default') {
par1 = 10*log10(length(x))
} else {
par1 <- as.numeric(par1)
}
par2 <- as.numeric(par2)
par3 <- as.numeric(par3)
par4 <- as.numeric(par4)
par5 <- as.numeric(par5)
if (par2 == 0) {
x <- log(x)
} else {
x <- (x ^ par2 - 1) / par2
}
if (par3 > 0) x <- diff(x,lag=1,difference=par3)
if (par4 > 0) x <- diff(x,lag=par5,difference=par4)
bitmap(file='pic1.png')
racf <- acf(x,par1,main='Autocorrelation',xlab='lags',ylab='ACF')
dev.off()
bitmap(file='pic2.png')
rpacf <- pacf(x,par1,main='Partial Autocorrelation',xlab='lags',ylab='PACF')
dev.off()
(myacf <- c(racf$acf))
(mypacf <- c(rpacf$acf))
lengthx <- length(x)
sqrtn <- sqrt(lengthx)
load(file='createtable')
a<-table.start()
a<-table.row.start(a)
a<-table.element(a,'Autocorrelation Function',4,TRUE)
a<-table.row.end(a)
a<-table.row.start(a)
a<-table.element(a,'Time lag k',header=TRUE)
a<-table.element(a,hyperlink('basics.htm','ACF(k)','click here for more information about the Autocorrelation Function'),header=TRUE)
a<-table.element(a,'T-STAT',header=TRUE)
a<-table.element(a,'P-value',header=TRUE)
a<-table.row.end(a)
for (i in 2:(par1+1)) {
a<-table.row.start(a)
a<-table.element(a,i-1,header=TRUE)
a<-table.element(a,round(myacf[i],6))
mytstat <- myacf[i]*sqrtn
a<-table.element(a,round(mytstat,4))
a<-table.element(a,round(1-pt(abs(mytstat),lengthx),6))
a<-table.row.end(a)
}
a<-table.end(a)
table.save(a,file='mytable.tab')
a<-table.start()
a<-table.row.start(a)
a<-table.element(a,'Partial Autocorrelation Function',4,TRUE)
a<-table.row.end(a)
a<-table.row.start(a)
a<-table.element(a,'Time lag k',header=TRUE)
a<-table.element(a,hyperlink('basics.htm','PACF(k)','click here for more information about the Partial Autocorrelation Function'),header=TRUE)
a<-table.element(a,'T-STAT',header=TRUE)
a<-table.element(a,'P-value',header=TRUE)
a<-table.row.end(a)
for (i in 1:par1) {
a<-table.row.start(a)
a<-table.element(a,i,header=TRUE)
a<-table.element(a,round(mypacf[i],6))
mytstat <- mypacf[i]*sqrtn
a<-table.element(a,round(mytstat,4))
a<-table.element(a,round(1-pt(abs(mytstat),lengthx),6))
a<-table.row.end(a)
}
a<-table.end(a)
table.save(a,file='mytable1.tab')