Free Statistics

of Irreproducible Research!

Author's title

Author*The author of this computation has been verified*
R Software Modulerwasp_autocorrelation.wasp
Title produced by software(Partial) Autocorrelation Function
Date of computationWed, 10 Dec 2008 05:46:23 -0700
Cite this page as followsStatistical Computations at FreeStatistics.org, Office for Research Development and Education, URL https://freestatistics.org/blog/index.php?v=date/2008/Dec/10/t122891322567xfys24ybhmjqa.htm/, Retrieved Sun, 19 May 2024 05:14:01 +0000
Statistical Computations at FreeStatistics.org, Office for Research Development and Education, URL https://freestatistics.org/blog/index.php?pk=31929, Retrieved Sun, 19 May 2024 05:14:01 +0000
QR Codes:

Original text written by user:
IsPrivate?No (this computation is public)
User-defined keywords
Estimated Impact189
Family? (F = Feedback message, R = changed R code, M = changed R Module, P = changed Parameters, D = changed Data)
F     [Harrell-Davis Quantiles] [Q7 95% confidence...] [2007-10-20 15:02:46] [b731da8b544846036771bbf9bf2f34ce]
- RMPD  [Univariate Data Series] [Tijdreeks 2] [2008-10-27 17:40:40] [2d4aec5ed1856c4828162be37be304d9]
- RMPD      [(Partial) Autocorrelation Function] [Tijdreeks 2 (P)ACF] [2008-12-10 12:46:23] [d7f41258beeebb8716e3f5d39f3cdc01] [Current]
Feedback Forum

Post a new message
Dataseries X:
148.8
146.7
118.8
99.4
97.6
110.2
146.6
136.4
126.2
154.9
109
128.5
144.9
136.3
134.8
103.4
106.6
119.2
149.3
150.2
142.9
163.6
98.2
138.2
143.7
132.8
149.4
128.8
98.9
106.2
140.7
133
156.4
157.7
107.9
133.6
148.1
205.6
193.1
117.5
116.4
129.5
157.1
157
158.4
161.7
116.9
161.1
155.7
160.8
145.4
111
144.8
149.2
156.6
182.5
171.3
172.7
133
148.1


Summary of computational transaction
Raw Inputview raw input (R code)
Raw Outputview raw output of R engine
Computing time1 seconds
R Server'George Udny Yule' @ 72.249.76.132

\begin{tabular}{lllllllll}
\hline
Summary of computational transaction \tabularnewline
Raw Input & view raw input (R code)  \tabularnewline
Raw Output & view raw output of R engine  \tabularnewline
Computing time & 1 seconds \tabularnewline
R Server & 'George Udny Yule' @ 72.249.76.132 \tabularnewline
\hline
\end{tabular}
%Source: https://freestatistics.org/blog/index.php?pk=31929&T=0

[TABLE]
[ROW][C]Summary of computational transaction[/C][/ROW]
[ROW][C]Raw Input[/C][C]view raw input (R code) [/C][/ROW]
[ROW][C]Raw Output[/C][C]view raw output of R engine [/C][/ROW]
[ROW][C]Computing time[/C][C]1 seconds[/C][/ROW]
[ROW][C]R Server[/C][C]'George Udny Yule' @ 72.249.76.132[/C][/ROW]
[/TABLE]
Source: https://freestatistics.org/blog/index.php?pk=31929&T=0

Globally Unique Identifier (entire table): ba.freestatistics.org/blog/index.php?pk=31929&T=0

As an alternative you can also use a QR Code:  

The GUIDs for individual cells are displayed in the table below:

Summary of computational transaction
Raw Inputview raw input (R code)
Raw Outputview raw output of R engine
Computing time1 seconds
R Server'George Udny Yule' @ 72.249.76.132


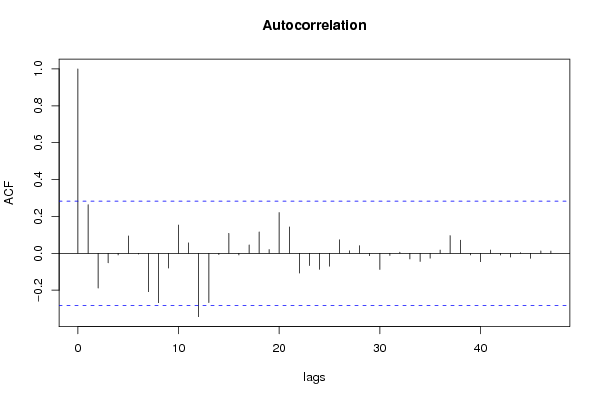
Autocorrelation Function
Time lag kACF(k)T-STATP-value
10.2640981.82970.036753
2-0.188284-1.30450.099147
3-0.051459-0.35650.361506
4-0.008793-0.06090.475839
50.0940840.65180.258808
6-0.004221-0.02920.488396
7-0.208382-1.44370.077657
8-0.267424-1.85280.035035
9-0.079831-0.55310.291386
100.153341.06240.146692
110.0566860.39270.348129
12-0.343461-2.37960.010678
13-0.266845-1.84880.035328
14-0.006454-0.04470.482261
150.108220.74980.228526
16-0.008769-0.06080.475904
170.0454090.31460.377214
180.11590.8030.212973
190.0204720.14180.443903
200.2212631.5330.065926
210.1429450.99030.163485
22-0.107372-0.74390.230284
23-0.066622-0.46160.323238
24-0.086943-0.60240.274884
25-0.069484-0.48140.31621
260.0736480.51020.306108
270.013660.09460.462498
280.0411520.28510.388394
29-0.013173-0.09130.463831
30-0.087601-0.60690.273382
31-0.011152-0.07730.469367
320.0063380.04390.482578
33-0.030452-0.2110.416898
34-0.044228-0.30640.380305
35-0.026092-0.18080.428655
360.0177110.12270.451428
370.0960270.66530.254522
380.0711950.49330.31204
39-0.00851-0.0590.476615
40-0.04547-0.3150.377054
410.017920.12420.450855
42-0.009694-0.06720.473367
43-0.020347-0.1410.444242
440.0033430.02320.490808
45-0.027367-0.18960.425209
460.0126710.08780.465206
470.0123490.08560.466087
48NANANA
49NANANA
50NANANA
51NANANA
52NANANA
53NANANA
54NANANA
55NANANA
56NANANA
57NANANA
58NANANA
59NANANA
60NANANA

\begin{tabular}{lllllllll}
\hline
Autocorrelation Function \tabularnewline
Time lag k & ACF(k) & T-STAT & P-value \tabularnewline
1 & 0.264098 & 1.8297 & 0.036753 \tabularnewline
2 & -0.188284 & -1.3045 & 0.099147 \tabularnewline
3 & -0.051459 & -0.3565 & 0.361506 \tabularnewline
4 & -0.008793 & -0.0609 & 0.475839 \tabularnewline
5 & 0.094084 & 0.6518 & 0.258808 \tabularnewline
6 & -0.004221 & -0.0292 & 0.488396 \tabularnewline
7 & -0.208382 & -1.4437 & 0.077657 \tabularnewline
8 & -0.267424 & -1.8528 & 0.035035 \tabularnewline
9 & -0.079831 & -0.5531 & 0.291386 \tabularnewline
10 & 0.15334 & 1.0624 & 0.146692 \tabularnewline
11 & 0.056686 & 0.3927 & 0.348129 \tabularnewline
12 & -0.343461 & -2.3796 & 0.010678 \tabularnewline
13 & -0.266845 & -1.8488 & 0.035328 \tabularnewline
14 & -0.006454 & -0.0447 & 0.482261 \tabularnewline
15 & 0.10822 & 0.7498 & 0.228526 \tabularnewline
16 & -0.008769 & -0.0608 & 0.475904 \tabularnewline
17 & 0.045409 & 0.3146 & 0.377214 \tabularnewline
18 & 0.1159 & 0.803 & 0.212973 \tabularnewline
19 & 0.020472 & 0.1418 & 0.443903 \tabularnewline
20 & 0.221263 & 1.533 & 0.065926 \tabularnewline
21 & 0.142945 & 0.9903 & 0.163485 \tabularnewline
22 & -0.107372 & -0.7439 & 0.230284 \tabularnewline
23 & -0.066622 & -0.4616 & 0.323238 \tabularnewline
24 & -0.086943 & -0.6024 & 0.274884 \tabularnewline
25 & -0.069484 & -0.4814 & 0.31621 \tabularnewline
26 & 0.073648 & 0.5102 & 0.306108 \tabularnewline
27 & 0.01366 & 0.0946 & 0.462498 \tabularnewline
28 & 0.041152 & 0.2851 & 0.388394 \tabularnewline
29 & -0.013173 & -0.0913 & 0.463831 \tabularnewline
30 & -0.087601 & -0.6069 & 0.273382 \tabularnewline
31 & -0.011152 & -0.0773 & 0.469367 \tabularnewline
32 & 0.006338 & 0.0439 & 0.482578 \tabularnewline
33 & -0.030452 & -0.211 & 0.416898 \tabularnewline
34 & -0.044228 & -0.3064 & 0.380305 \tabularnewline
35 & -0.026092 & -0.1808 & 0.428655 \tabularnewline
36 & 0.017711 & 0.1227 & 0.451428 \tabularnewline
37 & 0.096027 & 0.6653 & 0.254522 \tabularnewline
38 & 0.071195 & 0.4933 & 0.31204 \tabularnewline
39 & -0.00851 & -0.059 & 0.476615 \tabularnewline
40 & -0.04547 & -0.315 & 0.377054 \tabularnewline
41 & 0.01792 & 0.1242 & 0.450855 \tabularnewline
42 & -0.009694 & -0.0672 & 0.473367 \tabularnewline
43 & -0.020347 & -0.141 & 0.444242 \tabularnewline
44 & 0.003343 & 0.0232 & 0.490808 \tabularnewline
45 & -0.027367 & -0.1896 & 0.425209 \tabularnewline
46 & 0.012671 & 0.0878 & 0.465206 \tabularnewline
47 & 0.012349 & 0.0856 & 0.466087 \tabularnewline
48 & NA & NA & NA \tabularnewline
49 & NA & NA & NA \tabularnewline
50 & NA & NA & NA \tabularnewline
51 & NA & NA & NA \tabularnewline
52 & NA & NA & NA \tabularnewline
53 & NA & NA & NA \tabularnewline
54 & NA & NA & NA \tabularnewline
55 & NA & NA & NA \tabularnewline
56 & NA & NA & NA \tabularnewline
57 & NA & NA & NA \tabularnewline
58 & NA & NA & NA \tabularnewline
59 & NA & NA & NA \tabularnewline
60 & NA & NA & NA \tabularnewline
\hline
\end{tabular}
%Source: https://freestatistics.org/blog/index.php?pk=31929&T=1

[TABLE]
[ROW][C]Autocorrelation Function[/C][/ROW]
[ROW][C]Time lag k[/C][C]ACF(k)[/C][C]T-STAT[/C][C]P-value[/C][/ROW]
[ROW][C]1[/C][C]0.264098[/C][C]1.8297[/C][C]0.036753[/C][/ROW]
[ROW][C]2[/C][C]-0.188284[/C][C]-1.3045[/C][C]0.099147[/C][/ROW]
[ROW][C]3[/C][C]-0.051459[/C][C]-0.3565[/C][C]0.361506[/C][/ROW]
[ROW][C]4[/C][C]-0.008793[/C][C]-0.0609[/C][C]0.475839[/C][/ROW]
[ROW][C]5[/C][C]0.094084[/C][C]0.6518[/C][C]0.258808[/C][/ROW]
[ROW][C]6[/C][C]-0.004221[/C][C]-0.0292[/C][C]0.488396[/C][/ROW]
[ROW][C]7[/C][C]-0.208382[/C][C]-1.4437[/C][C]0.077657[/C][/ROW]
[ROW][C]8[/C][C]-0.267424[/C][C]-1.8528[/C][C]0.035035[/C][/ROW]
[ROW][C]9[/C][C]-0.079831[/C][C]-0.5531[/C][C]0.291386[/C][/ROW]
[ROW][C]10[/C][C]0.15334[/C][C]1.0624[/C][C]0.146692[/C][/ROW]
[ROW][C]11[/C][C]0.056686[/C][C]0.3927[/C][C]0.348129[/C][/ROW]
[ROW][C]12[/C][C]-0.343461[/C][C]-2.3796[/C][C]0.010678[/C][/ROW]
[ROW][C]13[/C][C]-0.266845[/C][C]-1.8488[/C][C]0.035328[/C][/ROW]
[ROW][C]14[/C][C]-0.006454[/C][C]-0.0447[/C][C]0.482261[/C][/ROW]
[ROW][C]15[/C][C]0.10822[/C][C]0.7498[/C][C]0.228526[/C][/ROW]
[ROW][C]16[/C][C]-0.008769[/C][C]-0.0608[/C][C]0.475904[/C][/ROW]
[ROW][C]17[/C][C]0.045409[/C][C]0.3146[/C][C]0.377214[/C][/ROW]
[ROW][C]18[/C][C]0.1159[/C][C]0.803[/C][C]0.212973[/C][/ROW]
[ROW][C]19[/C][C]0.020472[/C][C]0.1418[/C][C]0.443903[/C][/ROW]
[ROW][C]20[/C][C]0.221263[/C][C]1.533[/C][C]0.065926[/C][/ROW]
[ROW][C]21[/C][C]0.142945[/C][C]0.9903[/C][C]0.163485[/C][/ROW]
[ROW][C]22[/C][C]-0.107372[/C][C]-0.7439[/C][C]0.230284[/C][/ROW]
[ROW][C]23[/C][C]-0.066622[/C][C]-0.4616[/C][C]0.323238[/C][/ROW]
[ROW][C]24[/C][C]-0.086943[/C][C]-0.6024[/C][C]0.274884[/C][/ROW]
[ROW][C]25[/C][C]-0.069484[/C][C]-0.4814[/C][C]0.31621[/C][/ROW]
[ROW][C]26[/C][C]0.073648[/C][C]0.5102[/C][C]0.306108[/C][/ROW]
[ROW][C]27[/C][C]0.01366[/C][C]0.0946[/C][C]0.462498[/C][/ROW]
[ROW][C]28[/C][C]0.041152[/C][C]0.2851[/C][C]0.388394[/C][/ROW]
[ROW][C]29[/C][C]-0.013173[/C][C]-0.0913[/C][C]0.463831[/C][/ROW]
[ROW][C]30[/C][C]-0.087601[/C][C]-0.6069[/C][C]0.273382[/C][/ROW]
[ROW][C]31[/C][C]-0.011152[/C][C]-0.0773[/C][C]0.469367[/C][/ROW]
[ROW][C]32[/C][C]0.006338[/C][C]0.0439[/C][C]0.482578[/C][/ROW]
[ROW][C]33[/C][C]-0.030452[/C][C]-0.211[/C][C]0.416898[/C][/ROW]
[ROW][C]34[/C][C]-0.044228[/C][C]-0.3064[/C][C]0.380305[/C][/ROW]
[ROW][C]35[/C][C]-0.026092[/C][C]-0.1808[/C][C]0.428655[/C][/ROW]
[ROW][C]36[/C][C]0.017711[/C][C]0.1227[/C][C]0.451428[/C][/ROW]
[ROW][C]37[/C][C]0.096027[/C][C]0.6653[/C][C]0.254522[/C][/ROW]
[ROW][C]38[/C][C]0.071195[/C][C]0.4933[/C][C]0.31204[/C][/ROW]
[ROW][C]39[/C][C]-0.00851[/C][C]-0.059[/C][C]0.476615[/C][/ROW]
[ROW][C]40[/C][C]-0.04547[/C][C]-0.315[/C][C]0.377054[/C][/ROW]
[ROW][C]41[/C][C]0.01792[/C][C]0.1242[/C][C]0.450855[/C][/ROW]
[ROW][C]42[/C][C]-0.009694[/C][C]-0.0672[/C][C]0.473367[/C][/ROW]
[ROW][C]43[/C][C]-0.020347[/C][C]-0.141[/C][C]0.444242[/C][/ROW]
[ROW][C]44[/C][C]0.003343[/C][C]0.0232[/C][C]0.490808[/C][/ROW]
[ROW][C]45[/C][C]-0.027367[/C][C]-0.1896[/C][C]0.425209[/C][/ROW]
[ROW][C]46[/C][C]0.012671[/C][C]0.0878[/C][C]0.465206[/C][/ROW]
[ROW][C]47[/C][C]0.012349[/C][C]0.0856[/C][C]0.466087[/C][/ROW]
[ROW][C]48[/C][C]NA[/C][C]NA[/C][C]NA[/C][/ROW]
[ROW][C]49[/C][C]NA[/C][C]NA[/C][C]NA[/C][/ROW]
[ROW][C]50[/C][C]NA[/C][C]NA[/C][C]NA[/C][/ROW]
[ROW][C]51[/C][C]NA[/C][C]NA[/C][C]NA[/C][/ROW]
[ROW][C]52[/C][C]NA[/C][C]NA[/C][C]NA[/C][/ROW]
[ROW][C]53[/C][C]NA[/C][C]NA[/C][C]NA[/C][/ROW]
[ROW][C]54[/C][C]NA[/C][C]NA[/C][C]NA[/C][/ROW]
[ROW][C]55[/C][C]NA[/C][C]NA[/C][C]NA[/C][/ROW]
[ROW][C]56[/C][C]NA[/C][C]NA[/C][C]NA[/C][/ROW]
[ROW][C]57[/C][C]NA[/C][C]NA[/C][C]NA[/C][/ROW]
[ROW][C]58[/C][C]NA[/C][C]NA[/C][C]NA[/C][/ROW]
[ROW][C]59[/C][C]NA[/C][C]NA[/C][C]NA[/C][/ROW]
[ROW][C]60[/C][C]NA[/C][C]NA[/C][C]NA[/C][/ROW]
[/TABLE]
Source: https://freestatistics.org/blog/index.php?pk=31929&T=1

Globally Unique Identifier (entire table): ba.freestatistics.org/blog/index.php?pk=31929&T=1

As an alternative you can also use a QR Code:  

The GUIDs for individual cells are displayed in the table below:

Autocorrelation Function
Time lag kACF(k)T-STATP-value
10.2640981.82970.036753
2-0.188284-1.30450.099147
3-0.051459-0.35650.361506
4-0.008793-0.06090.475839
50.0940840.65180.258808
6-0.004221-0.02920.488396
7-0.208382-1.44370.077657
8-0.267424-1.85280.035035
9-0.079831-0.55310.291386
100.153341.06240.146692
110.0566860.39270.348129
12-0.343461-2.37960.010678
13-0.266845-1.84880.035328
14-0.006454-0.04470.482261
150.108220.74980.228526
16-0.008769-0.06080.475904
170.0454090.31460.377214
180.11590.8030.212973
190.0204720.14180.443903
200.2212631.5330.065926
210.1429450.99030.163485
22-0.107372-0.74390.230284
23-0.066622-0.46160.323238
24-0.086943-0.60240.274884
25-0.069484-0.48140.31621
260.0736480.51020.306108
270.013660.09460.462498
280.0411520.28510.388394
29-0.013173-0.09130.463831
30-0.087601-0.60690.273382
31-0.011152-0.07730.469367
320.0063380.04390.482578
33-0.030452-0.2110.416898
34-0.044228-0.30640.380305
35-0.026092-0.18080.428655
360.0177110.12270.451428
370.0960270.66530.254522
380.0711950.49330.31204
39-0.00851-0.0590.476615
40-0.04547-0.3150.377054
410.017920.12420.450855
42-0.009694-0.06720.473367
43-0.020347-0.1410.444242
440.0033430.02320.490808
45-0.027367-0.18960.425209
460.0126710.08780.465206
470.0123490.08560.466087
48NANANA
49NANANA
50NANANA
51NANANA
52NANANA
53NANANA
54NANANA
55NANANA
56NANANA
57NANANA
58NANANA
59NANANA
60NANANA


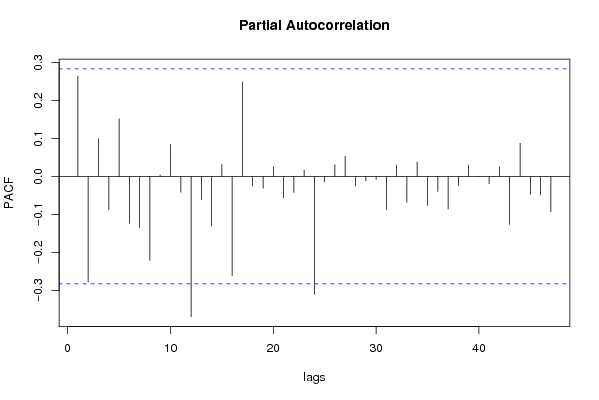
Partial Autocorrelation Function
Time lag kPACF(k)T-STATP-value
10.2640981.82970.036753
2-0.277378-1.92170.030294
30.0993550.68830.247273
4-0.087968-0.60950.272547
50.1516641.05080.149316
6-0.123345-0.85460.198521
7-0.134394-0.93110.178228
8-0.220774-1.52960.066344
90.0040880.02830.488762
100.0842630.58380.281046
11-0.041484-0.28740.387519
12-0.368858-2.55550.006913
13-0.061334-0.42490.336392
14-0.130376-0.90330.185446
150.0318030.22030.413271
16-0.260635-1.80570.038617
170.2484971.72160.045787
18-0.025415-0.17610.430487
19-0.030964-0.21450.415524
200.0258620.17920.429277
21-0.056266-0.38980.349195
22-0.042121-0.29180.385839
230.0165550.11470.454583
24-0.310248-2.14950.018334
25-0.014536-0.10070.460101
260.0308410.21370.415853
270.0532140.36870.356996
28-0.024593-0.17040.432712
29-0.012127-0.0840.466695
30-0.007704-0.05340.478828
31-0.086704-0.60070.275433
320.0301430.20880.417729
33-0.067669-0.46880.320659
340.0380660.26370.396558
35-0.076154-0.52760.300101
36-0.039564-0.27410.39259
37-0.08566-0.59350.277826
38-0.023896-0.16560.434602
390.030080.20840.417899
400.0003420.00240.499059
41-0.019378-0.13430.446881
420.0256010.17740.429982
43-0.126087-0.87360.193354
440.0871110.60350.2745
45-0.046571-0.32270.374179
46-0.04875-0.33770.368512
47-0.093031-0.64450.261148
48NANANA
49NANANA
50NANANA
51NANANA
52NANANA
53NANANA
54NANANA
55NANANA
56NANANA
57NANANA
58NANANA
59NANANA
60NANANA

\begin{tabular}{lllllllll}
\hline
Partial Autocorrelation Function \tabularnewline
Time lag k & PACF(k) & T-STAT & P-value \tabularnewline
1 & 0.264098 & 1.8297 & 0.036753 \tabularnewline
2 & -0.277378 & -1.9217 & 0.030294 \tabularnewline
3 & 0.099355 & 0.6883 & 0.247273 \tabularnewline
4 & -0.087968 & -0.6095 & 0.272547 \tabularnewline
5 & 0.151664 & 1.0508 & 0.149316 \tabularnewline
6 & -0.123345 & -0.8546 & 0.198521 \tabularnewline
7 & -0.134394 & -0.9311 & 0.178228 \tabularnewline
8 & -0.220774 & -1.5296 & 0.066344 \tabularnewline
9 & 0.004088 & 0.0283 & 0.488762 \tabularnewline
10 & 0.084263 & 0.5838 & 0.281046 \tabularnewline
11 & -0.041484 & -0.2874 & 0.387519 \tabularnewline
12 & -0.368858 & -2.5555 & 0.006913 \tabularnewline
13 & -0.061334 & -0.4249 & 0.336392 \tabularnewline
14 & -0.130376 & -0.9033 & 0.185446 \tabularnewline
15 & 0.031803 & 0.2203 & 0.413271 \tabularnewline
16 & -0.260635 & -1.8057 & 0.038617 \tabularnewline
17 & 0.248497 & 1.7216 & 0.045787 \tabularnewline
18 & -0.025415 & -0.1761 & 0.430487 \tabularnewline
19 & -0.030964 & -0.2145 & 0.415524 \tabularnewline
20 & 0.025862 & 0.1792 & 0.429277 \tabularnewline
21 & -0.056266 & -0.3898 & 0.349195 \tabularnewline
22 & -0.042121 & -0.2918 & 0.385839 \tabularnewline
23 & 0.016555 & 0.1147 & 0.454583 \tabularnewline
24 & -0.310248 & -2.1495 & 0.018334 \tabularnewline
25 & -0.014536 & -0.1007 & 0.460101 \tabularnewline
26 & 0.030841 & 0.2137 & 0.415853 \tabularnewline
27 & 0.053214 & 0.3687 & 0.356996 \tabularnewline
28 & -0.024593 & -0.1704 & 0.432712 \tabularnewline
29 & -0.012127 & -0.084 & 0.466695 \tabularnewline
30 & -0.007704 & -0.0534 & 0.478828 \tabularnewline
31 & -0.086704 & -0.6007 & 0.275433 \tabularnewline
32 & 0.030143 & 0.2088 & 0.417729 \tabularnewline
33 & -0.067669 & -0.4688 & 0.320659 \tabularnewline
34 & 0.038066 & 0.2637 & 0.396558 \tabularnewline
35 & -0.076154 & -0.5276 & 0.300101 \tabularnewline
36 & -0.039564 & -0.2741 & 0.39259 \tabularnewline
37 & -0.08566 & -0.5935 & 0.277826 \tabularnewline
38 & -0.023896 & -0.1656 & 0.434602 \tabularnewline
39 & 0.03008 & 0.2084 & 0.417899 \tabularnewline
40 & 0.000342 & 0.0024 & 0.499059 \tabularnewline
41 & -0.019378 & -0.1343 & 0.446881 \tabularnewline
42 & 0.025601 & 0.1774 & 0.429982 \tabularnewline
43 & -0.126087 & -0.8736 & 0.193354 \tabularnewline
44 & 0.087111 & 0.6035 & 0.2745 \tabularnewline
45 & -0.046571 & -0.3227 & 0.374179 \tabularnewline
46 & -0.04875 & -0.3377 & 0.368512 \tabularnewline
47 & -0.093031 & -0.6445 & 0.261148 \tabularnewline
48 & NA & NA & NA \tabularnewline
49 & NA & NA & NA \tabularnewline
50 & NA & NA & NA \tabularnewline
51 & NA & NA & NA \tabularnewline
52 & NA & NA & NA \tabularnewline
53 & NA & NA & NA \tabularnewline
54 & NA & NA & NA \tabularnewline
55 & NA & NA & NA \tabularnewline
56 & NA & NA & NA \tabularnewline
57 & NA & NA & NA \tabularnewline
58 & NA & NA & NA \tabularnewline
59 & NA & NA & NA \tabularnewline
60 & NA & NA & NA \tabularnewline
\hline
\end{tabular}
%Source: https://freestatistics.org/blog/index.php?pk=31929&T=2

[TABLE]
[ROW][C]Partial Autocorrelation Function[/C][/ROW]
[ROW][C]Time lag k[/C][C]PACF(k)[/C][C]T-STAT[/C][C]P-value[/C][/ROW]
[ROW][C]1[/C][C]0.264098[/C][C]1.8297[/C][C]0.036753[/C][/ROW]
[ROW][C]2[/C][C]-0.277378[/C][C]-1.9217[/C][C]0.030294[/C][/ROW]
[ROW][C]3[/C][C]0.099355[/C][C]0.6883[/C][C]0.247273[/C][/ROW]
[ROW][C]4[/C][C]-0.087968[/C][C]-0.6095[/C][C]0.272547[/C][/ROW]
[ROW][C]5[/C][C]0.151664[/C][C]1.0508[/C][C]0.149316[/C][/ROW]
[ROW][C]6[/C][C]-0.123345[/C][C]-0.8546[/C][C]0.198521[/C][/ROW]
[ROW][C]7[/C][C]-0.134394[/C][C]-0.9311[/C][C]0.178228[/C][/ROW]
[ROW][C]8[/C][C]-0.220774[/C][C]-1.5296[/C][C]0.066344[/C][/ROW]
[ROW][C]9[/C][C]0.004088[/C][C]0.0283[/C][C]0.488762[/C][/ROW]
[ROW][C]10[/C][C]0.084263[/C][C]0.5838[/C][C]0.281046[/C][/ROW]
[ROW][C]11[/C][C]-0.041484[/C][C]-0.2874[/C][C]0.387519[/C][/ROW]
[ROW][C]12[/C][C]-0.368858[/C][C]-2.5555[/C][C]0.006913[/C][/ROW]
[ROW][C]13[/C][C]-0.061334[/C][C]-0.4249[/C][C]0.336392[/C][/ROW]
[ROW][C]14[/C][C]-0.130376[/C][C]-0.9033[/C][C]0.185446[/C][/ROW]
[ROW][C]15[/C][C]0.031803[/C][C]0.2203[/C][C]0.413271[/C][/ROW]
[ROW][C]16[/C][C]-0.260635[/C][C]-1.8057[/C][C]0.038617[/C][/ROW]
[ROW][C]17[/C][C]0.248497[/C][C]1.7216[/C][C]0.045787[/C][/ROW]
[ROW][C]18[/C][C]-0.025415[/C][C]-0.1761[/C][C]0.430487[/C][/ROW]
[ROW][C]19[/C][C]-0.030964[/C][C]-0.2145[/C][C]0.415524[/C][/ROW]
[ROW][C]20[/C][C]0.025862[/C][C]0.1792[/C][C]0.429277[/C][/ROW]
[ROW][C]21[/C][C]-0.056266[/C][C]-0.3898[/C][C]0.349195[/C][/ROW]
[ROW][C]22[/C][C]-0.042121[/C][C]-0.2918[/C][C]0.385839[/C][/ROW]
[ROW][C]23[/C][C]0.016555[/C][C]0.1147[/C][C]0.454583[/C][/ROW]
[ROW][C]24[/C][C]-0.310248[/C][C]-2.1495[/C][C]0.018334[/C][/ROW]
[ROW][C]25[/C][C]-0.014536[/C][C]-0.1007[/C][C]0.460101[/C][/ROW]
[ROW][C]26[/C][C]0.030841[/C][C]0.2137[/C][C]0.415853[/C][/ROW]
[ROW][C]27[/C][C]0.053214[/C][C]0.3687[/C][C]0.356996[/C][/ROW]
[ROW][C]28[/C][C]-0.024593[/C][C]-0.1704[/C][C]0.432712[/C][/ROW]
[ROW][C]29[/C][C]-0.012127[/C][C]-0.084[/C][C]0.466695[/C][/ROW]
[ROW][C]30[/C][C]-0.007704[/C][C]-0.0534[/C][C]0.478828[/C][/ROW]
[ROW][C]31[/C][C]-0.086704[/C][C]-0.6007[/C][C]0.275433[/C][/ROW]
[ROW][C]32[/C][C]0.030143[/C][C]0.2088[/C][C]0.417729[/C][/ROW]
[ROW][C]33[/C][C]-0.067669[/C][C]-0.4688[/C][C]0.320659[/C][/ROW]
[ROW][C]34[/C][C]0.038066[/C][C]0.2637[/C][C]0.396558[/C][/ROW]
[ROW][C]35[/C][C]-0.076154[/C][C]-0.5276[/C][C]0.300101[/C][/ROW]
[ROW][C]36[/C][C]-0.039564[/C][C]-0.2741[/C][C]0.39259[/C][/ROW]
[ROW][C]37[/C][C]-0.08566[/C][C]-0.5935[/C][C]0.277826[/C][/ROW]
[ROW][C]38[/C][C]-0.023896[/C][C]-0.1656[/C][C]0.434602[/C][/ROW]
[ROW][C]39[/C][C]0.03008[/C][C]0.2084[/C][C]0.417899[/C][/ROW]
[ROW][C]40[/C][C]0.000342[/C][C]0.0024[/C][C]0.499059[/C][/ROW]
[ROW][C]41[/C][C]-0.019378[/C][C]-0.1343[/C][C]0.446881[/C][/ROW]
[ROW][C]42[/C][C]0.025601[/C][C]0.1774[/C][C]0.429982[/C][/ROW]
[ROW][C]43[/C][C]-0.126087[/C][C]-0.8736[/C][C]0.193354[/C][/ROW]
[ROW][C]44[/C][C]0.087111[/C][C]0.6035[/C][C]0.2745[/C][/ROW]
[ROW][C]45[/C][C]-0.046571[/C][C]-0.3227[/C][C]0.374179[/C][/ROW]
[ROW][C]46[/C][C]-0.04875[/C][C]-0.3377[/C][C]0.368512[/C][/ROW]
[ROW][C]47[/C][C]-0.093031[/C][C]-0.6445[/C][C]0.261148[/C][/ROW]
[ROW][C]48[/C][C]NA[/C][C]NA[/C][C]NA[/C][/ROW]
[ROW][C]49[/C][C]NA[/C][C]NA[/C][C]NA[/C][/ROW]
[ROW][C]50[/C][C]NA[/C][C]NA[/C][C]NA[/C][/ROW]
[ROW][C]51[/C][C]NA[/C][C]NA[/C][C]NA[/C][/ROW]
[ROW][C]52[/C][C]NA[/C][C]NA[/C][C]NA[/C][/ROW]
[ROW][C]53[/C][C]NA[/C][C]NA[/C][C]NA[/C][/ROW]
[ROW][C]54[/C][C]NA[/C][C]NA[/C][C]NA[/C][/ROW]
[ROW][C]55[/C][C]NA[/C][C]NA[/C][C]NA[/C][/ROW]
[ROW][C]56[/C][C]NA[/C][C]NA[/C][C]NA[/C][/ROW]
[ROW][C]57[/C][C]NA[/C][C]NA[/C][C]NA[/C][/ROW]
[ROW][C]58[/C][C]NA[/C][C]NA[/C][C]NA[/C][/ROW]
[ROW][C]59[/C][C]NA[/C][C]NA[/C][C]NA[/C][/ROW]
[ROW][C]60[/C][C]NA[/C][C]NA[/C][C]NA[/C][/ROW]
[/TABLE]
Source: https://freestatistics.org/blog/index.php?pk=31929&T=2

Globally Unique Identifier (entire table): ba.freestatistics.org/blog/index.php?pk=31929&T=2

As an alternative you can also use a QR Code:  

The GUIDs for individual cells are displayed in the table below:

Partial Autocorrelation Function
Time lag kPACF(k)T-STATP-value
10.2640981.82970.036753
2-0.277378-1.92170.030294
30.0993550.68830.247273
4-0.087968-0.60950.272547
50.1516641.05080.149316
6-0.123345-0.85460.198521
7-0.134394-0.93110.178228
8-0.220774-1.52960.066344
90.0040880.02830.488762
100.0842630.58380.281046
11-0.041484-0.28740.387519
12-0.368858-2.55550.006913
13-0.061334-0.42490.336392
14-0.130376-0.90330.185446
150.0318030.22030.413271
16-0.260635-1.80570.038617
170.2484971.72160.045787
18-0.025415-0.17610.430487
19-0.030964-0.21450.415524
200.0258620.17920.429277
21-0.056266-0.38980.349195
22-0.042121-0.29180.385839
230.0165550.11470.454583
24-0.310248-2.14950.018334
25-0.014536-0.10070.460101
260.0308410.21370.415853
270.0532140.36870.356996
28-0.024593-0.17040.432712
29-0.012127-0.0840.466695
30-0.007704-0.05340.478828
31-0.086704-0.60070.275433
320.0301430.20880.417729
33-0.067669-0.46880.320659
340.0380660.26370.396558
35-0.076154-0.52760.300101
36-0.039564-0.27410.39259
37-0.08566-0.59350.277826
38-0.023896-0.16560.434602
390.030080.20840.417899
400.0003420.00240.499059
41-0.019378-0.13430.446881
420.0256010.17740.429982
43-0.126087-0.87360.193354
440.0871110.60350.2745
45-0.046571-0.32270.374179
46-0.04875-0.33770.368512
47-0.093031-0.64450.261148
48NANANA
49NANANA
50NANANA
51NANANA
52NANANA
53NANANA
54NANANA
55NANANA
56NANANA
57NANANA
58NANANA
59NANANA
60NANANA


Parameters (Session):
par1 = 60 ; par2 = 0.1 ; par3 = 0 ; par4 = 1 ; par5 = 12 ;
Parameters (R input):
par1 = 60 ; par2 = 0.1 ; par3 = 0 ; par4 = 1 ; par5 = 12 ;
R code (references can be found in the software module):
if (par1 == 'Default') {
par1 = 10*log10(length(x))
} else {
par1 <- as.numeric(par1)
}
par2 <- as.numeric(par2)
par3 <- as.numeric(par3)
par4 <- as.numeric(par4)
par5 <- as.numeric(par5)
if (par2 == 0) {
x <- log(x)
} else {
x <- (x ^ par2 - 1) / par2
}
if (par3 > 0) x <- diff(x,lag=1,difference=par3)
if (par4 > 0) x <- diff(x,lag=par5,difference=par4)
bitmap(file='pic1.png')
racf <- acf(x,par1,main='Autocorrelation',xlab='lags',ylab='ACF')
dev.off()
bitmap(file='pic2.png')
rpacf <- pacf(x,par1,main='Partial Autocorrelation',xlab='lags',ylab='PACF')
dev.off()
(myacf <- c(racf$acf))
(mypacf <- c(rpacf$acf))
lengthx <- length(x)
sqrtn <- sqrt(lengthx)
load(file='createtable')
a<-table.start()
a<-table.row.start(a)
a<-table.element(a,'Autocorrelation Function',4,TRUE)
a<-table.row.end(a)
a<-table.row.start(a)
a<-table.element(a,'Time lag k',header=TRUE)
a<-table.element(a,hyperlink('basics.htm','ACF(k)','click here for more information about the Autocorrelation Function'),header=TRUE)
a<-table.element(a,'T-STAT',header=TRUE)
a<-table.element(a,'P-value',header=TRUE)
a<-table.row.end(a)
for (i in 2:(par1+1)) {
a<-table.row.start(a)
a<-table.element(a,i-1,header=TRUE)
a<-table.element(a,round(myacf[i],6))
mytstat <- myacf[i]*sqrtn
a<-table.element(a,round(mytstat,4))
a<-table.element(a,round(1-pt(abs(mytstat),lengthx),6))
a<-table.row.end(a)
}
a<-table.end(a)
table.save(a,file='mytable.tab')
a<-table.start()
a<-table.row.start(a)
a<-table.element(a,'Partial Autocorrelation Function',4,TRUE)
a<-table.row.end(a)
a<-table.row.start(a)
a<-table.element(a,'Time lag k',header=TRUE)
a<-table.element(a,hyperlink('basics.htm','PACF(k)','click here for more information about the Partial Autocorrelation Function'),header=TRUE)
a<-table.element(a,'T-STAT',header=TRUE)
a<-table.element(a,'P-value',header=TRUE)
a<-table.row.end(a)
for (i in 1:par1) {
a<-table.row.start(a)
a<-table.element(a,i,header=TRUE)
a<-table.element(a,round(mypacf[i],6))
mytstat <- mypacf[i]*sqrtn
a<-table.element(a,round(mytstat,4))
a<-table.element(a,round(1-pt(abs(mytstat),lengthx),6))
a<-table.row.end(a)
}
a<-table.end(a)
table.save(a,file='mytable1.tab')