Free Statistics

of Irreproducible Research!

Author's title

Author*The author of this computation has been verified*
R Software Modulerwasp_autocorrelation.wasp
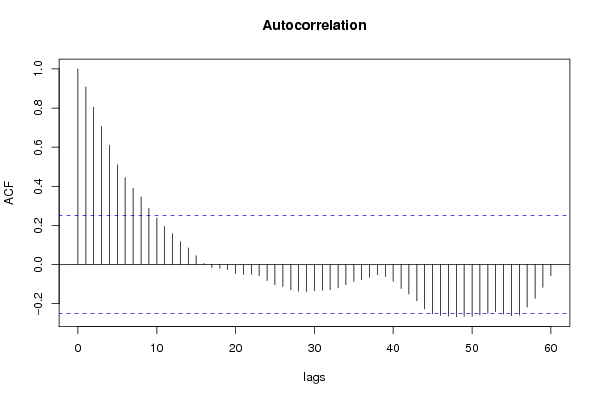
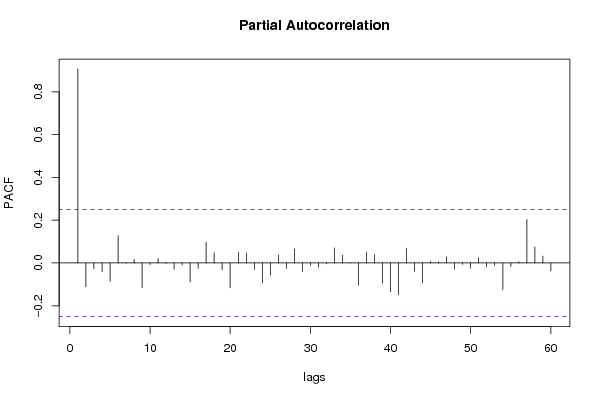
Title produced by software(Partial) Autocorrelation Function
Date of computationTue, 09 Dec 2008 17:24:04 -0700
Cite this page as followsStatistical Computations at FreeStatistics.org, Office for Research Development and Education, URL https://freestatistics.org/blog/index.php?v=date/2008/Dec/10/t1228868738v7l6mq5dkjc0d7l.htm/, Retrieved Sun, 19 May 2024 03:58:50 +0000
Statistical Computations at FreeStatistics.org, Office for Research Development and Education, URL https://freestatistics.org/blog/index.php?pk=31855, Retrieved Sun, 19 May 2024 03:58:50 +0000
QR Codes:

Original text written by user:
IsPrivate?No (this computation is public)
User-defined keywords
Estimated Impact198
Family? (F = Feedback message, R = changed R code, M = changed R Module, P = changed Parameters, D = changed Data)
F       [(Partial) Autocorrelation Function] [Step 2 ACF zonder...] [2008-12-10 00:24:04] [9f72e095d5529918bf5b0810c01bf6ce] [Current]
-    D    [(Partial) Autocorrelation Function] [PaperACF1Geoffrey] [2008-12-20 14:46:30] [a82d866a0ac8e48320d891f0b39cf617]
-   PD    [(Partial) Autocorrelation Function] [PaperACF2Geoffrey] [2008-12-20 14:59:43] [a82d866a0ac8e48320d891f0b39cf617]
Feedback Forum
2008-12-16 18:05:02 [Julian De Ruyter] [reply
Juiste berekening en conclusie

Post a new message
Dataseries X:
1.1372
1.1139
1.1222
1.1692
1.1702
1.2286
1.2613
1.2646
1.2262
1.1985
1.2007
1.2138
1.2266
1.2176
1.2218
1.249
1.2991
1.3408
1.3119
1.3014
1.3201
1.2938
1.2694
1.2165
1.2037
1.2292
1.2256
1.2015
1.1786
1.1856
1.2103
1.1938
1.202
1.2271
1.277
1.265
1.2684
1.2811
1.2727
1.2611
1.2881
1.3213
1.2999
1.3074
1.3242
1.3516
1.3511
1.3419
1.3716
1.3622
1.3896
1.4227
1.4684
1.457
1.4718
1.4748
1.5527
1.575
1.5557
1.5553
1.577


Summary of computational transaction
Raw Inputview raw input (R code)
Raw Outputview raw output of R engine
Computing time2 seconds
R Server'Sir Ronald Aylmer Fisher' @ 193.190.124.24

\begin{tabular}{lllllllll}
\hline
Summary of computational transaction \tabularnewline
Raw Input & view raw input (R code)  \tabularnewline
Raw Output & view raw output of R engine  \tabularnewline
Computing time & 2 seconds \tabularnewline
R Server & 'Sir Ronald Aylmer Fisher' @ 193.190.124.24 \tabularnewline
\hline
\end{tabular}
%Source: https://freestatistics.org/blog/index.php?pk=31855&T=0

[TABLE]
[ROW][C]Summary of computational transaction[/C][/ROW]
[ROW][C]Raw Input[/C][C]view raw input (R code) [/C][/ROW]
[ROW][C]Raw Output[/C][C]view raw output of R engine [/C][/ROW]
[ROW][C]Computing time[/C][C]2 seconds[/C][/ROW]
[ROW][C]R Server[/C][C]'Sir Ronald Aylmer Fisher' @ 193.190.124.24[/C][/ROW]
[/TABLE]
Source: https://freestatistics.org/blog/index.php?pk=31855&T=0

Globally Unique Identifier (entire table): ba.freestatistics.org/blog/index.php?pk=31855&T=0

As an alternative you can also use a QR Code:  

The GUIDs for individual cells are displayed in the table below:

Summary of computational transaction
Raw Inputview raw input (R code)
Raw Outputview raw output of R engine
Computing time2 seconds
R Server'Sir Ronald Aylmer Fisher' @ 193.190.124.24


Autocorrelation Function
Time lag kACF(k)T-STATP-value
10.9074397.08730
20.8038366.27820
30.7051155.50710
40.6100854.76496e-06
50.5107523.98919e-05
60.444183.46920.000482
70.3898713.0450.001716
80.3458272.7010.004469
90.2884822.25310.013929
100.2378361.85760.03403
110.1948681.5220.066593
120.1572891.22850.111995
130.1168010.91220.182615
140.0851240.66480.25433
150.0449560.35110.363355
160.004990.0390.484521
17-0.015333-0.11980.452535
18-0.019251-0.15040.440491
19-0.025645-0.20030.420959
20-0.044654-0.34880.364236
21-0.051337-0.4010.344928
22-0.0493-0.3850.350771
23-0.057546-0.44940.327351
24-0.081604-0.63740.263141
25-0.102811-0.8030.212553
26-0.112765-0.88070.190962
27-0.128865-1.00650.159083
28-0.136047-1.06260.146084
29-0.138195-1.07930.142344
30-0.133802-1.0450.150068
31-0.131237-1.0250.154708
32-0.129092-1.00820.158661
33-0.11938-0.93240.177407
34-0.102599-0.80130.213027
35-0.08559-0.66850.253176
36-0.078056-0.60960.272182
37-0.064329-0.50240.308588
38-0.052234-0.4080.342365
39-0.061457-0.480.316474
40-0.085564-0.66830.25324
41-0.122629-0.95780.170981
42-0.150683-1.17690.121909
43-0.185624-1.44980.076122
44-0.227686-1.77830.04017
45-0.251457-1.96390.027049
46-0.259926-2.03010.023358
47-0.262787-2.05240.022213
48-0.266282-2.07970.02088
49-0.265118-2.07060.021316
50-0.265033-2.070.021348
51-0.258213-2.01670.024067
52-0.249234-1.94660.028097
53-0.241445-1.88570.032046
54-0.252382-1.97120.026623
55-0.262074-2.04690.022493
56-0.258023-2.01520.024147
57-0.21691-1.69410.047672
58-0.172823-1.34980.091035
59-0.116246-0.90790.18375
60-0.056182-0.43880.331181

\begin{tabular}{lllllllll}
\hline
Autocorrelation Function \tabularnewline
Time lag k & ACF(k) & T-STAT & P-value \tabularnewline
1 & 0.907439 & 7.0873 & 0 \tabularnewline
2 & 0.803836 & 6.2782 & 0 \tabularnewline
3 & 0.705115 & 5.5071 & 0 \tabularnewline
4 & 0.610085 & 4.7649 & 6e-06 \tabularnewline
5 & 0.510752 & 3.9891 & 9e-05 \tabularnewline
6 & 0.44418 & 3.4692 & 0.000482 \tabularnewline
7 & 0.389871 & 3.045 & 0.001716 \tabularnewline
8 & 0.345827 & 2.701 & 0.004469 \tabularnewline
9 & 0.288482 & 2.2531 & 0.013929 \tabularnewline
10 & 0.237836 & 1.8576 & 0.03403 \tabularnewline
11 & 0.194868 & 1.522 & 0.066593 \tabularnewline
12 & 0.157289 & 1.2285 & 0.111995 \tabularnewline
13 & 0.116801 & 0.9122 & 0.182615 \tabularnewline
14 & 0.085124 & 0.6648 & 0.25433 \tabularnewline
15 & 0.044956 & 0.3511 & 0.363355 \tabularnewline
16 & 0.00499 & 0.039 & 0.484521 \tabularnewline
17 & -0.015333 & -0.1198 & 0.452535 \tabularnewline
18 & -0.019251 & -0.1504 & 0.440491 \tabularnewline
19 & -0.025645 & -0.2003 & 0.420959 \tabularnewline
20 & -0.044654 & -0.3488 & 0.364236 \tabularnewline
21 & -0.051337 & -0.401 & 0.344928 \tabularnewline
22 & -0.0493 & -0.385 & 0.350771 \tabularnewline
23 & -0.057546 & -0.4494 & 0.327351 \tabularnewline
24 & -0.081604 & -0.6374 & 0.263141 \tabularnewline
25 & -0.102811 & -0.803 & 0.212553 \tabularnewline
26 & -0.112765 & -0.8807 & 0.190962 \tabularnewline
27 & -0.128865 & -1.0065 & 0.159083 \tabularnewline
28 & -0.136047 & -1.0626 & 0.146084 \tabularnewline
29 & -0.138195 & -1.0793 & 0.142344 \tabularnewline
30 & -0.133802 & -1.045 & 0.150068 \tabularnewline
31 & -0.131237 & -1.025 & 0.154708 \tabularnewline
32 & -0.129092 & -1.0082 & 0.158661 \tabularnewline
33 & -0.11938 & -0.9324 & 0.177407 \tabularnewline
34 & -0.102599 & -0.8013 & 0.213027 \tabularnewline
35 & -0.08559 & -0.6685 & 0.253176 \tabularnewline
36 & -0.078056 & -0.6096 & 0.272182 \tabularnewline
37 & -0.064329 & -0.5024 & 0.308588 \tabularnewline
38 & -0.052234 & -0.408 & 0.342365 \tabularnewline
39 & -0.061457 & -0.48 & 0.316474 \tabularnewline
40 & -0.085564 & -0.6683 & 0.25324 \tabularnewline
41 & -0.122629 & -0.9578 & 0.170981 \tabularnewline
42 & -0.150683 & -1.1769 & 0.121909 \tabularnewline
43 & -0.185624 & -1.4498 & 0.076122 \tabularnewline
44 & -0.227686 & -1.7783 & 0.04017 \tabularnewline
45 & -0.251457 & -1.9639 & 0.027049 \tabularnewline
46 & -0.259926 & -2.0301 & 0.023358 \tabularnewline
47 & -0.262787 & -2.0524 & 0.022213 \tabularnewline
48 & -0.266282 & -2.0797 & 0.02088 \tabularnewline
49 & -0.265118 & -2.0706 & 0.021316 \tabularnewline
50 & -0.265033 & -2.07 & 0.021348 \tabularnewline
51 & -0.258213 & -2.0167 & 0.024067 \tabularnewline
52 & -0.249234 & -1.9466 & 0.028097 \tabularnewline
53 & -0.241445 & -1.8857 & 0.032046 \tabularnewline
54 & -0.252382 & -1.9712 & 0.026623 \tabularnewline
55 & -0.262074 & -2.0469 & 0.022493 \tabularnewline
56 & -0.258023 & -2.0152 & 0.024147 \tabularnewline
57 & -0.21691 & -1.6941 & 0.047672 \tabularnewline
58 & -0.172823 & -1.3498 & 0.091035 \tabularnewline
59 & -0.116246 & -0.9079 & 0.18375 \tabularnewline
60 & -0.056182 & -0.4388 & 0.331181 \tabularnewline
\hline
\end{tabular}
%Source: https://freestatistics.org/blog/index.php?pk=31855&T=1

[TABLE]
[ROW][C]Autocorrelation Function[/C][/ROW]
[ROW][C]Time lag k[/C][C]ACF(k)[/C][C]T-STAT[/C][C]P-value[/C][/ROW]
[ROW][C]1[/C][C]0.907439[/C][C]7.0873[/C][C]0[/C][/ROW]
[ROW][C]2[/C][C]0.803836[/C][C]6.2782[/C][C]0[/C][/ROW]
[ROW][C]3[/C][C]0.705115[/C][C]5.5071[/C][C]0[/C][/ROW]
[ROW][C]4[/C][C]0.610085[/C][C]4.7649[/C][C]6e-06[/C][/ROW]
[ROW][C]5[/C][C]0.510752[/C][C]3.9891[/C][C]9e-05[/C][/ROW]
[ROW][C]6[/C][C]0.44418[/C][C]3.4692[/C][C]0.000482[/C][/ROW]
[ROW][C]7[/C][C]0.389871[/C][C]3.045[/C][C]0.001716[/C][/ROW]
[ROW][C]8[/C][C]0.345827[/C][C]2.701[/C][C]0.004469[/C][/ROW]
[ROW][C]9[/C][C]0.288482[/C][C]2.2531[/C][C]0.013929[/C][/ROW]
[ROW][C]10[/C][C]0.237836[/C][C]1.8576[/C][C]0.03403[/C][/ROW]
[ROW][C]11[/C][C]0.194868[/C][C]1.522[/C][C]0.066593[/C][/ROW]
[ROW][C]12[/C][C]0.157289[/C][C]1.2285[/C][C]0.111995[/C][/ROW]
[ROW][C]13[/C][C]0.116801[/C][C]0.9122[/C][C]0.182615[/C][/ROW]
[ROW][C]14[/C][C]0.085124[/C][C]0.6648[/C][C]0.25433[/C][/ROW]
[ROW][C]15[/C][C]0.044956[/C][C]0.3511[/C][C]0.363355[/C][/ROW]
[ROW][C]16[/C][C]0.00499[/C][C]0.039[/C][C]0.484521[/C][/ROW]
[ROW][C]17[/C][C]-0.015333[/C][C]-0.1198[/C][C]0.452535[/C][/ROW]
[ROW][C]18[/C][C]-0.019251[/C][C]-0.1504[/C][C]0.440491[/C][/ROW]
[ROW][C]19[/C][C]-0.025645[/C][C]-0.2003[/C][C]0.420959[/C][/ROW]
[ROW][C]20[/C][C]-0.044654[/C][C]-0.3488[/C][C]0.364236[/C][/ROW]
[ROW][C]21[/C][C]-0.051337[/C][C]-0.401[/C][C]0.344928[/C][/ROW]
[ROW][C]22[/C][C]-0.0493[/C][C]-0.385[/C][C]0.350771[/C][/ROW]
[ROW][C]23[/C][C]-0.057546[/C][C]-0.4494[/C][C]0.327351[/C][/ROW]
[ROW][C]24[/C][C]-0.081604[/C][C]-0.6374[/C][C]0.263141[/C][/ROW]
[ROW][C]25[/C][C]-0.102811[/C][C]-0.803[/C][C]0.212553[/C][/ROW]
[ROW][C]26[/C][C]-0.112765[/C][C]-0.8807[/C][C]0.190962[/C][/ROW]
[ROW][C]27[/C][C]-0.128865[/C][C]-1.0065[/C][C]0.159083[/C][/ROW]
[ROW][C]28[/C][C]-0.136047[/C][C]-1.0626[/C][C]0.146084[/C][/ROW]
[ROW][C]29[/C][C]-0.138195[/C][C]-1.0793[/C][C]0.142344[/C][/ROW]
[ROW][C]30[/C][C]-0.133802[/C][C]-1.045[/C][C]0.150068[/C][/ROW]
[ROW][C]31[/C][C]-0.131237[/C][C]-1.025[/C][C]0.154708[/C][/ROW]
[ROW][C]32[/C][C]-0.129092[/C][C]-1.0082[/C][C]0.158661[/C][/ROW]
[ROW][C]33[/C][C]-0.11938[/C][C]-0.9324[/C][C]0.177407[/C][/ROW]
[ROW][C]34[/C][C]-0.102599[/C][C]-0.8013[/C][C]0.213027[/C][/ROW]
[ROW][C]35[/C][C]-0.08559[/C][C]-0.6685[/C][C]0.253176[/C][/ROW]
[ROW][C]36[/C][C]-0.078056[/C][C]-0.6096[/C][C]0.272182[/C][/ROW]
[ROW][C]37[/C][C]-0.064329[/C][C]-0.5024[/C][C]0.308588[/C][/ROW]
[ROW][C]38[/C][C]-0.052234[/C][C]-0.408[/C][C]0.342365[/C][/ROW]
[ROW][C]39[/C][C]-0.061457[/C][C]-0.48[/C][C]0.316474[/C][/ROW]
[ROW][C]40[/C][C]-0.085564[/C][C]-0.6683[/C][C]0.25324[/C][/ROW]
[ROW][C]41[/C][C]-0.122629[/C][C]-0.9578[/C][C]0.170981[/C][/ROW]
[ROW][C]42[/C][C]-0.150683[/C][C]-1.1769[/C][C]0.121909[/C][/ROW]
[ROW][C]43[/C][C]-0.185624[/C][C]-1.4498[/C][C]0.076122[/C][/ROW]
[ROW][C]44[/C][C]-0.227686[/C][C]-1.7783[/C][C]0.04017[/C][/ROW]
[ROW][C]45[/C][C]-0.251457[/C][C]-1.9639[/C][C]0.027049[/C][/ROW]
[ROW][C]46[/C][C]-0.259926[/C][C]-2.0301[/C][C]0.023358[/C][/ROW]
[ROW][C]47[/C][C]-0.262787[/C][C]-2.0524[/C][C]0.022213[/C][/ROW]
[ROW][C]48[/C][C]-0.266282[/C][C]-2.0797[/C][C]0.02088[/C][/ROW]
[ROW][C]49[/C][C]-0.265118[/C][C]-2.0706[/C][C]0.021316[/C][/ROW]
[ROW][C]50[/C][C]-0.265033[/C][C]-2.07[/C][C]0.021348[/C][/ROW]
[ROW][C]51[/C][C]-0.258213[/C][C]-2.0167[/C][C]0.024067[/C][/ROW]
[ROW][C]52[/C][C]-0.249234[/C][C]-1.9466[/C][C]0.028097[/C][/ROW]
[ROW][C]53[/C][C]-0.241445[/C][C]-1.8857[/C][C]0.032046[/C][/ROW]
[ROW][C]54[/C][C]-0.252382[/C][C]-1.9712[/C][C]0.026623[/C][/ROW]
[ROW][C]55[/C][C]-0.262074[/C][C]-2.0469[/C][C]0.022493[/C][/ROW]
[ROW][C]56[/C][C]-0.258023[/C][C]-2.0152[/C][C]0.024147[/C][/ROW]
[ROW][C]57[/C][C]-0.21691[/C][C]-1.6941[/C][C]0.047672[/C][/ROW]
[ROW][C]58[/C][C]-0.172823[/C][C]-1.3498[/C][C]0.091035[/C][/ROW]
[ROW][C]59[/C][C]-0.116246[/C][C]-0.9079[/C][C]0.18375[/C][/ROW]
[ROW][C]60[/C][C]-0.056182[/C][C]-0.4388[/C][C]0.331181[/C][/ROW]
[/TABLE]
Source: https://freestatistics.org/blog/index.php?pk=31855&T=1

Globally Unique Identifier (entire table): ba.freestatistics.org/blog/index.php?pk=31855&T=1

As an alternative you can also use a QR Code:  

The GUIDs for individual cells are displayed in the table below:

Autocorrelation Function
Time lag kACF(k)T-STATP-value
10.9074397.08730
20.8038366.27820
30.7051155.50710
40.6100854.76496e-06
50.5107523.98919e-05
60.444183.46920.000482
70.3898713.0450.001716
80.3458272.7010.004469
90.2884822.25310.013929
100.2378361.85760.03403
110.1948681.5220.066593
120.1572891.22850.111995
130.1168010.91220.182615
140.0851240.66480.25433
150.0449560.35110.363355
160.004990.0390.484521
17-0.015333-0.11980.452535
18-0.019251-0.15040.440491
19-0.025645-0.20030.420959
20-0.044654-0.34880.364236
21-0.051337-0.4010.344928
22-0.0493-0.3850.350771
23-0.057546-0.44940.327351
24-0.081604-0.63740.263141
25-0.102811-0.8030.212553
26-0.112765-0.88070.190962
27-0.128865-1.00650.159083
28-0.136047-1.06260.146084
29-0.138195-1.07930.142344
30-0.133802-1.0450.150068
31-0.131237-1.0250.154708
32-0.129092-1.00820.158661
33-0.11938-0.93240.177407
34-0.102599-0.80130.213027
35-0.08559-0.66850.253176
36-0.078056-0.60960.272182
37-0.064329-0.50240.308588
38-0.052234-0.4080.342365
39-0.061457-0.480.316474
40-0.085564-0.66830.25324
41-0.122629-0.95780.170981
42-0.150683-1.17690.121909
43-0.185624-1.44980.076122
44-0.227686-1.77830.04017
45-0.251457-1.96390.027049
46-0.259926-2.03010.023358
47-0.262787-2.05240.022213
48-0.266282-2.07970.02088
49-0.265118-2.07060.021316
50-0.265033-2.070.021348
51-0.258213-2.01670.024067
52-0.249234-1.94660.028097
53-0.241445-1.88570.032046
54-0.252382-1.97120.026623
55-0.262074-2.04690.022493
56-0.258023-2.01520.024147
57-0.21691-1.69410.047672
58-0.172823-1.34980.091035
59-0.116246-0.90790.18375
60-0.056182-0.43880.331181


Partial Autocorrelation Function
Time lag kPACF(k)T-STATP-value
10.9074397.08730
2-0.111071-0.86750.194536
3-0.026074-0.20360.419656
4-0.040047-0.31280.377758
5-0.085287-0.66610.253926
60.1277980.99810.161078
7-0.00164-0.01280.49491
80.0170230.1330.447335
9-0.114826-0.89680.186671
10-0.006913-0.0540.478559
110.0200140.15630.438151
12-0.002302-0.0180.492859
13-0.029477-0.23020.409346
14-0.009827-0.07670.469537
15-0.089267-0.69720.244163
16-0.024488-0.19130.42448
170.0967260.75550.226443
180.048470.37860.353163
19-0.031671-0.24740.40273
20-0.115491-0.9020.1853
210.049570.38720.349996
220.0462890.36150.359477
23-0.031021-0.24230.404686
24-0.092804-0.72480.235666
25-0.056306-0.43980.330831
260.0378710.29580.3842
27-0.026207-0.20470.419251
280.0650950.50840.306501
29-0.039741-0.31040.378663
30-0.011951-0.09330.46297
31-0.018756-0.14650.442009
32-0.003809-0.02970.488182
330.0703820.54970.292267
340.0366450.28620.387845
35-0.00045-0.00350.498604
36-0.103321-0.8070.211411
370.0509680.39810.345983
380.0397860.31070.37853
39-0.093966-0.73390.232911
40-0.134029-1.04680.149661
41-0.149021-1.16390.1245
420.0686710.53630.296837
43-0.038695-0.30220.381757
44-0.092401-0.72170.236627
450.0079550.06210.475331
460.0054120.04230.483211
470.029480.23020.409335
48-0.028856-0.22540.411222
49-0.006512-0.05090.479801
50-0.024163-0.18870.425471
510.0239550.18710.426104
52-0.018065-0.14110.444131
53-0.011617-0.09070.464001
54-0.124215-0.97020.167901
55-0.016215-0.12660.449821
560.0063310.04940.480362
570.2029911.58540.059022
580.0753170.58820.27927
590.0323450.25260.400704
60-0.036995-0.28890.386804

\begin{tabular}{lllllllll}
\hline
Partial Autocorrelation Function \tabularnewline
Time lag k & PACF(k) & T-STAT & P-value \tabularnewline
1 & 0.907439 & 7.0873 & 0 \tabularnewline
2 & -0.111071 & -0.8675 & 0.194536 \tabularnewline
3 & -0.026074 & -0.2036 & 0.419656 \tabularnewline
4 & -0.040047 & -0.3128 & 0.377758 \tabularnewline
5 & -0.085287 & -0.6661 & 0.253926 \tabularnewline
6 & 0.127798 & 0.9981 & 0.161078 \tabularnewline
7 & -0.00164 & -0.0128 & 0.49491 \tabularnewline
8 & 0.017023 & 0.133 & 0.447335 \tabularnewline
9 & -0.114826 & -0.8968 & 0.186671 \tabularnewline
10 & -0.006913 & -0.054 & 0.478559 \tabularnewline
11 & 0.020014 & 0.1563 & 0.438151 \tabularnewline
12 & -0.002302 & -0.018 & 0.492859 \tabularnewline
13 & -0.029477 & -0.2302 & 0.409346 \tabularnewline
14 & -0.009827 & -0.0767 & 0.469537 \tabularnewline
15 & -0.089267 & -0.6972 & 0.244163 \tabularnewline
16 & -0.024488 & -0.1913 & 0.42448 \tabularnewline
17 & 0.096726 & 0.7555 & 0.226443 \tabularnewline
18 & 0.04847 & 0.3786 & 0.353163 \tabularnewline
19 & -0.031671 & -0.2474 & 0.40273 \tabularnewline
20 & -0.115491 & -0.902 & 0.1853 \tabularnewline
21 & 0.04957 & 0.3872 & 0.349996 \tabularnewline
22 & 0.046289 & 0.3615 & 0.359477 \tabularnewline
23 & -0.031021 & -0.2423 & 0.404686 \tabularnewline
24 & -0.092804 & -0.7248 & 0.235666 \tabularnewline
25 & -0.056306 & -0.4398 & 0.330831 \tabularnewline
26 & 0.037871 & 0.2958 & 0.3842 \tabularnewline
27 & -0.026207 & -0.2047 & 0.419251 \tabularnewline
28 & 0.065095 & 0.5084 & 0.306501 \tabularnewline
29 & -0.039741 & -0.3104 & 0.378663 \tabularnewline
30 & -0.011951 & -0.0933 & 0.46297 \tabularnewline
31 & -0.018756 & -0.1465 & 0.442009 \tabularnewline
32 & -0.003809 & -0.0297 & 0.488182 \tabularnewline
33 & 0.070382 & 0.5497 & 0.292267 \tabularnewline
34 & 0.036645 & 0.2862 & 0.387845 \tabularnewline
35 & -0.00045 & -0.0035 & 0.498604 \tabularnewline
36 & -0.103321 & -0.807 & 0.211411 \tabularnewline
37 & 0.050968 & 0.3981 & 0.345983 \tabularnewline
38 & 0.039786 & 0.3107 & 0.37853 \tabularnewline
39 & -0.093966 & -0.7339 & 0.232911 \tabularnewline
40 & -0.134029 & -1.0468 & 0.149661 \tabularnewline
41 & -0.149021 & -1.1639 & 0.1245 \tabularnewline
42 & 0.068671 & 0.5363 & 0.296837 \tabularnewline
43 & -0.038695 & -0.3022 & 0.381757 \tabularnewline
44 & -0.092401 & -0.7217 & 0.236627 \tabularnewline
45 & 0.007955 & 0.0621 & 0.475331 \tabularnewline
46 & 0.005412 & 0.0423 & 0.483211 \tabularnewline
47 & 0.02948 & 0.2302 & 0.409335 \tabularnewline
48 & -0.028856 & -0.2254 & 0.411222 \tabularnewline
49 & -0.006512 & -0.0509 & 0.479801 \tabularnewline
50 & -0.024163 & -0.1887 & 0.425471 \tabularnewline
51 & 0.023955 & 0.1871 & 0.426104 \tabularnewline
52 & -0.018065 & -0.1411 & 0.444131 \tabularnewline
53 & -0.011617 & -0.0907 & 0.464001 \tabularnewline
54 & -0.124215 & -0.9702 & 0.167901 \tabularnewline
55 & -0.016215 & -0.1266 & 0.449821 \tabularnewline
56 & 0.006331 & 0.0494 & 0.480362 \tabularnewline
57 & 0.202991 & 1.5854 & 0.059022 \tabularnewline
58 & 0.075317 & 0.5882 & 0.27927 \tabularnewline
59 & 0.032345 & 0.2526 & 0.400704 \tabularnewline
60 & -0.036995 & -0.2889 & 0.386804 \tabularnewline
\hline
\end{tabular}
%Source: https://freestatistics.org/blog/index.php?pk=31855&T=2

[TABLE]
[ROW][C]Partial Autocorrelation Function[/C][/ROW]
[ROW][C]Time lag k[/C][C]PACF(k)[/C][C]T-STAT[/C][C]P-value[/C][/ROW]
[ROW][C]1[/C][C]0.907439[/C][C]7.0873[/C][C]0[/C][/ROW]
[ROW][C]2[/C][C]-0.111071[/C][C]-0.8675[/C][C]0.194536[/C][/ROW]
[ROW][C]3[/C][C]-0.026074[/C][C]-0.2036[/C][C]0.419656[/C][/ROW]
[ROW][C]4[/C][C]-0.040047[/C][C]-0.3128[/C][C]0.377758[/C][/ROW]
[ROW][C]5[/C][C]-0.085287[/C][C]-0.6661[/C][C]0.253926[/C][/ROW]
[ROW][C]6[/C][C]0.127798[/C][C]0.9981[/C][C]0.161078[/C][/ROW]
[ROW][C]7[/C][C]-0.00164[/C][C]-0.0128[/C][C]0.49491[/C][/ROW]
[ROW][C]8[/C][C]0.017023[/C][C]0.133[/C][C]0.447335[/C][/ROW]
[ROW][C]9[/C][C]-0.114826[/C][C]-0.8968[/C][C]0.186671[/C][/ROW]
[ROW][C]10[/C][C]-0.006913[/C][C]-0.054[/C][C]0.478559[/C][/ROW]
[ROW][C]11[/C][C]0.020014[/C][C]0.1563[/C][C]0.438151[/C][/ROW]
[ROW][C]12[/C][C]-0.002302[/C][C]-0.018[/C][C]0.492859[/C][/ROW]
[ROW][C]13[/C][C]-0.029477[/C][C]-0.2302[/C][C]0.409346[/C][/ROW]
[ROW][C]14[/C][C]-0.009827[/C][C]-0.0767[/C][C]0.469537[/C][/ROW]
[ROW][C]15[/C][C]-0.089267[/C][C]-0.6972[/C][C]0.244163[/C][/ROW]
[ROW][C]16[/C][C]-0.024488[/C][C]-0.1913[/C][C]0.42448[/C][/ROW]
[ROW][C]17[/C][C]0.096726[/C][C]0.7555[/C][C]0.226443[/C][/ROW]
[ROW][C]18[/C][C]0.04847[/C][C]0.3786[/C][C]0.353163[/C][/ROW]
[ROW][C]19[/C][C]-0.031671[/C][C]-0.2474[/C][C]0.40273[/C][/ROW]
[ROW][C]20[/C][C]-0.115491[/C][C]-0.902[/C][C]0.1853[/C][/ROW]
[ROW][C]21[/C][C]0.04957[/C][C]0.3872[/C][C]0.349996[/C][/ROW]
[ROW][C]22[/C][C]0.046289[/C][C]0.3615[/C][C]0.359477[/C][/ROW]
[ROW][C]23[/C][C]-0.031021[/C][C]-0.2423[/C][C]0.404686[/C][/ROW]
[ROW][C]24[/C][C]-0.092804[/C][C]-0.7248[/C][C]0.235666[/C][/ROW]
[ROW][C]25[/C][C]-0.056306[/C][C]-0.4398[/C][C]0.330831[/C][/ROW]
[ROW][C]26[/C][C]0.037871[/C][C]0.2958[/C][C]0.3842[/C][/ROW]
[ROW][C]27[/C][C]-0.026207[/C][C]-0.2047[/C][C]0.419251[/C][/ROW]
[ROW][C]28[/C][C]0.065095[/C][C]0.5084[/C][C]0.306501[/C][/ROW]
[ROW][C]29[/C][C]-0.039741[/C][C]-0.3104[/C][C]0.378663[/C][/ROW]
[ROW][C]30[/C][C]-0.011951[/C][C]-0.0933[/C][C]0.46297[/C][/ROW]
[ROW][C]31[/C][C]-0.018756[/C][C]-0.1465[/C][C]0.442009[/C][/ROW]
[ROW][C]32[/C][C]-0.003809[/C][C]-0.0297[/C][C]0.488182[/C][/ROW]
[ROW][C]33[/C][C]0.070382[/C][C]0.5497[/C][C]0.292267[/C][/ROW]
[ROW][C]34[/C][C]0.036645[/C][C]0.2862[/C][C]0.387845[/C][/ROW]
[ROW][C]35[/C][C]-0.00045[/C][C]-0.0035[/C][C]0.498604[/C][/ROW]
[ROW][C]36[/C][C]-0.103321[/C][C]-0.807[/C][C]0.211411[/C][/ROW]
[ROW][C]37[/C][C]0.050968[/C][C]0.3981[/C][C]0.345983[/C][/ROW]
[ROW][C]38[/C][C]0.039786[/C][C]0.3107[/C][C]0.37853[/C][/ROW]
[ROW][C]39[/C][C]-0.093966[/C][C]-0.7339[/C][C]0.232911[/C][/ROW]
[ROW][C]40[/C][C]-0.134029[/C][C]-1.0468[/C][C]0.149661[/C][/ROW]
[ROW][C]41[/C][C]-0.149021[/C][C]-1.1639[/C][C]0.1245[/C][/ROW]
[ROW][C]42[/C][C]0.068671[/C][C]0.5363[/C][C]0.296837[/C][/ROW]
[ROW][C]43[/C][C]-0.038695[/C][C]-0.3022[/C][C]0.381757[/C][/ROW]
[ROW][C]44[/C][C]-0.092401[/C][C]-0.7217[/C][C]0.236627[/C][/ROW]
[ROW][C]45[/C][C]0.007955[/C][C]0.0621[/C][C]0.475331[/C][/ROW]
[ROW][C]46[/C][C]0.005412[/C][C]0.0423[/C][C]0.483211[/C][/ROW]
[ROW][C]47[/C][C]0.02948[/C][C]0.2302[/C][C]0.409335[/C][/ROW]
[ROW][C]48[/C][C]-0.028856[/C][C]-0.2254[/C][C]0.411222[/C][/ROW]
[ROW][C]49[/C][C]-0.006512[/C][C]-0.0509[/C][C]0.479801[/C][/ROW]
[ROW][C]50[/C][C]-0.024163[/C][C]-0.1887[/C][C]0.425471[/C][/ROW]
[ROW][C]51[/C][C]0.023955[/C][C]0.1871[/C][C]0.426104[/C][/ROW]
[ROW][C]52[/C][C]-0.018065[/C][C]-0.1411[/C][C]0.444131[/C][/ROW]
[ROW][C]53[/C][C]-0.011617[/C][C]-0.0907[/C][C]0.464001[/C][/ROW]
[ROW][C]54[/C][C]-0.124215[/C][C]-0.9702[/C][C]0.167901[/C][/ROW]
[ROW][C]55[/C][C]-0.016215[/C][C]-0.1266[/C][C]0.449821[/C][/ROW]
[ROW][C]56[/C][C]0.006331[/C][C]0.0494[/C][C]0.480362[/C][/ROW]
[ROW][C]57[/C][C]0.202991[/C][C]1.5854[/C][C]0.059022[/C][/ROW]
[ROW][C]58[/C][C]0.075317[/C][C]0.5882[/C][C]0.27927[/C][/ROW]
[ROW][C]59[/C][C]0.032345[/C][C]0.2526[/C][C]0.400704[/C][/ROW]
[ROW][C]60[/C][C]-0.036995[/C][C]-0.2889[/C][C]0.386804[/C][/ROW]
[/TABLE]
Source: https://freestatistics.org/blog/index.php?pk=31855&T=2

Globally Unique Identifier (entire table): ba.freestatistics.org/blog/index.php?pk=31855&T=2

As an alternative you can also use a QR Code:  

The GUIDs for individual cells are displayed in the table below:

Partial Autocorrelation Function
Time lag kPACF(k)T-STATP-value
10.9074397.08730
2-0.111071-0.86750.194536
3-0.026074-0.20360.419656
4-0.040047-0.31280.377758
5-0.085287-0.66610.253926
60.1277980.99810.161078
7-0.00164-0.01280.49491
80.0170230.1330.447335
9-0.114826-0.89680.186671
10-0.006913-0.0540.478559
110.0200140.15630.438151
12-0.002302-0.0180.492859
13-0.029477-0.23020.409346
14-0.009827-0.07670.469537
15-0.089267-0.69720.244163
16-0.024488-0.19130.42448
170.0967260.75550.226443
180.048470.37860.353163
19-0.031671-0.24740.40273
20-0.115491-0.9020.1853
210.049570.38720.349996
220.0462890.36150.359477
23-0.031021-0.24230.404686
24-0.092804-0.72480.235666
25-0.056306-0.43980.330831
260.0378710.29580.3842
27-0.026207-0.20470.419251
280.0650950.50840.306501
29-0.039741-0.31040.378663
30-0.011951-0.09330.46297
31-0.018756-0.14650.442009
32-0.003809-0.02970.488182
330.0703820.54970.292267
340.0366450.28620.387845
35-0.00045-0.00350.498604
36-0.103321-0.8070.211411
370.0509680.39810.345983
380.0397860.31070.37853
39-0.093966-0.73390.232911
40-0.134029-1.04680.149661
41-0.149021-1.16390.1245
420.0686710.53630.296837
43-0.038695-0.30220.381757
44-0.092401-0.72170.236627
450.0079550.06210.475331
460.0054120.04230.483211
470.029480.23020.409335
48-0.028856-0.22540.411222
49-0.006512-0.05090.479801
50-0.024163-0.18870.425471
510.0239550.18710.426104
52-0.018065-0.14110.444131
53-0.011617-0.09070.464001
54-0.124215-0.97020.167901
55-0.016215-0.12660.449821
560.0063310.04940.480362
570.2029911.58540.059022
580.0753170.58820.27927
590.0323450.25260.400704
60-0.036995-0.28890.386804


Parameters (Session):
par1 = 60 ; par2 = 1 ; par3 = 0 ; par4 = 0 ; par5 = 12 ;
Parameters (R input):
par1 = 60 ; par2 = 1 ; par3 = 0 ; par4 = 0 ; par5 = 12 ;
R code (references can be found in the software module):
if (par1 == 'Default') {
par1 = 10*log10(length(x))
} else {
par1 <- as.numeric(par1)
}
par2 <- as.numeric(par2)
par3 <- as.numeric(par3)
par4 <- as.numeric(par4)
par5 <- as.numeric(par5)
if (par2 == 0) {
x <- log(x)
} else {
x <- (x ^ par2 - 1) / par2
}
if (par3 > 0) x <- diff(x,lag=1,difference=par3)
if (par4 > 0) x <- diff(x,lag=par5,difference=par4)
bitmap(file='pic1.png')
racf <- acf(x,par1,main='Autocorrelation',xlab='lags',ylab='ACF')
dev.off()
bitmap(file='pic2.png')
rpacf <- pacf(x,par1,main='Partial Autocorrelation',xlab='lags',ylab='PACF')
dev.off()
(myacf <- c(racf$acf))
(mypacf <- c(rpacf$acf))
lengthx <- length(x)
sqrtn <- sqrt(lengthx)
load(file='createtable')
a<-table.start()
a<-table.row.start(a)
a<-table.element(a,'Autocorrelation Function',4,TRUE)
a<-table.row.end(a)
a<-table.row.start(a)
a<-table.element(a,'Time lag k',header=TRUE)
a<-table.element(a,hyperlink('basics.htm','ACF(k)','click here for more information about the Autocorrelation Function'),header=TRUE)
a<-table.element(a,'T-STAT',header=TRUE)
a<-table.element(a,'P-value',header=TRUE)
a<-table.row.end(a)
for (i in 2:(par1+1)) {
a<-table.row.start(a)
a<-table.element(a,i-1,header=TRUE)
a<-table.element(a,round(myacf[i],6))
mytstat <- myacf[i]*sqrtn
a<-table.element(a,round(mytstat,4))
a<-table.element(a,round(1-pt(abs(mytstat),lengthx),6))
a<-table.row.end(a)
}
a<-table.end(a)
table.save(a,file='mytable.tab')
a<-table.start()
a<-table.row.start(a)
a<-table.element(a,'Partial Autocorrelation Function',4,TRUE)
a<-table.row.end(a)
a<-table.row.start(a)
a<-table.element(a,'Time lag k',header=TRUE)
a<-table.element(a,hyperlink('basics.htm','PACF(k)','click here for more information about the Partial Autocorrelation Function'),header=TRUE)
a<-table.element(a,'T-STAT',header=TRUE)
a<-table.element(a,'P-value',header=TRUE)
a<-table.row.end(a)
for (i in 1:par1) {
a<-table.row.start(a)
a<-table.element(a,i,header=TRUE)
a<-table.element(a,round(mypacf[i],6))
mytstat <- mypacf[i]*sqrtn
a<-table.element(a,round(mytstat,4))
a<-table.element(a,round(1-pt(abs(mytstat),lengthx),6))
a<-table.row.end(a)
}
a<-table.end(a)
table.save(a,file='mytable1.tab')