Free Statistics

of Irreproducible Research!

Author's title

Author*Unverified author*
R Software Modulerwasp_autocorrelation.wasp
Title produced by software(Partial) Autocorrelation Function
Date of computationTue, 09 Dec 2008 15:10:33 -0700
Cite this page as followsStatistical Computations at FreeStatistics.org, Office for Research Development and Education, URL https://freestatistics.org/blog/index.php?v=date/2008/Dec/09/t12288607554iuzrr2ahewqcjo.htm/, Retrieved Sun, 19 May 2024 11:39:46 +0000
Statistical Computations at FreeStatistics.org, Office for Research Development and Education, URL https://freestatistics.org/blog/index.php?pk=31828, Retrieved Sun, 19 May 2024 11:39:46 +0000
QR Codes:

Original text written by user:
IsPrivate?No (this computation is public)
User-defined keywords
Estimated Impact154
Family? (F = Feedback message, R = changed R code, M = changed R Module, P = changed Parameters, D = changed Data)
-     [Univariate Data Series] [data set] [2008-12-01 19:54:57] [b98453cac15ba1066b407e146608df68]
F RMPD    [(Partial) Autocorrelation Function] [Identification an...] [2008-12-09 22:10:33] [74a138e5b32af267311b5ad4cd13bf7e] [Current]
Feedback Forum
2008-12-14 14:49:25 [Gert-Jan Geudens] [reply
Niet correct. Je moet hier enkel lineair differentiëren.
  2008-12-17 00:13:30 [Gert-Jan Geudens] [reply
Foutje in de vorige feedback. Je moet inderdaad ook seizonaal differentiëren.
2008-12-15 14:26:43 [Stefan Temmerman] [reply
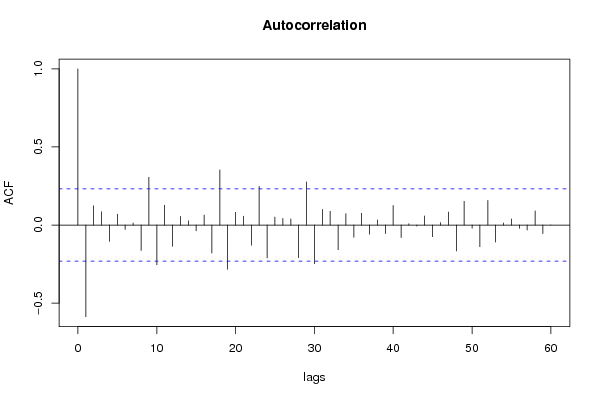
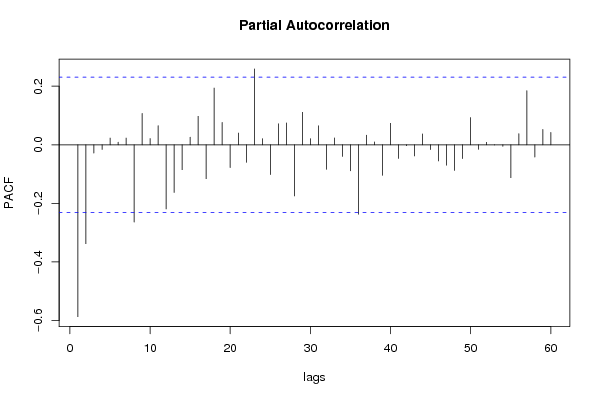
De differentiatie is correct uitgevoerd: de trend is weg en zo ook de seizoenaliteit.

Post a new message
Dataseries X:
93.7
105.7
109.5
105.3
102.8
100.6
97.6
110.3
107.2
107.2
108.1
97.1
92.2
112.2
111.6
115.7
111.3
104.2
103.2
112.7
106.4
102.6
110.6
95.2
89
112.5
116.8
107.2
113.6
101.8
102.6
122.7
110.3
110.5
121.6
100.3
100.7
123.4
127.1
124.1
131.2
111.6
114.2
130.1
125.9
119
133.8
107.5
113.5
134.4
126.8
135.6
139.9
129.8
131
153.1
134.1
144.1
155.9
123.3
128.1
144.3
153
149.9
150.9
141
138.9
157.4
142.9
151.7
161
138.5
135.9
151.5
164
159.1
157
142.1
144.8
152.1
154.6
148.7
157.7
146.4
136.5


Summary of computational transaction
Raw Inputview raw input (R code)
Raw Outputview raw output of R engine
Computing time1 seconds
R Server'Gwilym Jenkins' @ 72.249.127.135

\begin{tabular}{lllllllll}
\hline
Summary of computational transaction \tabularnewline
Raw Input & view raw input (R code)  \tabularnewline
Raw Output & view raw output of R engine  \tabularnewline
Computing time & 1 seconds \tabularnewline
R Server & 'Gwilym Jenkins' @ 72.249.127.135 \tabularnewline
\hline
\end{tabular}
%Source: https://freestatistics.org/blog/index.php?pk=31828&T=0

[TABLE]
[ROW][C]Summary of computational transaction[/C][/ROW]
[ROW][C]Raw Input[/C][C]view raw input (R code) [/C][/ROW]
[ROW][C]Raw Output[/C][C]view raw output of R engine [/C][/ROW]
[ROW][C]Computing time[/C][C]1 seconds[/C][/ROW]
[ROW][C]R Server[/C][C]'Gwilym Jenkins' @ 72.249.127.135[/C][/ROW]
[/TABLE]
Source: https://freestatistics.org/blog/index.php?pk=31828&T=0

Globally Unique Identifier (entire table): ba.freestatistics.org/blog/index.php?pk=31828&T=0

As an alternative you can also use a QR Code:  

The GUIDs for individual cells are displayed in the table below:

Summary of computational transaction
Raw Inputview raw input (R code)
Raw Outputview raw output of R engine
Computing time1 seconds
R Server'Gwilym Jenkins' @ 72.249.127.135


Autocorrelation Function
Time lag kACF(k)T-STATP-value
1-0.587013-4.9812e-06
20.1232181.04550.149635
30.0850570.72170.236398
4-0.10461-0.88760.188843
50.0697420.59180.277925
6-0.02813-0.23870.406013
70.0126490.10730.457414
8-0.162615-1.37980.085955
90.3056412.59350.005751
10-0.255096-2.16460.016869
110.1272761.080.14188
12-0.136107-1.15490.125974
130.0553040.46930.320146
140.0267690.22710.410478
15-0.037284-0.31640.37632
160.0640890.54380.294125
17-0.179262-1.52110.066309
180.3532152.99710.001869
19-0.283513-2.40570.009356
200.0813640.69040.246082
210.0566240.48050.316175
22-0.128793-1.09280.139052
230.2470062.09590.019803
24-0.210842-1.78910.038906
250.0509950.43270.333262
260.0422720.35870.360439
270.0389060.33010.371131
28-0.209123-1.77450.040106
290.2757612.33990.011032
30-0.247991-2.10430.019423
310.0998710.84740.199781
320.0880120.74680.228807
33-0.157605-1.33730.092663
340.0723110.61360.270713
35-0.078899-0.66950.252666
360.0758920.6440.260824
37-0.05835-0.49510.311011
380.0322670.27380.392512
39-0.054482-0.46230.322631
400.1259131.06840.144452
41-0.080648-0.68430.247985
420.0084150.07140.471638
43-0.00638-0.05410.47849
440.0582590.49430.311286
45-0.074551-0.63260.264505
460.0155890.13230.447566
470.0828630.70310.242126
48-0.165744-1.40640.081955
490.1517511.28760.100996
50-0.020642-0.17520.430725
51-0.138683-1.17680.121583
520.1575081.33650.092798
53-0.108967-0.92460.179127
540.0131460.11150.455747
550.0394250.33450.369476
56-0.021305-0.18080.428523
57-0.032301-0.27410.392402
580.0903210.76640.222973
59-0.05463-0.46360.322183
60-0.00022-0.00190.499257

\begin{tabular}{lllllllll}
\hline
Autocorrelation Function \tabularnewline
Time lag k & ACF(k) & T-STAT & P-value \tabularnewline
1 & -0.587013 & -4.981 & 2e-06 \tabularnewline
2 & 0.123218 & 1.0455 & 0.149635 \tabularnewline
3 & 0.085057 & 0.7217 & 0.236398 \tabularnewline
4 & -0.10461 & -0.8876 & 0.188843 \tabularnewline
5 & 0.069742 & 0.5918 & 0.277925 \tabularnewline
6 & -0.02813 & -0.2387 & 0.406013 \tabularnewline
7 & 0.012649 & 0.1073 & 0.457414 \tabularnewline
8 & -0.162615 & -1.3798 & 0.085955 \tabularnewline
9 & 0.305641 & 2.5935 & 0.005751 \tabularnewline
10 & -0.255096 & -2.1646 & 0.016869 \tabularnewline
11 & 0.127276 & 1.08 & 0.14188 \tabularnewline
12 & -0.136107 & -1.1549 & 0.125974 \tabularnewline
13 & 0.055304 & 0.4693 & 0.320146 \tabularnewline
14 & 0.026769 & 0.2271 & 0.410478 \tabularnewline
15 & -0.037284 & -0.3164 & 0.37632 \tabularnewline
16 & 0.064089 & 0.5438 & 0.294125 \tabularnewline
17 & -0.179262 & -1.5211 & 0.066309 \tabularnewline
18 & 0.353215 & 2.9971 & 0.001869 \tabularnewline
19 & -0.283513 & -2.4057 & 0.009356 \tabularnewline
20 & 0.081364 & 0.6904 & 0.246082 \tabularnewline
21 & 0.056624 & 0.4805 & 0.316175 \tabularnewline
22 & -0.128793 & -1.0928 & 0.139052 \tabularnewline
23 & 0.247006 & 2.0959 & 0.019803 \tabularnewline
24 & -0.210842 & -1.7891 & 0.038906 \tabularnewline
25 & 0.050995 & 0.4327 & 0.333262 \tabularnewline
26 & 0.042272 & 0.3587 & 0.360439 \tabularnewline
27 & 0.038906 & 0.3301 & 0.371131 \tabularnewline
28 & -0.209123 & -1.7745 & 0.040106 \tabularnewline
29 & 0.275761 & 2.3399 & 0.011032 \tabularnewline
30 & -0.247991 & -2.1043 & 0.019423 \tabularnewline
31 & 0.099871 & 0.8474 & 0.199781 \tabularnewline
32 & 0.088012 & 0.7468 & 0.228807 \tabularnewline
33 & -0.157605 & -1.3373 & 0.092663 \tabularnewline
34 & 0.072311 & 0.6136 & 0.270713 \tabularnewline
35 & -0.078899 & -0.6695 & 0.252666 \tabularnewline
36 & 0.075892 & 0.644 & 0.260824 \tabularnewline
37 & -0.05835 & -0.4951 & 0.311011 \tabularnewline
38 & 0.032267 & 0.2738 & 0.392512 \tabularnewline
39 & -0.054482 & -0.4623 & 0.322631 \tabularnewline
40 & 0.125913 & 1.0684 & 0.144452 \tabularnewline
41 & -0.080648 & -0.6843 & 0.247985 \tabularnewline
42 & 0.008415 & 0.0714 & 0.471638 \tabularnewline
43 & -0.00638 & -0.0541 & 0.47849 \tabularnewline
44 & 0.058259 & 0.4943 & 0.311286 \tabularnewline
45 & -0.074551 & -0.6326 & 0.264505 \tabularnewline
46 & 0.015589 & 0.1323 & 0.447566 \tabularnewline
47 & 0.082863 & 0.7031 & 0.242126 \tabularnewline
48 & -0.165744 & -1.4064 & 0.081955 \tabularnewline
49 & 0.151751 & 1.2876 & 0.100996 \tabularnewline
50 & -0.020642 & -0.1752 & 0.430725 \tabularnewline
51 & -0.138683 & -1.1768 & 0.121583 \tabularnewline
52 & 0.157508 & 1.3365 & 0.092798 \tabularnewline
53 & -0.108967 & -0.9246 & 0.179127 \tabularnewline
54 & 0.013146 & 0.1115 & 0.455747 \tabularnewline
55 & 0.039425 & 0.3345 & 0.369476 \tabularnewline
56 & -0.021305 & -0.1808 & 0.428523 \tabularnewline
57 & -0.032301 & -0.2741 & 0.392402 \tabularnewline
58 & 0.090321 & 0.7664 & 0.222973 \tabularnewline
59 & -0.05463 & -0.4636 & 0.322183 \tabularnewline
60 & -0.00022 & -0.0019 & 0.499257 \tabularnewline
\hline
\end{tabular}
%Source: https://freestatistics.org/blog/index.php?pk=31828&T=1

[TABLE]
[ROW][C]Autocorrelation Function[/C][/ROW]
[ROW][C]Time lag k[/C][C]ACF(k)[/C][C]T-STAT[/C][C]P-value[/C][/ROW]
[ROW][C]1[/C][C]-0.587013[/C][C]-4.981[/C][C]2e-06[/C][/ROW]
[ROW][C]2[/C][C]0.123218[/C][C]1.0455[/C][C]0.149635[/C][/ROW]
[ROW][C]3[/C][C]0.085057[/C][C]0.7217[/C][C]0.236398[/C][/ROW]
[ROW][C]4[/C][C]-0.10461[/C][C]-0.8876[/C][C]0.188843[/C][/ROW]
[ROW][C]5[/C][C]0.069742[/C][C]0.5918[/C][C]0.277925[/C][/ROW]
[ROW][C]6[/C][C]-0.02813[/C][C]-0.2387[/C][C]0.406013[/C][/ROW]
[ROW][C]7[/C][C]0.012649[/C][C]0.1073[/C][C]0.457414[/C][/ROW]
[ROW][C]8[/C][C]-0.162615[/C][C]-1.3798[/C][C]0.085955[/C][/ROW]
[ROW][C]9[/C][C]0.305641[/C][C]2.5935[/C][C]0.005751[/C][/ROW]
[ROW][C]10[/C][C]-0.255096[/C][C]-2.1646[/C][C]0.016869[/C][/ROW]
[ROW][C]11[/C][C]0.127276[/C][C]1.08[/C][C]0.14188[/C][/ROW]
[ROW][C]12[/C][C]-0.136107[/C][C]-1.1549[/C][C]0.125974[/C][/ROW]
[ROW][C]13[/C][C]0.055304[/C][C]0.4693[/C][C]0.320146[/C][/ROW]
[ROW][C]14[/C][C]0.026769[/C][C]0.2271[/C][C]0.410478[/C][/ROW]
[ROW][C]15[/C][C]-0.037284[/C][C]-0.3164[/C][C]0.37632[/C][/ROW]
[ROW][C]16[/C][C]0.064089[/C][C]0.5438[/C][C]0.294125[/C][/ROW]
[ROW][C]17[/C][C]-0.179262[/C][C]-1.5211[/C][C]0.066309[/C][/ROW]
[ROW][C]18[/C][C]0.353215[/C][C]2.9971[/C][C]0.001869[/C][/ROW]
[ROW][C]19[/C][C]-0.283513[/C][C]-2.4057[/C][C]0.009356[/C][/ROW]
[ROW][C]20[/C][C]0.081364[/C][C]0.6904[/C][C]0.246082[/C][/ROW]
[ROW][C]21[/C][C]0.056624[/C][C]0.4805[/C][C]0.316175[/C][/ROW]
[ROW][C]22[/C][C]-0.128793[/C][C]-1.0928[/C][C]0.139052[/C][/ROW]
[ROW][C]23[/C][C]0.247006[/C][C]2.0959[/C][C]0.019803[/C][/ROW]
[ROW][C]24[/C][C]-0.210842[/C][C]-1.7891[/C][C]0.038906[/C][/ROW]
[ROW][C]25[/C][C]0.050995[/C][C]0.4327[/C][C]0.333262[/C][/ROW]
[ROW][C]26[/C][C]0.042272[/C][C]0.3587[/C][C]0.360439[/C][/ROW]
[ROW][C]27[/C][C]0.038906[/C][C]0.3301[/C][C]0.371131[/C][/ROW]
[ROW][C]28[/C][C]-0.209123[/C][C]-1.7745[/C][C]0.040106[/C][/ROW]
[ROW][C]29[/C][C]0.275761[/C][C]2.3399[/C][C]0.011032[/C][/ROW]
[ROW][C]30[/C][C]-0.247991[/C][C]-2.1043[/C][C]0.019423[/C][/ROW]
[ROW][C]31[/C][C]0.099871[/C][C]0.8474[/C][C]0.199781[/C][/ROW]
[ROW][C]32[/C][C]0.088012[/C][C]0.7468[/C][C]0.228807[/C][/ROW]
[ROW][C]33[/C][C]-0.157605[/C][C]-1.3373[/C][C]0.092663[/C][/ROW]
[ROW][C]34[/C][C]0.072311[/C][C]0.6136[/C][C]0.270713[/C][/ROW]
[ROW][C]35[/C][C]-0.078899[/C][C]-0.6695[/C][C]0.252666[/C][/ROW]
[ROW][C]36[/C][C]0.075892[/C][C]0.644[/C][C]0.260824[/C][/ROW]
[ROW][C]37[/C][C]-0.05835[/C][C]-0.4951[/C][C]0.311011[/C][/ROW]
[ROW][C]38[/C][C]0.032267[/C][C]0.2738[/C][C]0.392512[/C][/ROW]
[ROW][C]39[/C][C]-0.054482[/C][C]-0.4623[/C][C]0.322631[/C][/ROW]
[ROW][C]40[/C][C]0.125913[/C][C]1.0684[/C][C]0.144452[/C][/ROW]
[ROW][C]41[/C][C]-0.080648[/C][C]-0.6843[/C][C]0.247985[/C][/ROW]
[ROW][C]42[/C][C]0.008415[/C][C]0.0714[/C][C]0.471638[/C][/ROW]
[ROW][C]43[/C][C]-0.00638[/C][C]-0.0541[/C][C]0.47849[/C][/ROW]
[ROW][C]44[/C][C]0.058259[/C][C]0.4943[/C][C]0.311286[/C][/ROW]
[ROW][C]45[/C][C]-0.074551[/C][C]-0.6326[/C][C]0.264505[/C][/ROW]
[ROW][C]46[/C][C]0.015589[/C][C]0.1323[/C][C]0.447566[/C][/ROW]
[ROW][C]47[/C][C]0.082863[/C][C]0.7031[/C][C]0.242126[/C][/ROW]
[ROW][C]48[/C][C]-0.165744[/C][C]-1.4064[/C][C]0.081955[/C][/ROW]
[ROW][C]49[/C][C]0.151751[/C][C]1.2876[/C][C]0.100996[/C][/ROW]
[ROW][C]50[/C][C]-0.020642[/C][C]-0.1752[/C][C]0.430725[/C][/ROW]
[ROW][C]51[/C][C]-0.138683[/C][C]-1.1768[/C][C]0.121583[/C][/ROW]
[ROW][C]52[/C][C]0.157508[/C][C]1.3365[/C][C]0.092798[/C][/ROW]
[ROW][C]53[/C][C]-0.108967[/C][C]-0.9246[/C][C]0.179127[/C][/ROW]
[ROW][C]54[/C][C]0.013146[/C][C]0.1115[/C][C]0.455747[/C][/ROW]
[ROW][C]55[/C][C]0.039425[/C][C]0.3345[/C][C]0.369476[/C][/ROW]
[ROW][C]56[/C][C]-0.021305[/C][C]-0.1808[/C][C]0.428523[/C][/ROW]
[ROW][C]57[/C][C]-0.032301[/C][C]-0.2741[/C][C]0.392402[/C][/ROW]
[ROW][C]58[/C][C]0.090321[/C][C]0.7664[/C][C]0.222973[/C][/ROW]
[ROW][C]59[/C][C]-0.05463[/C][C]-0.4636[/C][C]0.322183[/C][/ROW]
[ROW][C]60[/C][C]-0.00022[/C][C]-0.0019[/C][C]0.499257[/C][/ROW]
[/TABLE]
Source: https://freestatistics.org/blog/index.php?pk=31828&T=1

Globally Unique Identifier (entire table): ba.freestatistics.org/blog/index.php?pk=31828&T=1

As an alternative you can also use a QR Code:  

The GUIDs for individual cells are displayed in the table below:

Autocorrelation Function
Time lag kACF(k)T-STATP-value
1-0.587013-4.9812e-06
20.1232181.04550.149635
30.0850570.72170.236398
4-0.10461-0.88760.188843
50.0697420.59180.277925
6-0.02813-0.23870.406013
70.0126490.10730.457414
8-0.162615-1.37980.085955
90.3056412.59350.005751
10-0.255096-2.16460.016869
110.1272761.080.14188
12-0.136107-1.15490.125974
130.0553040.46930.320146
140.0267690.22710.410478
15-0.037284-0.31640.37632
160.0640890.54380.294125
17-0.179262-1.52110.066309
180.3532152.99710.001869
19-0.283513-2.40570.009356
200.0813640.69040.246082
210.0566240.48050.316175
22-0.128793-1.09280.139052
230.2470062.09590.019803
24-0.210842-1.78910.038906
250.0509950.43270.333262
260.0422720.35870.360439
270.0389060.33010.371131
28-0.209123-1.77450.040106
290.2757612.33990.011032
30-0.247991-2.10430.019423
310.0998710.84740.199781
320.0880120.74680.228807
33-0.157605-1.33730.092663
340.0723110.61360.270713
35-0.078899-0.66950.252666
360.0758920.6440.260824
37-0.05835-0.49510.311011
380.0322670.27380.392512
39-0.054482-0.46230.322631
400.1259131.06840.144452
41-0.080648-0.68430.247985
420.0084150.07140.471638
43-0.00638-0.05410.47849
440.0582590.49430.311286
45-0.074551-0.63260.264505
460.0155890.13230.447566
470.0828630.70310.242126
48-0.165744-1.40640.081955
490.1517511.28760.100996
50-0.020642-0.17520.430725
51-0.138683-1.17680.121583
520.1575081.33650.092798
53-0.108967-0.92460.179127
540.0131460.11150.455747
550.0394250.33450.369476
56-0.021305-0.18080.428523
57-0.032301-0.27410.392402
580.0903210.76640.222973
59-0.05463-0.46360.322183
60-0.00022-0.00190.499257


Partial Autocorrelation Function
Time lag kPACF(k)T-STATP-value
1-0.587013-4.9812e-06
2-0.337748-2.86590.002724
3-0.028322-0.24030.405381
4-0.015981-0.13560.446256
50.022980.1950.422976
60.0088490.07510.470178
70.0230630.19570.422698
8-0.264072-2.24070.014065
90.1070460.90830.18337
100.0213490.18120.428379
110.0653140.55420.290577
12-0.219054-1.85870.033576
13-0.162883-1.38210.085606
14-0.085248-0.72340.235904
150.0258020.21890.41366
160.0973020.82560.205869
17-0.116063-0.98480.164003
180.1935671.64250.052426
190.076440.64860.259326
20-0.077765-0.65990.255724
210.0400410.33980.367514
22-0.059842-0.50780.306581
230.2589232.1970.015618
240.020690.17560.430567
25-0.101773-0.86360.195346
260.0715820.60740.272751
270.0745530.63260.264498
28-0.174889-1.4840.07109
290.1107880.94010.175163
300.0209120.17740.429828
310.0648020.54990.292058
32-0.083689-0.71010.23996
330.0233440.19810.421771
34-0.039808-0.33780.368254
35-0.089042-0.75550.226194
36-0.237153-2.01230.023965
370.0328860.2790.390503
380.009530.08090.467886
39-0.104381-0.88570.189364
400.0731730.62090.268316
41-0.046622-0.39560.346783
42-0.003036-0.02580.489759
43-0.038164-0.32380.373501
440.0370710.31460.377005
45-0.016547-0.14040.444365
46-0.055229-0.46860.320375
47-0.0699-0.59310.277479
48-0.087633-0.74360.229772
49-0.047129-0.39990.345207
500.0929740.78890.216376
51-0.015359-0.13030.448335
520.0082080.06960.472334
53-0.000627-0.00530.497884
54-0.005188-0.0440.482503
55-0.112525-0.95480.171436
560.0380220.32260.373955
570.1847721.56780.060652
58-0.041809-0.35480.361904
590.0523590.44430.329086
600.0419920.35630.361322

\begin{tabular}{lllllllll}
\hline
Partial Autocorrelation Function \tabularnewline
Time lag k & PACF(k) & T-STAT & P-value \tabularnewline
1 & -0.587013 & -4.981 & 2e-06 \tabularnewline
2 & -0.337748 & -2.8659 & 0.002724 \tabularnewline
3 & -0.028322 & -0.2403 & 0.405381 \tabularnewline
4 & -0.015981 & -0.1356 & 0.446256 \tabularnewline
5 & 0.02298 & 0.195 & 0.422976 \tabularnewline
6 & 0.008849 & 0.0751 & 0.470178 \tabularnewline
7 & 0.023063 & 0.1957 & 0.422698 \tabularnewline
8 & -0.264072 & -2.2407 & 0.014065 \tabularnewline
9 & 0.107046 & 0.9083 & 0.18337 \tabularnewline
10 & 0.021349 & 0.1812 & 0.428379 \tabularnewline
11 & 0.065314 & 0.5542 & 0.290577 \tabularnewline
12 & -0.219054 & -1.8587 & 0.033576 \tabularnewline
13 & -0.162883 & -1.3821 & 0.085606 \tabularnewline
14 & -0.085248 & -0.7234 & 0.235904 \tabularnewline
15 & 0.025802 & 0.2189 & 0.41366 \tabularnewline
16 & 0.097302 & 0.8256 & 0.205869 \tabularnewline
17 & -0.116063 & -0.9848 & 0.164003 \tabularnewline
18 & 0.193567 & 1.6425 & 0.052426 \tabularnewline
19 & 0.07644 & 0.6486 & 0.259326 \tabularnewline
20 & -0.077765 & -0.6599 & 0.255724 \tabularnewline
21 & 0.040041 & 0.3398 & 0.367514 \tabularnewline
22 & -0.059842 & -0.5078 & 0.306581 \tabularnewline
23 & 0.258923 & 2.197 & 0.015618 \tabularnewline
24 & 0.02069 & 0.1756 & 0.430567 \tabularnewline
25 & -0.101773 & -0.8636 & 0.195346 \tabularnewline
26 & 0.071582 & 0.6074 & 0.272751 \tabularnewline
27 & 0.074553 & 0.6326 & 0.264498 \tabularnewline
28 & -0.174889 & -1.484 & 0.07109 \tabularnewline
29 & 0.110788 & 0.9401 & 0.175163 \tabularnewline
30 & 0.020912 & 0.1774 & 0.429828 \tabularnewline
31 & 0.064802 & 0.5499 & 0.292058 \tabularnewline
32 & -0.083689 & -0.7101 & 0.23996 \tabularnewline
33 & 0.023344 & 0.1981 & 0.421771 \tabularnewline
34 & -0.039808 & -0.3378 & 0.368254 \tabularnewline
35 & -0.089042 & -0.7555 & 0.226194 \tabularnewline
36 & -0.237153 & -2.0123 & 0.023965 \tabularnewline
37 & 0.032886 & 0.279 & 0.390503 \tabularnewline
38 & 0.00953 & 0.0809 & 0.467886 \tabularnewline
39 & -0.104381 & -0.8857 & 0.189364 \tabularnewline
40 & 0.073173 & 0.6209 & 0.268316 \tabularnewline
41 & -0.046622 & -0.3956 & 0.346783 \tabularnewline
42 & -0.003036 & -0.0258 & 0.489759 \tabularnewline
43 & -0.038164 & -0.3238 & 0.373501 \tabularnewline
44 & 0.037071 & 0.3146 & 0.377005 \tabularnewline
45 & -0.016547 & -0.1404 & 0.444365 \tabularnewline
46 & -0.055229 & -0.4686 & 0.320375 \tabularnewline
47 & -0.0699 & -0.5931 & 0.277479 \tabularnewline
48 & -0.087633 & -0.7436 & 0.229772 \tabularnewline
49 & -0.047129 & -0.3999 & 0.345207 \tabularnewline
50 & 0.092974 & 0.7889 & 0.216376 \tabularnewline
51 & -0.015359 & -0.1303 & 0.448335 \tabularnewline
52 & 0.008208 & 0.0696 & 0.472334 \tabularnewline
53 & -0.000627 & -0.0053 & 0.497884 \tabularnewline
54 & -0.005188 & -0.044 & 0.482503 \tabularnewline
55 & -0.112525 & -0.9548 & 0.171436 \tabularnewline
56 & 0.038022 & 0.3226 & 0.373955 \tabularnewline
57 & 0.184772 & 1.5678 & 0.060652 \tabularnewline
58 & -0.041809 & -0.3548 & 0.361904 \tabularnewline
59 & 0.052359 & 0.4443 & 0.329086 \tabularnewline
60 & 0.041992 & 0.3563 & 0.361322 \tabularnewline
\hline
\end{tabular}
%Source: https://freestatistics.org/blog/index.php?pk=31828&T=2

[TABLE]
[ROW][C]Partial Autocorrelation Function[/C][/ROW]
[ROW][C]Time lag k[/C][C]PACF(k)[/C][C]T-STAT[/C][C]P-value[/C][/ROW]
[ROW][C]1[/C][C]-0.587013[/C][C]-4.981[/C][C]2e-06[/C][/ROW]
[ROW][C]2[/C][C]-0.337748[/C][C]-2.8659[/C][C]0.002724[/C][/ROW]
[ROW][C]3[/C][C]-0.028322[/C][C]-0.2403[/C][C]0.405381[/C][/ROW]
[ROW][C]4[/C][C]-0.015981[/C][C]-0.1356[/C][C]0.446256[/C][/ROW]
[ROW][C]5[/C][C]0.02298[/C][C]0.195[/C][C]0.422976[/C][/ROW]
[ROW][C]6[/C][C]0.008849[/C][C]0.0751[/C][C]0.470178[/C][/ROW]
[ROW][C]7[/C][C]0.023063[/C][C]0.1957[/C][C]0.422698[/C][/ROW]
[ROW][C]8[/C][C]-0.264072[/C][C]-2.2407[/C][C]0.014065[/C][/ROW]
[ROW][C]9[/C][C]0.107046[/C][C]0.9083[/C][C]0.18337[/C][/ROW]
[ROW][C]10[/C][C]0.021349[/C][C]0.1812[/C][C]0.428379[/C][/ROW]
[ROW][C]11[/C][C]0.065314[/C][C]0.5542[/C][C]0.290577[/C][/ROW]
[ROW][C]12[/C][C]-0.219054[/C][C]-1.8587[/C][C]0.033576[/C][/ROW]
[ROW][C]13[/C][C]-0.162883[/C][C]-1.3821[/C][C]0.085606[/C][/ROW]
[ROW][C]14[/C][C]-0.085248[/C][C]-0.7234[/C][C]0.235904[/C][/ROW]
[ROW][C]15[/C][C]0.025802[/C][C]0.2189[/C][C]0.41366[/C][/ROW]
[ROW][C]16[/C][C]0.097302[/C][C]0.8256[/C][C]0.205869[/C][/ROW]
[ROW][C]17[/C][C]-0.116063[/C][C]-0.9848[/C][C]0.164003[/C][/ROW]
[ROW][C]18[/C][C]0.193567[/C][C]1.6425[/C][C]0.052426[/C][/ROW]
[ROW][C]19[/C][C]0.07644[/C][C]0.6486[/C][C]0.259326[/C][/ROW]
[ROW][C]20[/C][C]-0.077765[/C][C]-0.6599[/C][C]0.255724[/C][/ROW]
[ROW][C]21[/C][C]0.040041[/C][C]0.3398[/C][C]0.367514[/C][/ROW]
[ROW][C]22[/C][C]-0.059842[/C][C]-0.5078[/C][C]0.306581[/C][/ROW]
[ROW][C]23[/C][C]0.258923[/C][C]2.197[/C][C]0.015618[/C][/ROW]
[ROW][C]24[/C][C]0.02069[/C][C]0.1756[/C][C]0.430567[/C][/ROW]
[ROW][C]25[/C][C]-0.101773[/C][C]-0.8636[/C][C]0.195346[/C][/ROW]
[ROW][C]26[/C][C]0.071582[/C][C]0.6074[/C][C]0.272751[/C][/ROW]
[ROW][C]27[/C][C]0.074553[/C][C]0.6326[/C][C]0.264498[/C][/ROW]
[ROW][C]28[/C][C]-0.174889[/C][C]-1.484[/C][C]0.07109[/C][/ROW]
[ROW][C]29[/C][C]0.110788[/C][C]0.9401[/C][C]0.175163[/C][/ROW]
[ROW][C]30[/C][C]0.020912[/C][C]0.1774[/C][C]0.429828[/C][/ROW]
[ROW][C]31[/C][C]0.064802[/C][C]0.5499[/C][C]0.292058[/C][/ROW]
[ROW][C]32[/C][C]-0.083689[/C][C]-0.7101[/C][C]0.23996[/C][/ROW]
[ROW][C]33[/C][C]0.023344[/C][C]0.1981[/C][C]0.421771[/C][/ROW]
[ROW][C]34[/C][C]-0.039808[/C][C]-0.3378[/C][C]0.368254[/C][/ROW]
[ROW][C]35[/C][C]-0.089042[/C][C]-0.7555[/C][C]0.226194[/C][/ROW]
[ROW][C]36[/C][C]-0.237153[/C][C]-2.0123[/C][C]0.023965[/C][/ROW]
[ROW][C]37[/C][C]0.032886[/C][C]0.279[/C][C]0.390503[/C][/ROW]
[ROW][C]38[/C][C]0.00953[/C][C]0.0809[/C][C]0.467886[/C][/ROW]
[ROW][C]39[/C][C]-0.104381[/C][C]-0.8857[/C][C]0.189364[/C][/ROW]
[ROW][C]40[/C][C]0.073173[/C][C]0.6209[/C][C]0.268316[/C][/ROW]
[ROW][C]41[/C][C]-0.046622[/C][C]-0.3956[/C][C]0.346783[/C][/ROW]
[ROW][C]42[/C][C]-0.003036[/C][C]-0.0258[/C][C]0.489759[/C][/ROW]
[ROW][C]43[/C][C]-0.038164[/C][C]-0.3238[/C][C]0.373501[/C][/ROW]
[ROW][C]44[/C][C]0.037071[/C][C]0.3146[/C][C]0.377005[/C][/ROW]
[ROW][C]45[/C][C]-0.016547[/C][C]-0.1404[/C][C]0.444365[/C][/ROW]
[ROW][C]46[/C][C]-0.055229[/C][C]-0.4686[/C][C]0.320375[/C][/ROW]
[ROW][C]47[/C][C]-0.0699[/C][C]-0.5931[/C][C]0.277479[/C][/ROW]
[ROW][C]48[/C][C]-0.087633[/C][C]-0.7436[/C][C]0.229772[/C][/ROW]
[ROW][C]49[/C][C]-0.047129[/C][C]-0.3999[/C][C]0.345207[/C][/ROW]
[ROW][C]50[/C][C]0.092974[/C][C]0.7889[/C][C]0.216376[/C][/ROW]
[ROW][C]51[/C][C]-0.015359[/C][C]-0.1303[/C][C]0.448335[/C][/ROW]
[ROW][C]52[/C][C]0.008208[/C][C]0.0696[/C][C]0.472334[/C][/ROW]
[ROW][C]53[/C][C]-0.000627[/C][C]-0.0053[/C][C]0.497884[/C][/ROW]
[ROW][C]54[/C][C]-0.005188[/C][C]-0.044[/C][C]0.482503[/C][/ROW]
[ROW][C]55[/C][C]-0.112525[/C][C]-0.9548[/C][C]0.171436[/C][/ROW]
[ROW][C]56[/C][C]0.038022[/C][C]0.3226[/C][C]0.373955[/C][/ROW]
[ROW][C]57[/C][C]0.184772[/C][C]1.5678[/C][C]0.060652[/C][/ROW]
[ROW][C]58[/C][C]-0.041809[/C][C]-0.3548[/C][C]0.361904[/C][/ROW]
[ROW][C]59[/C][C]0.052359[/C][C]0.4443[/C][C]0.329086[/C][/ROW]
[ROW][C]60[/C][C]0.041992[/C][C]0.3563[/C][C]0.361322[/C][/ROW]
[/TABLE]
Source: https://freestatistics.org/blog/index.php?pk=31828&T=2

Globally Unique Identifier (entire table): ba.freestatistics.org/blog/index.php?pk=31828&T=2

As an alternative you can also use a QR Code:  

The GUIDs for individual cells are displayed in the table below:

Partial Autocorrelation Function
Time lag kPACF(k)T-STATP-value
1-0.587013-4.9812e-06
2-0.337748-2.86590.002724
3-0.028322-0.24030.405381
4-0.015981-0.13560.446256
50.022980.1950.422976
60.0088490.07510.470178
70.0230630.19570.422698
8-0.264072-2.24070.014065
90.1070460.90830.18337
100.0213490.18120.428379
110.0653140.55420.290577
12-0.219054-1.85870.033576
13-0.162883-1.38210.085606
14-0.085248-0.72340.235904
150.0258020.21890.41366
160.0973020.82560.205869
17-0.116063-0.98480.164003
180.1935671.64250.052426
190.076440.64860.259326
20-0.077765-0.65990.255724
210.0400410.33980.367514
22-0.059842-0.50780.306581
230.2589232.1970.015618
240.020690.17560.430567
25-0.101773-0.86360.195346
260.0715820.60740.272751
270.0745530.63260.264498
28-0.174889-1.4840.07109
290.1107880.94010.175163
300.0209120.17740.429828
310.0648020.54990.292058
32-0.083689-0.71010.23996
330.0233440.19810.421771
34-0.039808-0.33780.368254
35-0.089042-0.75550.226194
36-0.237153-2.01230.023965
370.0328860.2790.390503
380.009530.08090.467886
39-0.104381-0.88570.189364
400.0731730.62090.268316
41-0.046622-0.39560.346783
42-0.003036-0.02580.489759
43-0.038164-0.32380.373501
440.0370710.31460.377005
45-0.016547-0.14040.444365
46-0.055229-0.46860.320375
47-0.0699-0.59310.277479
48-0.087633-0.74360.229772
49-0.047129-0.39990.345207
500.0929740.78890.216376
51-0.015359-0.13030.448335
520.0082080.06960.472334
53-0.000627-0.00530.497884
54-0.005188-0.0440.482503
55-0.112525-0.95480.171436
560.0380220.32260.373955
570.1847721.56780.060652
58-0.041809-0.35480.361904
590.0523590.44430.329086
600.0419920.35630.361322


Parameters (Session):
par1 = 60 ; par2 = 1 ; par3 = 1 ; par4 = 1 ; par5 = 12 ;
Parameters (R input):
par1 = 60 ; par2 = 1 ; par3 = 1 ; par4 = 1 ; par5 = 12 ;
R code (references can be found in the software module):
if (par1 == 'Default') {
par1 = 10*log10(length(x))
} else {
par1 <- as.numeric(par1)
}
par2 <- as.numeric(par2)
par3 <- as.numeric(par3)
par4 <- as.numeric(par4)
par5 <- as.numeric(par5)
if (par2 == 0) {
x <- log(x)
} else {
x <- (x ^ par2 - 1) / par2
}
if (par3 > 0) x <- diff(x,lag=1,difference=par3)
if (par4 > 0) x <- diff(x,lag=par5,difference=par4)
bitmap(file='pic1.png')
racf <- acf(x,par1,main='Autocorrelation',xlab='lags',ylab='ACF')
dev.off()
bitmap(file='pic2.png')
rpacf <- pacf(x,par1,main='Partial Autocorrelation',xlab='lags',ylab='PACF')
dev.off()
(myacf <- c(racf$acf))
(mypacf <- c(rpacf$acf))
lengthx <- length(x)
sqrtn <- sqrt(lengthx)
load(file='createtable')
a<-table.start()
a<-table.row.start(a)
a<-table.element(a,'Autocorrelation Function',4,TRUE)
a<-table.row.end(a)
a<-table.row.start(a)
a<-table.element(a,'Time lag k',header=TRUE)
a<-table.element(a,hyperlink('basics.htm','ACF(k)','click here for more information about the Autocorrelation Function'),header=TRUE)
a<-table.element(a,'T-STAT',header=TRUE)
a<-table.element(a,'P-value',header=TRUE)
a<-table.row.end(a)
for (i in 2:(par1+1)) {
a<-table.row.start(a)
a<-table.element(a,i-1,header=TRUE)
a<-table.element(a,round(myacf[i],6))
mytstat <- myacf[i]*sqrtn
a<-table.element(a,round(mytstat,4))
a<-table.element(a,round(1-pt(abs(mytstat),lengthx),6))
a<-table.row.end(a)
}
a<-table.end(a)
table.save(a,file='mytable.tab')
a<-table.start()
a<-table.row.start(a)
a<-table.element(a,'Partial Autocorrelation Function',4,TRUE)
a<-table.row.end(a)
a<-table.row.start(a)
a<-table.element(a,'Time lag k',header=TRUE)
a<-table.element(a,hyperlink('basics.htm','PACF(k)','click here for more information about the Partial Autocorrelation Function'),header=TRUE)
a<-table.element(a,'T-STAT',header=TRUE)
a<-table.element(a,'P-value',header=TRUE)
a<-table.row.end(a)
for (i in 1:par1) {
a<-table.row.start(a)
a<-table.element(a,i,header=TRUE)
a<-table.element(a,round(mypacf[i],6))
mytstat <- mypacf[i]*sqrtn
a<-table.element(a,round(mytstat,4))
a<-table.element(a,round(1-pt(abs(mytstat),lengthx),6))
a<-table.row.end(a)
}
a<-table.end(a)
table.save(a,file='mytable1.tab')