Free Statistics

of Irreproducible Research!

Author's title

Author*Unverified author*
R Software Modulerwasp_autocorrelation.wasp
Title produced by software(Partial) Autocorrelation Function
Date of computationTue, 09 Dec 2008 14:36:06 -0700
Cite this page as followsStatistical Computations at FreeStatistics.org, Office for Research Development and Education, URL https://freestatistics.org/blog/index.php?v=date/2008/Dec/09/t1228858642n9zr8gn2xh7djm3.htm/, Retrieved Sun, 19 May 2024 12:41:00 +0000
Statistical Computations at FreeStatistics.org, Office for Research Development and Education, URL https://freestatistics.org/blog/index.php?pk=31808, Retrieved Sun, 19 May 2024 12:41:00 +0000
QR Codes:

Original text written by user:
IsPrivate?No (this computation is public)
User-defined keywords
Estimated Impact150
Family? (F = Feedback message, R = changed R code, M = changed R Module, P = changed Parameters, D = changed Data)
-       [(Partial) Autocorrelation Function] [opgave6bis - eige...] [2008-12-09 21:36:06] [be6d97e5c18f42f870a86936f130440b] [Current]
Feedback Forum

Post a new message
Dataseries X:
0.7200
0.7400
0.7400
0.7400
0.7400
0.7400
0.7400
0.7400
0.7400
0.7400
0.7400
0.7400
0.7400
0.7500
0.7500
0.7500
0.7500
0.7500
0.7500
0.7500
0.7500
0.7500
0.7500
0.7500
0.7500
0.7600
0.7600
0.7600
0.7600
0.7600
0.7600
0.7600
0.7600
0.7600
0.7600
0.7600
0.7600
0.7800
0.7800
0.7800
0.7800
0.7800
0.7800
0.7800
0.7800
0.7800
0.7800
0.7800
0.7800
0.7800
0.7800
0.7800
0.7800
0.7800
0.7800
0.7800
0.7800
0.7800
0.7800
0.7800
0.7800
0.8000
0.8000
0.8000
0.8000
0.8000
0.8000
0.8000
0.8000
0.8000
0.8000
0.8000
0.8000
0.8100
0.8100
0.8100
0.8100
0.8100
0.8100
0.8100
0.8100
0.8100
0.8100
0.8100


Summary of computational transaction
Raw Inputview raw input (R code)
Raw Outputview raw output of R engine
Computing time1 seconds
R Server'Gwilym Jenkins' @ 72.249.127.135

\begin{tabular}{lllllllll}
\hline
Summary of computational transaction \tabularnewline
Raw Input & view raw input (R code)  \tabularnewline
Raw Output & view raw output of R engine  \tabularnewline
Computing time & 1 seconds \tabularnewline
R Server & 'Gwilym Jenkins' @ 72.249.127.135 \tabularnewline
\hline
\end{tabular}
%Source: https://freestatistics.org/blog/index.php?pk=31808&T=0

[TABLE]
[ROW][C]Summary of computational transaction[/C][/ROW]
[ROW][C]Raw Input[/C][C]view raw input (R code) [/C][/ROW]
[ROW][C]Raw Output[/C][C]view raw output of R engine [/C][/ROW]
[ROW][C]Computing time[/C][C]1 seconds[/C][/ROW]
[ROW][C]R Server[/C][C]'Gwilym Jenkins' @ 72.249.127.135[/C][/ROW]
[/TABLE]
Source: https://freestatistics.org/blog/index.php?pk=31808&T=0

Globally Unique Identifier (entire table): ba.freestatistics.org/blog/index.php?pk=31808&T=0

As an alternative you can also use a QR Code:  

The GUIDs for individual cells are displayed in the table below:

Summary of computational transaction
Raw Inputview raw input (R code)
Raw Outputview raw output of R engine
Computing time1 seconds
R Server'Gwilym Jenkins' @ 72.249.127.135


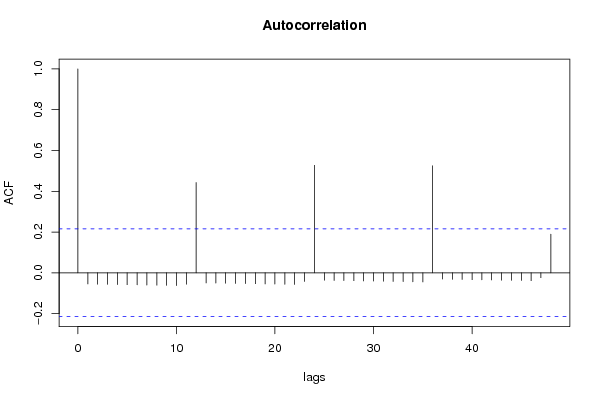
Autocorrelation Function
Time lag kACF(k)T-STATP-value
1-0.054962-0.50070.308944
2-0.055801-0.50840.306272
3-0.056639-0.5160.303611
4-0.057477-0.52360.300961
5-0.058316-0.53130.298321
6-0.059154-0.53890.295692
7-0.059993-0.54660.293074
8-0.060831-0.55420.290467
9-0.061669-0.56180.287871
10-0.062508-0.56950.285287
11-0.055614-0.50670.306865
120.4426884.03316.1e-05
13-0.049559-0.45150.326402
14-0.050397-0.45910.323666
15-0.051236-0.46680.32094
16-0.052074-0.47440.318223
17-0.052913-0.48210.315517
18-0.053751-0.48970.312821
19-0.054589-0.49730.310134
20-0.055428-0.5050.307458
21-0.056266-0.51260.304793
22-0.057105-0.52020.302138
23-0.042479-0.3870.349872
240.5271294.80243e-06
25-0.036424-0.33180.370424
26-0.037262-0.33950.367554
27-0.038101-0.34710.364692
28-0.038939-0.35480.361837
29-0.039778-0.36240.35899
30-0.040616-0.370.356151
31-0.041454-0.37770.353321
32-0.042293-0.38530.350498
33-0.043131-0.39290.347684
34-0.04397-0.40060.344878
35-0.044808-0.40820.342081
360.52484.78124e-06
37-0.031021-0.28260.389088
38-0.031859-0.29030.386173
39-0.032698-0.29790.383265
40-0.033536-0.30550.380364
41-0.034375-0.31320.377469
42-0.035213-0.32080.374582
43-0.036051-0.32840.371702
44-0.03689-0.33610.368828
45-0.037728-0.34370.365963
46-0.038567-0.35140.363105
47-0.023941-0.21810.413938
480.1891381.72310.044294

\begin{tabular}{lllllllll}
\hline
Autocorrelation Function \tabularnewline
Time lag k & ACF(k) & T-STAT & P-value \tabularnewline
1 & -0.054962 & -0.5007 & 0.308944 \tabularnewline
2 & -0.055801 & -0.5084 & 0.306272 \tabularnewline
3 & -0.056639 & -0.516 & 0.303611 \tabularnewline
4 & -0.057477 & -0.5236 & 0.300961 \tabularnewline
5 & -0.058316 & -0.5313 & 0.298321 \tabularnewline
6 & -0.059154 & -0.5389 & 0.295692 \tabularnewline
7 & -0.059993 & -0.5466 & 0.293074 \tabularnewline
8 & -0.060831 & -0.5542 & 0.290467 \tabularnewline
9 & -0.061669 & -0.5618 & 0.287871 \tabularnewline
10 & -0.062508 & -0.5695 & 0.285287 \tabularnewline
11 & -0.055614 & -0.5067 & 0.306865 \tabularnewline
12 & 0.442688 & 4.0331 & 6.1e-05 \tabularnewline
13 & -0.049559 & -0.4515 & 0.326402 \tabularnewline
14 & -0.050397 & -0.4591 & 0.323666 \tabularnewline
15 & -0.051236 & -0.4668 & 0.32094 \tabularnewline
16 & -0.052074 & -0.4744 & 0.318223 \tabularnewline
17 & -0.052913 & -0.4821 & 0.315517 \tabularnewline
18 & -0.053751 & -0.4897 & 0.312821 \tabularnewline
19 & -0.054589 & -0.4973 & 0.310134 \tabularnewline
20 & -0.055428 & -0.505 & 0.307458 \tabularnewline
21 & -0.056266 & -0.5126 & 0.304793 \tabularnewline
22 & -0.057105 & -0.5202 & 0.302138 \tabularnewline
23 & -0.042479 & -0.387 & 0.349872 \tabularnewline
24 & 0.527129 & 4.8024 & 3e-06 \tabularnewline
25 & -0.036424 & -0.3318 & 0.370424 \tabularnewline
26 & -0.037262 & -0.3395 & 0.367554 \tabularnewline
27 & -0.038101 & -0.3471 & 0.364692 \tabularnewline
28 & -0.038939 & -0.3548 & 0.361837 \tabularnewline
29 & -0.039778 & -0.3624 & 0.35899 \tabularnewline
30 & -0.040616 & -0.37 & 0.356151 \tabularnewline
31 & -0.041454 & -0.3777 & 0.353321 \tabularnewline
32 & -0.042293 & -0.3853 & 0.350498 \tabularnewline
33 & -0.043131 & -0.3929 & 0.347684 \tabularnewline
34 & -0.04397 & -0.4006 & 0.344878 \tabularnewline
35 & -0.044808 & -0.4082 & 0.342081 \tabularnewline
36 & 0.5248 & 4.7812 & 4e-06 \tabularnewline
37 & -0.031021 & -0.2826 & 0.389088 \tabularnewline
38 & -0.031859 & -0.2903 & 0.386173 \tabularnewline
39 & -0.032698 & -0.2979 & 0.383265 \tabularnewline
40 & -0.033536 & -0.3055 & 0.380364 \tabularnewline
41 & -0.034375 & -0.3132 & 0.377469 \tabularnewline
42 & -0.035213 & -0.3208 & 0.374582 \tabularnewline
43 & -0.036051 & -0.3284 & 0.371702 \tabularnewline
44 & -0.03689 & -0.3361 & 0.368828 \tabularnewline
45 & -0.037728 & -0.3437 & 0.365963 \tabularnewline
46 & -0.038567 & -0.3514 & 0.363105 \tabularnewline
47 & -0.023941 & -0.2181 & 0.413938 \tabularnewline
48 & 0.189138 & 1.7231 & 0.044294 \tabularnewline
\hline
\end{tabular}
%Source: https://freestatistics.org/blog/index.php?pk=31808&T=1

[TABLE]
[ROW][C]Autocorrelation Function[/C][/ROW]
[ROW][C]Time lag k[/C][C]ACF(k)[/C][C]T-STAT[/C][C]P-value[/C][/ROW]
[ROW][C]1[/C][C]-0.054962[/C][C]-0.5007[/C][C]0.308944[/C][/ROW]
[ROW][C]2[/C][C]-0.055801[/C][C]-0.5084[/C][C]0.306272[/C][/ROW]
[ROW][C]3[/C][C]-0.056639[/C][C]-0.516[/C][C]0.303611[/C][/ROW]
[ROW][C]4[/C][C]-0.057477[/C][C]-0.5236[/C][C]0.300961[/C][/ROW]
[ROW][C]5[/C][C]-0.058316[/C][C]-0.5313[/C][C]0.298321[/C][/ROW]
[ROW][C]6[/C][C]-0.059154[/C][C]-0.5389[/C][C]0.295692[/C][/ROW]
[ROW][C]7[/C][C]-0.059993[/C][C]-0.5466[/C][C]0.293074[/C][/ROW]
[ROW][C]8[/C][C]-0.060831[/C][C]-0.5542[/C][C]0.290467[/C][/ROW]
[ROW][C]9[/C][C]-0.061669[/C][C]-0.5618[/C][C]0.287871[/C][/ROW]
[ROW][C]10[/C][C]-0.062508[/C][C]-0.5695[/C][C]0.285287[/C][/ROW]
[ROW][C]11[/C][C]-0.055614[/C][C]-0.5067[/C][C]0.306865[/C][/ROW]
[ROW][C]12[/C][C]0.442688[/C][C]4.0331[/C][C]6.1e-05[/C][/ROW]
[ROW][C]13[/C][C]-0.049559[/C][C]-0.4515[/C][C]0.326402[/C][/ROW]
[ROW][C]14[/C][C]-0.050397[/C][C]-0.4591[/C][C]0.323666[/C][/ROW]
[ROW][C]15[/C][C]-0.051236[/C][C]-0.4668[/C][C]0.32094[/C][/ROW]
[ROW][C]16[/C][C]-0.052074[/C][C]-0.4744[/C][C]0.318223[/C][/ROW]
[ROW][C]17[/C][C]-0.052913[/C][C]-0.4821[/C][C]0.315517[/C][/ROW]
[ROW][C]18[/C][C]-0.053751[/C][C]-0.4897[/C][C]0.312821[/C][/ROW]
[ROW][C]19[/C][C]-0.054589[/C][C]-0.4973[/C][C]0.310134[/C][/ROW]
[ROW][C]20[/C][C]-0.055428[/C][C]-0.505[/C][C]0.307458[/C][/ROW]
[ROW][C]21[/C][C]-0.056266[/C][C]-0.5126[/C][C]0.304793[/C][/ROW]
[ROW][C]22[/C][C]-0.057105[/C][C]-0.5202[/C][C]0.302138[/C][/ROW]
[ROW][C]23[/C][C]-0.042479[/C][C]-0.387[/C][C]0.349872[/C][/ROW]
[ROW][C]24[/C][C]0.527129[/C][C]4.8024[/C][C]3e-06[/C][/ROW]
[ROW][C]25[/C][C]-0.036424[/C][C]-0.3318[/C][C]0.370424[/C][/ROW]
[ROW][C]26[/C][C]-0.037262[/C][C]-0.3395[/C][C]0.367554[/C][/ROW]
[ROW][C]27[/C][C]-0.038101[/C][C]-0.3471[/C][C]0.364692[/C][/ROW]
[ROW][C]28[/C][C]-0.038939[/C][C]-0.3548[/C][C]0.361837[/C][/ROW]
[ROW][C]29[/C][C]-0.039778[/C][C]-0.3624[/C][C]0.35899[/C][/ROW]
[ROW][C]30[/C][C]-0.040616[/C][C]-0.37[/C][C]0.356151[/C][/ROW]
[ROW][C]31[/C][C]-0.041454[/C][C]-0.3777[/C][C]0.353321[/C][/ROW]
[ROW][C]32[/C][C]-0.042293[/C][C]-0.3853[/C][C]0.350498[/C][/ROW]
[ROW][C]33[/C][C]-0.043131[/C][C]-0.3929[/C][C]0.347684[/C][/ROW]
[ROW][C]34[/C][C]-0.04397[/C][C]-0.4006[/C][C]0.344878[/C][/ROW]
[ROW][C]35[/C][C]-0.044808[/C][C]-0.4082[/C][C]0.342081[/C][/ROW]
[ROW][C]36[/C][C]0.5248[/C][C]4.7812[/C][C]4e-06[/C][/ROW]
[ROW][C]37[/C][C]-0.031021[/C][C]-0.2826[/C][C]0.389088[/C][/ROW]
[ROW][C]38[/C][C]-0.031859[/C][C]-0.2903[/C][C]0.386173[/C][/ROW]
[ROW][C]39[/C][C]-0.032698[/C][C]-0.2979[/C][C]0.383265[/C][/ROW]
[ROW][C]40[/C][C]-0.033536[/C][C]-0.3055[/C][C]0.380364[/C][/ROW]
[ROW][C]41[/C][C]-0.034375[/C][C]-0.3132[/C][C]0.377469[/C][/ROW]
[ROW][C]42[/C][C]-0.035213[/C][C]-0.3208[/C][C]0.374582[/C][/ROW]
[ROW][C]43[/C][C]-0.036051[/C][C]-0.3284[/C][C]0.371702[/C][/ROW]
[ROW][C]44[/C][C]-0.03689[/C][C]-0.3361[/C][C]0.368828[/C][/ROW]
[ROW][C]45[/C][C]-0.037728[/C][C]-0.3437[/C][C]0.365963[/C][/ROW]
[ROW][C]46[/C][C]-0.038567[/C][C]-0.3514[/C][C]0.363105[/C][/ROW]
[ROW][C]47[/C][C]-0.023941[/C][C]-0.2181[/C][C]0.413938[/C][/ROW]
[ROW][C]48[/C][C]0.189138[/C][C]1.7231[/C][C]0.044294[/C][/ROW]
[/TABLE]
Source: https://freestatistics.org/blog/index.php?pk=31808&T=1

Globally Unique Identifier (entire table): ba.freestatistics.org/blog/index.php?pk=31808&T=1

As an alternative you can also use a QR Code:  

The GUIDs for individual cells are displayed in the table below:

Autocorrelation Function
Time lag kACF(k)T-STATP-value
1-0.054962-0.50070.308944
2-0.055801-0.50840.306272
3-0.056639-0.5160.303611
4-0.057477-0.52360.300961
5-0.058316-0.53130.298321
6-0.059154-0.53890.295692
7-0.059993-0.54660.293074
8-0.060831-0.55420.290467
9-0.061669-0.56180.287871
10-0.062508-0.56950.285287
11-0.055614-0.50670.306865
120.4426884.03316.1e-05
13-0.049559-0.45150.326402
14-0.050397-0.45910.323666
15-0.051236-0.46680.32094
16-0.052074-0.47440.318223
17-0.052913-0.48210.315517
18-0.053751-0.48970.312821
19-0.054589-0.49730.310134
20-0.055428-0.5050.307458
21-0.056266-0.51260.304793
22-0.057105-0.52020.302138
23-0.042479-0.3870.349872
240.5271294.80243e-06
25-0.036424-0.33180.370424
26-0.037262-0.33950.367554
27-0.038101-0.34710.364692
28-0.038939-0.35480.361837
29-0.039778-0.36240.35899
30-0.040616-0.370.356151
31-0.041454-0.37770.353321
32-0.042293-0.38530.350498
33-0.043131-0.39290.347684
34-0.04397-0.40060.344878
35-0.044808-0.40820.342081
360.52484.78124e-06
37-0.031021-0.28260.389088
38-0.031859-0.29030.386173
39-0.032698-0.29790.383265
40-0.033536-0.30550.380364
41-0.034375-0.31320.377469
42-0.035213-0.32080.374582
43-0.036051-0.32840.371702
44-0.03689-0.33610.368828
45-0.037728-0.34370.365963
46-0.038567-0.35140.363105
47-0.023941-0.21810.413938
480.1891381.72310.044294


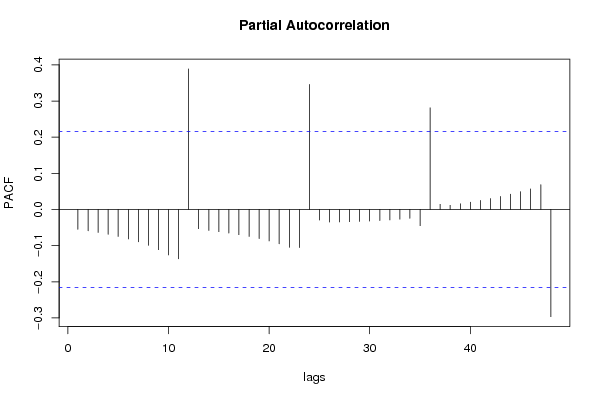
Partial Autocorrelation Function
Time lag kPACF(k)T-STATP-value
1-0.054962-0.50070.308944
2-0.059-0.53750.296176
3-0.063542-0.57890.282114
4-0.068699-0.62590.266557
5-0.074614-0.67980.249273
6-0.081479-0.74230.229997
7-0.089559-0.81590.208441
8-0.099223-0.9040.184316
9-0.111011-1.01140.157393
10-0.125736-1.14550.127645
11-0.136366-1.24240.108802
120.3887123.54130.000328
13-0.052964-0.48250.315352
14-0.057964-0.52810.299427
15-0.061395-0.55930.288719
16-0.065237-0.59430.276951
17-0.069585-0.63390.263929
18-0.07455-0.67920.249455
19-0.080281-0.73140.233298
20-0.086976-0.79240.215197
21-0.094907-0.86460.194864
22-0.104535-0.95240.17184
23-0.10521-0.95850.170295
240.3459833.15210.001128
25-0.029256-0.26650.395246
26-0.034826-0.31730.375915
27-0.034477-0.31410.377115
28-0.03387-0.30860.379212
29-0.03304-0.3010.382079
30-0.031956-0.29110.385837
31-0.030581-0.27860.390622
32-0.028872-0.2630.396586
33-0.026787-0.2440.4039
34-0.02446-0.22280.412105
35-0.044651-0.40680.342605
360.2812862.56260.006097
370.0144930.1320.447636
380.0116360.1060.457916
390.0156710.14280.44341
400.0201320.18340.42746
410.0249890.22770.410235
420.0302750.27580.391687
430.0360330.32830.371765
440.042320.38560.350408
450.0492190.44840.327514
460.0567150.51670.303371
470.0685910.62490.266878
48-0.296377-2.70010.004199

\begin{tabular}{lllllllll}
\hline
Partial Autocorrelation Function \tabularnewline
Time lag k & PACF(k) & T-STAT & P-value \tabularnewline
1 & -0.054962 & -0.5007 & 0.308944 \tabularnewline
2 & -0.059 & -0.5375 & 0.296176 \tabularnewline
3 & -0.063542 & -0.5789 & 0.282114 \tabularnewline
4 & -0.068699 & -0.6259 & 0.266557 \tabularnewline
5 & -0.074614 & -0.6798 & 0.249273 \tabularnewline
6 & -0.081479 & -0.7423 & 0.229997 \tabularnewline
7 & -0.089559 & -0.8159 & 0.208441 \tabularnewline
8 & -0.099223 & -0.904 & 0.184316 \tabularnewline
9 & -0.111011 & -1.0114 & 0.157393 \tabularnewline
10 & -0.125736 & -1.1455 & 0.127645 \tabularnewline
11 & -0.136366 & -1.2424 & 0.108802 \tabularnewline
12 & 0.388712 & 3.5413 & 0.000328 \tabularnewline
13 & -0.052964 & -0.4825 & 0.315352 \tabularnewline
14 & -0.057964 & -0.5281 & 0.299427 \tabularnewline
15 & -0.061395 & -0.5593 & 0.288719 \tabularnewline
16 & -0.065237 & -0.5943 & 0.276951 \tabularnewline
17 & -0.069585 & -0.6339 & 0.263929 \tabularnewline
18 & -0.07455 & -0.6792 & 0.249455 \tabularnewline
19 & -0.080281 & -0.7314 & 0.233298 \tabularnewline
20 & -0.086976 & -0.7924 & 0.215197 \tabularnewline
21 & -0.094907 & -0.8646 & 0.194864 \tabularnewline
22 & -0.104535 & -0.9524 & 0.17184 \tabularnewline
23 & -0.10521 & -0.9585 & 0.170295 \tabularnewline
24 & 0.345983 & 3.1521 & 0.001128 \tabularnewline
25 & -0.029256 & -0.2665 & 0.395246 \tabularnewline
26 & -0.034826 & -0.3173 & 0.375915 \tabularnewline
27 & -0.034477 & -0.3141 & 0.377115 \tabularnewline
28 & -0.03387 & -0.3086 & 0.379212 \tabularnewline
29 & -0.03304 & -0.301 & 0.382079 \tabularnewline
30 & -0.031956 & -0.2911 & 0.385837 \tabularnewline
31 & -0.030581 & -0.2786 & 0.390622 \tabularnewline
32 & -0.028872 & -0.263 & 0.396586 \tabularnewline
33 & -0.026787 & -0.244 & 0.4039 \tabularnewline
34 & -0.02446 & -0.2228 & 0.412105 \tabularnewline
35 & -0.044651 & -0.4068 & 0.342605 \tabularnewline
36 & 0.281286 & 2.5626 & 0.006097 \tabularnewline
37 & 0.014493 & 0.132 & 0.447636 \tabularnewline
38 & 0.011636 & 0.106 & 0.457916 \tabularnewline
39 & 0.015671 & 0.1428 & 0.44341 \tabularnewline
40 & 0.020132 & 0.1834 & 0.42746 \tabularnewline
41 & 0.024989 & 0.2277 & 0.410235 \tabularnewline
42 & 0.030275 & 0.2758 & 0.391687 \tabularnewline
43 & 0.036033 & 0.3283 & 0.371765 \tabularnewline
44 & 0.04232 & 0.3856 & 0.350408 \tabularnewline
45 & 0.049219 & 0.4484 & 0.327514 \tabularnewline
46 & 0.056715 & 0.5167 & 0.303371 \tabularnewline
47 & 0.068591 & 0.6249 & 0.266878 \tabularnewline
48 & -0.296377 & -2.7001 & 0.004199 \tabularnewline
\hline
\end{tabular}
%Source: https://freestatistics.org/blog/index.php?pk=31808&T=2

[TABLE]
[ROW][C]Partial Autocorrelation Function[/C][/ROW]
[ROW][C]Time lag k[/C][C]PACF(k)[/C][C]T-STAT[/C][C]P-value[/C][/ROW]
[ROW][C]1[/C][C]-0.054962[/C][C]-0.5007[/C][C]0.308944[/C][/ROW]
[ROW][C]2[/C][C]-0.059[/C][C]-0.5375[/C][C]0.296176[/C][/ROW]
[ROW][C]3[/C][C]-0.063542[/C][C]-0.5789[/C][C]0.282114[/C][/ROW]
[ROW][C]4[/C][C]-0.068699[/C][C]-0.6259[/C][C]0.266557[/C][/ROW]
[ROW][C]5[/C][C]-0.074614[/C][C]-0.6798[/C][C]0.249273[/C][/ROW]
[ROW][C]6[/C][C]-0.081479[/C][C]-0.7423[/C][C]0.229997[/C][/ROW]
[ROW][C]7[/C][C]-0.089559[/C][C]-0.8159[/C][C]0.208441[/C][/ROW]
[ROW][C]8[/C][C]-0.099223[/C][C]-0.904[/C][C]0.184316[/C][/ROW]
[ROW][C]9[/C][C]-0.111011[/C][C]-1.0114[/C][C]0.157393[/C][/ROW]
[ROW][C]10[/C][C]-0.125736[/C][C]-1.1455[/C][C]0.127645[/C][/ROW]
[ROW][C]11[/C][C]-0.136366[/C][C]-1.2424[/C][C]0.108802[/C][/ROW]
[ROW][C]12[/C][C]0.388712[/C][C]3.5413[/C][C]0.000328[/C][/ROW]
[ROW][C]13[/C][C]-0.052964[/C][C]-0.4825[/C][C]0.315352[/C][/ROW]
[ROW][C]14[/C][C]-0.057964[/C][C]-0.5281[/C][C]0.299427[/C][/ROW]
[ROW][C]15[/C][C]-0.061395[/C][C]-0.5593[/C][C]0.288719[/C][/ROW]
[ROW][C]16[/C][C]-0.065237[/C][C]-0.5943[/C][C]0.276951[/C][/ROW]
[ROW][C]17[/C][C]-0.069585[/C][C]-0.6339[/C][C]0.263929[/C][/ROW]
[ROW][C]18[/C][C]-0.07455[/C][C]-0.6792[/C][C]0.249455[/C][/ROW]
[ROW][C]19[/C][C]-0.080281[/C][C]-0.7314[/C][C]0.233298[/C][/ROW]
[ROW][C]20[/C][C]-0.086976[/C][C]-0.7924[/C][C]0.215197[/C][/ROW]
[ROW][C]21[/C][C]-0.094907[/C][C]-0.8646[/C][C]0.194864[/C][/ROW]
[ROW][C]22[/C][C]-0.104535[/C][C]-0.9524[/C][C]0.17184[/C][/ROW]
[ROW][C]23[/C][C]-0.10521[/C][C]-0.9585[/C][C]0.170295[/C][/ROW]
[ROW][C]24[/C][C]0.345983[/C][C]3.1521[/C][C]0.001128[/C][/ROW]
[ROW][C]25[/C][C]-0.029256[/C][C]-0.2665[/C][C]0.395246[/C][/ROW]
[ROW][C]26[/C][C]-0.034826[/C][C]-0.3173[/C][C]0.375915[/C][/ROW]
[ROW][C]27[/C][C]-0.034477[/C][C]-0.3141[/C][C]0.377115[/C][/ROW]
[ROW][C]28[/C][C]-0.03387[/C][C]-0.3086[/C][C]0.379212[/C][/ROW]
[ROW][C]29[/C][C]-0.03304[/C][C]-0.301[/C][C]0.382079[/C][/ROW]
[ROW][C]30[/C][C]-0.031956[/C][C]-0.2911[/C][C]0.385837[/C][/ROW]
[ROW][C]31[/C][C]-0.030581[/C][C]-0.2786[/C][C]0.390622[/C][/ROW]
[ROW][C]32[/C][C]-0.028872[/C][C]-0.263[/C][C]0.396586[/C][/ROW]
[ROW][C]33[/C][C]-0.026787[/C][C]-0.244[/C][C]0.4039[/C][/ROW]
[ROW][C]34[/C][C]-0.02446[/C][C]-0.2228[/C][C]0.412105[/C][/ROW]
[ROW][C]35[/C][C]-0.044651[/C][C]-0.4068[/C][C]0.342605[/C][/ROW]
[ROW][C]36[/C][C]0.281286[/C][C]2.5626[/C][C]0.006097[/C][/ROW]
[ROW][C]37[/C][C]0.014493[/C][C]0.132[/C][C]0.447636[/C][/ROW]
[ROW][C]38[/C][C]0.011636[/C][C]0.106[/C][C]0.457916[/C][/ROW]
[ROW][C]39[/C][C]0.015671[/C][C]0.1428[/C][C]0.44341[/C][/ROW]
[ROW][C]40[/C][C]0.020132[/C][C]0.1834[/C][C]0.42746[/C][/ROW]
[ROW][C]41[/C][C]0.024989[/C][C]0.2277[/C][C]0.410235[/C][/ROW]
[ROW][C]42[/C][C]0.030275[/C][C]0.2758[/C][C]0.391687[/C][/ROW]
[ROW][C]43[/C][C]0.036033[/C][C]0.3283[/C][C]0.371765[/C][/ROW]
[ROW][C]44[/C][C]0.04232[/C][C]0.3856[/C][C]0.350408[/C][/ROW]
[ROW][C]45[/C][C]0.049219[/C][C]0.4484[/C][C]0.327514[/C][/ROW]
[ROW][C]46[/C][C]0.056715[/C][C]0.5167[/C][C]0.303371[/C][/ROW]
[ROW][C]47[/C][C]0.068591[/C][C]0.6249[/C][C]0.266878[/C][/ROW]
[ROW][C]48[/C][C]-0.296377[/C][C]-2.7001[/C][C]0.004199[/C][/ROW]
[/TABLE]
Source: https://freestatistics.org/blog/index.php?pk=31808&T=2

Globally Unique Identifier (entire table): ba.freestatistics.org/blog/index.php?pk=31808&T=2

As an alternative you can also use a QR Code:  

The GUIDs for individual cells are displayed in the table below:

Partial Autocorrelation Function
Time lag kPACF(k)T-STATP-value
1-0.054962-0.50070.308944
2-0.059-0.53750.296176
3-0.063542-0.57890.282114
4-0.068699-0.62590.266557
5-0.074614-0.67980.249273
6-0.081479-0.74230.229997
7-0.089559-0.81590.208441
8-0.099223-0.9040.184316
9-0.111011-1.01140.157393
10-0.125736-1.14550.127645
11-0.136366-1.24240.108802
120.3887123.54130.000328
13-0.052964-0.48250.315352
14-0.057964-0.52810.299427
15-0.061395-0.55930.288719
16-0.065237-0.59430.276951
17-0.069585-0.63390.263929
18-0.07455-0.67920.249455
19-0.080281-0.73140.233298
20-0.086976-0.79240.215197
21-0.094907-0.86460.194864
22-0.104535-0.95240.17184
23-0.10521-0.95850.170295
240.3459833.15210.001128
25-0.029256-0.26650.395246
26-0.034826-0.31730.375915
27-0.034477-0.31410.377115
28-0.03387-0.30860.379212
29-0.03304-0.3010.382079
30-0.031956-0.29110.385837
31-0.030581-0.27860.390622
32-0.028872-0.2630.396586
33-0.026787-0.2440.4039
34-0.02446-0.22280.412105
35-0.044651-0.40680.342605
360.2812862.56260.006097
370.0144930.1320.447636
380.0116360.1060.457916
390.0156710.14280.44341
400.0201320.18340.42746
410.0249890.22770.410235
420.0302750.27580.391687
430.0360330.32830.371765
440.042320.38560.350408
450.0492190.44840.327514
460.0567150.51670.303371
470.0685910.62490.266878
48-0.296377-2.70010.004199


Parameters (Session):
par1 = 48 ; par2 = 1 ; par3 = 1 ; par4 = 0 ; par5 = 12 ;
Parameters (R input):
par1 = 48 ; par2 = 1 ; par3 = 1 ; par4 = 0 ; par5 = 12 ;
R code (references can be found in the software module):
if (par1 == 'Default') {
par1 = 10*log10(length(x))
} else {
par1 <- as.numeric(par1)
}
par2 <- as.numeric(par2)
par3 <- as.numeric(par3)
par4 <- as.numeric(par4)
par5 <- as.numeric(par5)
if (par2 == 0) {
x <- log(x)
} else {
x <- (x ^ par2 - 1) / par2
}
if (par3 > 0) x <- diff(x,lag=1,difference=par3)
if (par4 > 0) x <- diff(x,lag=par5,difference=par4)
bitmap(file='pic1.png')
racf <- acf(x,par1,main='Autocorrelation',xlab='lags',ylab='ACF')
dev.off()
bitmap(file='pic2.png')
rpacf <- pacf(x,par1,main='Partial Autocorrelation',xlab='lags',ylab='PACF')
dev.off()
(myacf <- c(racf$acf))
(mypacf <- c(rpacf$acf))
lengthx <- length(x)
sqrtn <- sqrt(lengthx)
load(file='createtable')
a<-table.start()
a<-table.row.start(a)
a<-table.element(a,'Autocorrelation Function',4,TRUE)
a<-table.row.end(a)
a<-table.row.start(a)
a<-table.element(a,'Time lag k',header=TRUE)
a<-table.element(a,hyperlink('basics.htm','ACF(k)','click here for more information about the Autocorrelation Function'),header=TRUE)
a<-table.element(a,'T-STAT',header=TRUE)
a<-table.element(a,'P-value',header=TRUE)
a<-table.row.end(a)
for (i in 2:(par1+1)) {
a<-table.row.start(a)
a<-table.element(a,i-1,header=TRUE)
a<-table.element(a,round(myacf[i],6))
mytstat <- myacf[i]*sqrtn
a<-table.element(a,round(mytstat,4))
a<-table.element(a,round(1-pt(abs(mytstat),lengthx),6))
a<-table.row.end(a)
}
a<-table.end(a)
table.save(a,file='mytable.tab')
a<-table.start()
a<-table.row.start(a)
a<-table.element(a,'Partial Autocorrelation Function',4,TRUE)
a<-table.row.end(a)
a<-table.row.start(a)
a<-table.element(a,'Time lag k',header=TRUE)
a<-table.element(a,hyperlink('basics.htm','PACF(k)','click here for more information about the Partial Autocorrelation Function'),header=TRUE)
a<-table.element(a,'T-STAT',header=TRUE)
a<-table.element(a,'P-value',header=TRUE)
a<-table.row.end(a)
for (i in 1:par1) {
a<-table.row.start(a)
a<-table.element(a,i,header=TRUE)
a<-table.element(a,round(mypacf[i],6))
mytstat <- mypacf[i]*sqrtn
a<-table.element(a,round(mytstat,4))
a<-table.element(a,round(1-pt(abs(mytstat),lengthx),6))
a<-table.row.end(a)
}
a<-table.end(a)
table.save(a,file='mytable1.tab')