Free Statistics

of Irreproducible Research!

Author's title

Author*Unverified author*
R Software Modulerwasp_autocorrelation.wasp
Title produced by software(Partial) Autocorrelation Function
Date of computationTue, 09 Dec 2008 14:31:53 -0700
Cite this page as followsStatistical Computations at FreeStatistics.org, Office for Research Development and Education, URL https://freestatistics.org/blog/index.php?v=date/2008/Dec/09/t1228858336ljc2woxbnzqwip7.htm/, Retrieved Sun, 19 May 2024 11:29:22 +0000
Statistical Computations at FreeStatistics.org, Office for Research Development and Education, URL https://freestatistics.org/blog/index.php?pk=31806, Retrieved Sun, 19 May 2024 11:29:22 +0000
QR Codes:

Original text written by user:
IsPrivate?No (this computation is public)
User-defined keywords
Estimated Impact146
Family? (F = Feedback message, R = changed R code, M = changed R Module, P = changed Parameters, D = changed Data)
F       [(Partial) Autocorrelation Function] [] [2008-12-09 21:31:53] [d41d8cd98f00b204e9800998ecf8427e] [Current]
Feedback Forum
2008-12-16 20:26:34 [Peter Van Doninck] [reply
Correcte berekening en duidelijk weergegeven dat de seizoenale trend hier ook verdwenen is.

Post a new message
Dataseries X:
123.9
124.9
112.7
121.9
100.6
104.3
120.4
107.5
102.9
125.6
107.5
108.8
128.4
121.1
119.5
128.7
108.7
105.5
119.8
111.3
110.6
120.1
97.5
107.7
127.3
117.2
119.8
116.2
111
112.4
130.6
109.1
118.8
123.9
101.6
112.8
128
129.6
125.8
119.5
115.7
113.6
129.7
112
116.8
127
112.1
114.2
121.1
131.6
125
120.4
117.7
117.5
120.6
127.5
112.3
124.5
115.2
105.4


Summary of computational transaction
Raw Inputview raw input (R code)
Raw Outputview raw output of R engine
Computing time1 seconds
R Server'Gwilym Jenkins' @ 72.249.127.135

\begin{tabular}{lllllllll}
\hline
Summary of computational transaction \tabularnewline
Raw Input & view raw input (R code)  \tabularnewline
Raw Output & view raw output of R engine  \tabularnewline
Computing time & 1 seconds \tabularnewline
R Server & 'Gwilym Jenkins' @ 72.249.127.135 \tabularnewline
\hline
\end{tabular}
%Source: https://freestatistics.org/blog/index.php?pk=31806&T=0

[TABLE]
[ROW][C]Summary of computational transaction[/C][/ROW]
[ROW][C]Raw Input[/C][C]view raw input (R code) [/C][/ROW]
[ROW][C]Raw Output[/C][C]view raw output of R engine [/C][/ROW]
[ROW][C]Computing time[/C][C]1 seconds[/C][/ROW]
[ROW][C]R Server[/C][C]'Gwilym Jenkins' @ 72.249.127.135[/C][/ROW]
[/TABLE]
Source: https://freestatistics.org/blog/index.php?pk=31806&T=0

Globally Unique Identifier (entire table): ba.freestatistics.org/blog/index.php?pk=31806&T=0

As an alternative you can also use a QR Code:  

The GUIDs for individual cells are displayed in the table below:

Summary of computational transaction
Raw Inputview raw input (R code)
Raw Outputview raw output of R engine
Computing time1 seconds
R Server'Gwilym Jenkins' @ 72.249.127.135


Autocorrelation Function
Time lag kACF(k)T-STATP-value
1-0.035137-0.24340.404353
20.050580.35040.363776
30.1247870.86450.195793
40.0190120.13170.447877
50.0964430.66820.253611
60.0533780.36980.356574
7-0.244019-1.69060.048698
8-0.105922-0.73390.233305
90.1581851.09590.139287
10-0.166878-1.15620.126668
11-0.222869-1.54410.064568
12-0.084027-0.58220.281593
13-0.180632-1.25150.108416
140.0383840.26590.395715
15-0.040491-0.28050.390139
16-0.076441-0.52960.299417
170.0464610.32190.374466
180.0914690.63370.264637
19-0.197767-1.37020.088505
200.011240.07790.469127
210.0701850.48630.314498
22-0.085718-0.59390.277692
230.1970231.3650.089306
24-0.200038-1.38590.086091
250.0278850.19320.423812
260.096450.66820.253596
270.0456140.3160.376677
28-0.143708-0.99560.162209
290.0281460.1950.423108
30-0.00204-0.01410.494391
310.0260890.18080.428662
320.143960.99740.16179
33-0.074895-0.51890.303112
34-0.033967-0.23530.407477
350.1251020.86670.195201
360.0099080.06860.472779
370.045280.31370.377551
380.0143830.09960.460519
39-0.003919-0.02720.489225
40-0.036448-0.25250.400859
410.0623830.43220.333764
42-0.089955-0.62320.268044
43-0.004994-0.03460.486272
44-0.025773-0.17860.429517
45-0.045761-0.3170.376293
460.0376410.26080.397688
47-0.018591-0.12880.449027
48NANANA
49NANANA
50NANANA
51NANANA
52NANANA
53NANANA
54NANANA
55NANANA
56NANANA
57NANANA
58NANANA
59NANANA
60NANANA

\begin{tabular}{lllllllll}
\hline
Autocorrelation Function \tabularnewline
Time lag k & ACF(k) & T-STAT & P-value \tabularnewline
1 & -0.035137 & -0.2434 & 0.404353 \tabularnewline
2 & 0.05058 & 0.3504 & 0.363776 \tabularnewline
3 & 0.124787 & 0.8645 & 0.195793 \tabularnewline
4 & 0.019012 & 0.1317 & 0.447877 \tabularnewline
5 & 0.096443 & 0.6682 & 0.253611 \tabularnewline
6 & 0.053378 & 0.3698 & 0.356574 \tabularnewline
7 & -0.244019 & -1.6906 & 0.048698 \tabularnewline
8 & -0.105922 & -0.7339 & 0.233305 \tabularnewline
9 & 0.158185 & 1.0959 & 0.139287 \tabularnewline
10 & -0.166878 & -1.1562 & 0.126668 \tabularnewline
11 & -0.222869 & -1.5441 & 0.064568 \tabularnewline
12 & -0.084027 & -0.5822 & 0.281593 \tabularnewline
13 & -0.180632 & -1.2515 & 0.108416 \tabularnewline
14 & 0.038384 & 0.2659 & 0.395715 \tabularnewline
15 & -0.040491 & -0.2805 & 0.390139 \tabularnewline
16 & -0.076441 & -0.5296 & 0.299417 \tabularnewline
17 & 0.046461 & 0.3219 & 0.374466 \tabularnewline
18 & 0.091469 & 0.6337 & 0.264637 \tabularnewline
19 & -0.197767 & -1.3702 & 0.088505 \tabularnewline
20 & 0.01124 & 0.0779 & 0.469127 \tabularnewline
21 & 0.070185 & 0.4863 & 0.314498 \tabularnewline
22 & -0.085718 & -0.5939 & 0.277692 \tabularnewline
23 & 0.197023 & 1.365 & 0.089306 \tabularnewline
24 & -0.200038 & -1.3859 & 0.086091 \tabularnewline
25 & 0.027885 & 0.1932 & 0.423812 \tabularnewline
26 & 0.09645 & 0.6682 & 0.253596 \tabularnewline
27 & 0.045614 & 0.316 & 0.376677 \tabularnewline
28 & -0.143708 & -0.9956 & 0.162209 \tabularnewline
29 & 0.028146 & 0.195 & 0.423108 \tabularnewline
30 & -0.00204 & -0.0141 & 0.494391 \tabularnewline
31 & 0.026089 & 0.1808 & 0.428662 \tabularnewline
32 & 0.14396 & 0.9974 & 0.16179 \tabularnewline
33 & -0.074895 & -0.5189 & 0.303112 \tabularnewline
34 & -0.033967 & -0.2353 & 0.407477 \tabularnewline
35 & 0.125102 & 0.8667 & 0.195201 \tabularnewline
36 & 0.009908 & 0.0686 & 0.472779 \tabularnewline
37 & 0.04528 & 0.3137 & 0.377551 \tabularnewline
38 & 0.014383 & 0.0996 & 0.460519 \tabularnewline
39 & -0.003919 & -0.0272 & 0.489225 \tabularnewline
40 & -0.036448 & -0.2525 & 0.400859 \tabularnewline
41 & 0.062383 & 0.4322 & 0.333764 \tabularnewline
42 & -0.089955 & -0.6232 & 0.268044 \tabularnewline
43 & -0.004994 & -0.0346 & 0.486272 \tabularnewline
44 & -0.025773 & -0.1786 & 0.429517 \tabularnewline
45 & -0.045761 & -0.317 & 0.376293 \tabularnewline
46 & 0.037641 & 0.2608 & 0.397688 \tabularnewline
47 & -0.018591 & -0.1288 & 0.449027 \tabularnewline
48 & NA & NA & NA \tabularnewline
49 & NA & NA & NA \tabularnewline
50 & NA & NA & NA \tabularnewline
51 & NA & NA & NA \tabularnewline
52 & NA & NA & NA \tabularnewline
53 & NA & NA & NA \tabularnewline
54 & NA & NA & NA \tabularnewline
55 & NA & NA & NA \tabularnewline
56 & NA & NA & NA \tabularnewline
57 & NA & NA & NA \tabularnewline
58 & NA & NA & NA \tabularnewline
59 & NA & NA & NA \tabularnewline
60 & NA & NA & NA \tabularnewline
\hline
\end{tabular}
%Source: https://freestatistics.org/blog/index.php?pk=31806&T=1

[TABLE]
[ROW][C]Autocorrelation Function[/C][/ROW]
[ROW][C]Time lag k[/C][C]ACF(k)[/C][C]T-STAT[/C][C]P-value[/C][/ROW]
[ROW][C]1[/C][C]-0.035137[/C][C]-0.2434[/C][C]0.404353[/C][/ROW]
[ROW][C]2[/C][C]0.05058[/C][C]0.3504[/C][C]0.363776[/C][/ROW]
[ROW][C]3[/C][C]0.124787[/C][C]0.8645[/C][C]0.195793[/C][/ROW]
[ROW][C]4[/C][C]0.019012[/C][C]0.1317[/C][C]0.447877[/C][/ROW]
[ROW][C]5[/C][C]0.096443[/C][C]0.6682[/C][C]0.253611[/C][/ROW]
[ROW][C]6[/C][C]0.053378[/C][C]0.3698[/C][C]0.356574[/C][/ROW]
[ROW][C]7[/C][C]-0.244019[/C][C]-1.6906[/C][C]0.048698[/C][/ROW]
[ROW][C]8[/C][C]-0.105922[/C][C]-0.7339[/C][C]0.233305[/C][/ROW]
[ROW][C]9[/C][C]0.158185[/C][C]1.0959[/C][C]0.139287[/C][/ROW]
[ROW][C]10[/C][C]-0.166878[/C][C]-1.1562[/C][C]0.126668[/C][/ROW]
[ROW][C]11[/C][C]-0.222869[/C][C]-1.5441[/C][C]0.064568[/C][/ROW]
[ROW][C]12[/C][C]-0.084027[/C][C]-0.5822[/C][C]0.281593[/C][/ROW]
[ROW][C]13[/C][C]-0.180632[/C][C]-1.2515[/C][C]0.108416[/C][/ROW]
[ROW][C]14[/C][C]0.038384[/C][C]0.2659[/C][C]0.395715[/C][/ROW]
[ROW][C]15[/C][C]-0.040491[/C][C]-0.2805[/C][C]0.390139[/C][/ROW]
[ROW][C]16[/C][C]-0.076441[/C][C]-0.5296[/C][C]0.299417[/C][/ROW]
[ROW][C]17[/C][C]0.046461[/C][C]0.3219[/C][C]0.374466[/C][/ROW]
[ROW][C]18[/C][C]0.091469[/C][C]0.6337[/C][C]0.264637[/C][/ROW]
[ROW][C]19[/C][C]-0.197767[/C][C]-1.3702[/C][C]0.088505[/C][/ROW]
[ROW][C]20[/C][C]0.01124[/C][C]0.0779[/C][C]0.469127[/C][/ROW]
[ROW][C]21[/C][C]0.070185[/C][C]0.4863[/C][C]0.314498[/C][/ROW]
[ROW][C]22[/C][C]-0.085718[/C][C]-0.5939[/C][C]0.277692[/C][/ROW]
[ROW][C]23[/C][C]0.197023[/C][C]1.365[/C][C]0.089306[/C][/ROW]
[ROW][C]24[/C][C]-0.200038[/C][C]-1.3859[/C][C]0.086091[/C][/ROW]
[ROW][C]25[/C][C]0.027885[/C][C]0.1932[/C][C]0.423812[/C][/ROW]
[ROW][C]26[/C][C]0.09645[/C][C]0.6682[/C][C]0.253596[/C][/ROW]
[ROW][C]27[/C][C]0.045614[/C][C]0.316[/C][C]0.376677[/C][/ROW]
[ROW][C]28[/C][C]-0.143708[/C][C]-0.9956[/C][C]0.162209[/C][/ROW]
[ROW][C]29[/C][C]0.028146[/C][C]0.195[/C][C]0.423108[/C][/ROW]
[ROW][C]30[/C][C]-0.00204[/C][C]-0.0141[/C][C]0.494391[/C][/ROW]
[ROW][C]31[/C][C]0.026089[/C][C]0.1808[/C][C]0.428662[/C][/ROW]
[ROW][C]32[/C][C]0.14396[/C][C]0.9974[/C][C]0.16179[/C][/ROW]
[ROW][C]33[/C][C]-0.074895[/C][C]-0.5189[/C][C]0.303112[/C][/ROW]
[ROW][C]34[/C][C]-0.033967[/C][C]-0.2353[/C][C]0.407477[/C][/ROW]
[ROW][C]35[/C][C]0.125102[/C][C]0.8667[/C][C]0.195201[/C][/ROW]
[ROW][C]36[/C][C]0.009908[/C][C]0.0686[/C][C]0.472779[/C][/ROW]
[ROW][C]37[/C][C]0.04528[/C][C]0.3137[/C][C]0.377551[/C][/ROW]
[ROW][C]38[/C][C]0.014383[/C][C]0.0996[/C][C]0.460519[/C][/ROW]
[ROW][C]39[/C][C]-0.003919[/C][C]-0.0272[/C][C]0.489225[/C][/ROW]
[ROW][C]40[/C][C]-0.036448[/C][C]-0.2525[/C][C]0.400859[/C][/ROW]
[ROW][C]41[/C][C]0.062383[/C][C]0.4322[/C][C]0.333764[/C][/ROW]
[ROW][C]42[/C][C]-0.089955[/C][C]-0.6232[/C][C]0.268044[/C][/ROW]
[ROW][C]43[/C][C]-0.004994[/C][C]-0.0346[/C][C]0.486272[/C][/ROW]
[ROW][C]44[/C][C]-0.025773[/C][C]-0.1786[/C][C]0.429517[/C][/ROW]
[ROW][C]45[/C][C]-0.045761[/C][C]-0.317[/C][C]0.376293[/C][/ROW]
[ROW][C]46[/C][C]0.037641[/C][C]0.2608[/C][C]0.397688[/C][/ROW]
[ROW][C]47[/C][C]-0.018591[/C][C]-0.1288[/C][C]0.449027[/C][/ROW]
[ROW][C]48[/C][C]NA[/C][C]NA[/C][C]NA[/C][/ROW]
[ROW][C]49[/C][C]NA[/C][C]NA[/C][C]NA[/C][/ROW]
[ROW][C]50[/C][C]NA[/C][C]NA[/C][C]NA[/C][/ROW]
[ROW][C]51[/C][C]NA[/C][C]NA[/C][C]NA[/C][/ROW]
[ROW][C]52[/C][C]NA[/C][C]NA[/C][C]NA[/C][/ROW]
[ROW][C]53[/C][C]NA[/C][C]NA[/C][C]NA[/C][/ROW]
[ROW][C]54[/C][C]NA[/C][C]NA[/C][C]NA[/C][/ROW]
[ROW][C]55[/C][C]NA[/C][C]NA[/C][C]NA[/C][/ROW]
[ROW][C]56[/C][C]NA[/C][C]NA[/C][C]NA[/C][/ROW]
[ROW][C]57[/C][C]NA[/C][C]NA[/C][C]NA[/C][/ROW]
[ROW][C]58[/C][C]NA[/C][C]NA[/C][C]NA[/C][/ROW]
[ROW][C]59[/C][C]NA[/C][C]NA[/C][C]NA[/C][/ROW]
[ROW][C]60[/C][C]NA[/C][C]NA[/C][C]NA[/C][/ROW]
[/TABLE]
Source: https://freestatistics.org/blog/index.php?pk=31806&T=1

Globally Unique Identifier (entire table): ba.freestatistics.org/blog/index.php?pk=31806&T=1

As an alternative you can also use a QR Code:  

The GUIDs for individual cells are displayed in the table below:

Autocorrelation Function
Time lag kACF(k)T-STATP-value
1-0.035137-0.24340.404353
20.050580.35040.363776
30.1247870.86450.195793
40.0190120.13170.447877
50.0964430.66820.253611
60.0533780.36980.356574
7-0.244019-1.69060.048698
8-0.105922-0.73390.233305
90.1581851.09590.139287
10-0.166878-1.15620.126668
11-0.222869-1.54410.064568
12-0.084027-0.58220.281593
13-0.180632-1.25150.108416
140.0383840.26590.395715
15-0.040491-0.28050.390139
16-0.076441-0.52960.299417
170.0464610.32190.374466
180.0914690.63370.264637
19-0.197767-1.37020.088505
200.011240.07790.469127
210.0701850.48630.314498
22-0.085718-0.59390.277692
230.1970231.3650.089306
24-0.200038-1.38590.086091
250.0278850.19320.423812
260.096450.66820.253596
270.0456140.3160.376677
28-0.143708-0.99560.162209
290.0281460.1950.423108
30-0.00204-0.01410.494391
310.0260890.18080.428662
320.143960.99740.16179
33-0.074895-0.51890.303112
34-0.033967-0.23530.407477
350.1251020.86670.195201
360.0099080.06860.472779
370.045280.31370.377551
380.0143830.09960.460519
39-0.003919-0.02720.489225
40-0.036448-0.25250.400859
410.0623830.43220.333764
42-0.089955-0.62320.268044
43-0.004994-0.03460.486272
44-0.025773-0.17860.429517
45-0.045761-0.3170.376293
460.0376410.26080.397688
47-0.018591-0.12880.449027
48NANANA
49NANANA
50NANANA
51NANANA
52NANANA
53NANANA
54NANANA
55NANANA
56NANANA
57NANANA
58NANANA
59NANANA
60NANANA


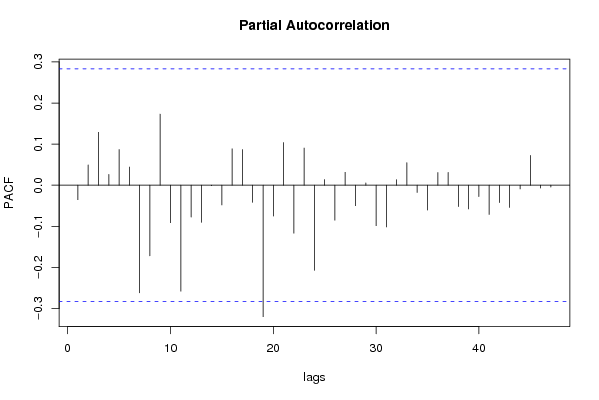
Partial Autocorrelation Function
Time lag kPACF(k)T-STATP-value
1-0.035137-0.24340.404353
20.0494060.34230.366811
30.1286850.89160.18854
40.026310.18230.428066
50.0869120.60210.274955
60.0441380.30580.38054
7-0.261855-1.81420.037951
8-0.171632-1.18910.120125
90.1729941.19850.118296
10-0.091017-0.63060.265652
11-0.257968-1.78730.040106
12-0.07739-0.53620.297157
13-0.090139-0.62450.267628
14-0.000983-0.00680.497296
15-0.047828-0.33140.370906
160.0886780.61440.270933
170.0867990.60140.275215
18-0.04158-0.28810.387264
19-0.31977-2.21540.015754
20-0.074994-0.51960.302875
210.1039450.72020.237462
22-0.116829-0.80940.211136
230.0904350.62660.26696
24-0.207041-1.43440.078967
250.0138930.09630.461859
26-0.085059-0.58930.279209
270.0315220.21840.414027
28-0.049877-0.34560.365591
290.0054570.03780.485
30-0.098576-0.6830.248959
31-0.10147-0.7030.242723
320.0135620.0940.462766
330.054750.37930.353062
34-0.017566-0.12170.451822
35-0.060344-0.41810.338877
360.0306980.21270.416237
370.0312160.21630.414846
38-0.052046-0.36060.359996
39-0.057821-0.40060.345247
40-0.027595-0.19120.424594
41-0.071117-0.49270.312232
42-0.042164-0.29210.385727
43-0.054062-0.37460.354821
44-0.008909-0.06170.475519
450.0725410.50260.30878
46-0.007017-0.04860.480713
47-0.004544-0.03150.487509
48NANANA
49NANANA
50NANANA
51NANANA
52NANANA
53NANANA
54NANANA
55NANANA
56NANANA
57NANANA
58NANANA
59NANANA
60NANANA

\begin{tabular}{lllllllll}
\hline
Partial Autocorrelation Function \tabularnewline
Time lag k & PACF(k) & T-STAT & P-value \tabularnewline
1 & -0.035137 & -0.2434 & 0.404353 \tabularnewline
2 & 0.049406 & 0.3423 & 0.366811 \tabularnewline
3 & 0.128685 & 0.8916 & 0.18854 \tabularnewline
4 & 0.02631 & 0.1823 & 0.428066 \tabularnewline
5 & 0.086912 & 0.6021 & 0.274955 \tabularnewline
6 & 0.044138 & 0.3058 & 0.38054 \tabularnewline
7 & -0.261855 & -1.8142 & 0.037951 \tabularnewline
8 & -0.171632 & -1.1891 & 0.120125 \tabularnewline
9 & 0.172994 & 1.1985 & 0.118296 \tabularnewline
10 & -0.091017 & -0.6306 & 0.265652 \tabularnewline
11 & -0.257968 & -1.7873 & 0.040106 \tabularnewline
12 & -0.07739 & -0.5362 & 0.297157 \tabularnewline
13 & -0.090139 & -0.6245 & 0.267628 \tabularnewline
14 & -0.000983 & -0.0068 & 0.497296 \tabularnewline
15 & -0.047828 & -0.3314 & 0.370906 \tabularnewline
16 & 0.088678 & 0.6144 & 0.270933 \tabularnewline
17 & 0.086799 & 0.6014 & 0.275215 \tabularnewline
18 & -0.04158 & -0.2881 & 0.387264 \tabularnewline
19 & -0.31977 & -2.2154 & 0.015754 \tabularnewline
20 & -0.074994 & -0.5196 & 0.302875 \tabularnewline
21 & 0.103945 & 0.7202 & 0.237462 \tabularnewline
22 & -0.116829 & -0.8094 & 0.211136 \tabularnewline
23 & 0.090435 & 0.6266 & 0.26696 \tabularnewline
24 & -0.207041 & -1.4344 & 0.078967 \tabularnewline
25 & 0.013893 & 0.0963 & 0.461859 \tabularnewline
26 & -0.085059 & -0.5893 & 0.279209 \tabularnewline
27 & 0.031522 & 0.2184 & 0.414027 \tabularnewline
28 & -0.049877 & -0.3456 & 0.365591 \tabularnewline
29 & 0.005457 & 0.0378 & 0.485 \tabularnewline
30 & -0.098576 & -0.683 & 0.248959 \tabularnewline
31 & -0.10147 & -0.703 & 0.242723 \tabularnewline
32 & 0.013562 & 0.094 & 0.462766 \tabularnewline
33 & 0.05475 & 0.3793 & 0.353062 \tabularnewline
34 & -0.017566 & -0.1217 & 0.451822 \tabularnewline
35 & -0.060344 & -0.4181 & 0.338877 \tabularnewline
36 & 0.030698 & 0.2127 & 0.416237 \tabularnewline
37 & 0.031216 & 0.2163 & 0.414846 \tabularnewline
38 & -0.052046 & -0.3606 & 0.359996 \tabularnewline
39 & -0.057821 & -0.4006 & 0.345247 \tabularnewline
40 & -0.027595 & -0.1912 & 0.424594 \tabularnewline
41 & -0.071117 & -0.4927 & 0.312232 \tabularnewline
42 & -0.042164 & -0.2921 & 0.385727 \tabularnewline
43 & -0.054062 & -0.3746 & 0.354821 \tabularnewline
44 & -0.008909 & -0.0617 & 0.475519 \tabularnewline
45 & 0.072541 & 0.5026 & 0.30878 \tabularnewline
46 & -0.007017 & -0.0486 & 0.480713 \tabularnewline
47 & -0.004544 & -0.0315 & 0.487509 \tabularnewline
48 & NA & NA & NA \tabularnewline
49 & NA & NA & NA \tabularnewline
50 & NA & NA & NA \tabularnewline
51 & NA & NA & NA \tabularnewline
52 & NA & NA & NA \tabularnewline
53 & NA & NA & NA \tabularnewline
54 & NA & NA & NA \tabularnewline
55 & NA & NA & NA \tabularnewline
56 & NA & NA & NA \tabularnewline
57 & NA & NA & NA \tabularnewline
58 & NA & NA & NA \tabularnewline
59 & NA & NA & NA \tabularnewline
60 & NA & NA & NA \tabularnewline
\hline
\end{tabular}
%Source: https://freestatistics.org/blog/index.php?pk=31806&T=2

[TABLE]
[ROW][C]Partial Autocorrelation Function[/C][/ROW]
[ROW][C]Time lag k[/C][C]PACF(k)[/C][C]T-STAT[/C][C]P-value[/C][/ROW]
[ROW][C]1[/C][C]-0.035137[/C][C]-0.2434[/C][C]0.404353[/C][/ROW]
[ROW][C]2[/C][C]0.049406[/C][C]0.3423[/C][C]0.366811[/C][/ROW]
[ROW][C]3[/C][C]0.128685[/C][C]0.8916[/C][C]0.18854[/C][/ROW]
[ROW][C]4[/C][C]0.02631[/C][C]0.1823[/C][C]0.428066[/C][/ROW]
[ROW][C]5[/C][C]0.086912[/C][C]0.6021[/C][C]0.274955[/C][/ROW]
[ROW][C]6[/C][C]0.044138[/C][C]0.3058[/C][C]0.38054[/C][/ROW]
[ROW][C]7[/C][C]-0.261855[/C][C]-1.8142[/C][C]0.037951[/C][/ROW]
[ROW][C]8[/C][C]-0.171632[/C][C]-1.1891[/C][C]0.120125[/C][/ROW]
[ROW][C]9[/C][C]0.172994[/C][C]1.1985[/C][C]0.118296[/C][/ROW]
[ROW][C]10[/C][C]-0.091017[/C][C]-0.6306[/C][C]0.265652[/C][/ROW]
[ROW][C]11[/C][C]-0.257968[/C][C]-1.7873[/C][C]0.040106[/C][/ROW]
[ROW][C]12[/C][C]-0.07739[/C][C]-0.5362[/C][C]0.297157[/C][/ROW]
[ROW][C]13[/C][C]-0.090139[/C][C]-0.6245[/C][C]0.267628[/C][/ROW]
[ROW][C]14[/C][C]-0.000983[/C][C]-0.0068[/C][C]0.497296[/C][/ROW]
[ROW][C]15[/C][C]-0.047828[/C][C]-0.3314[/C][C]0.370906[/C][/ROW]
[ROW][C]16[/C][C]0.088678[/C][C]0.6144[/C][C]0.270933[/C][/ROW]
[ROW][C]17[/C][C]0.086799[/C][C]0.6014[/C][C]0.275215[/C][/ROW]
[ROW][C]18[/C][C]-0.04158[/C][C]-0.2881[/C][C]0.387264[/C][/ROW]
[ROW][C]19[/C][C]-0.31977[/C][C]-2.2154[/C][C]0.015754[/C][/ROW]
[ROW][C]20[/C][C]-0.074994[/C][C]-0.5196[/C][C]0.302875[/C][/ROW]
[ROW][C]21[/C][C]0.103945[/C][C]0.7202[/C][C]0.237462[/C][/ROW]
[ROW][C]22[/C][C]-0.116829[/C][C]-0.8094[/C][C]0.211136[/C][/ROW]
[ROW][C]23[/C][C]0.090435[/C][C]0.6266[/C][C]0.26696[/C][/ROW]
[ROW][C]24[/C][C]-0.207041[/C][C]-1.4344[/C][C]0.078967[/C][/ROW]
[ROW][C]25[/C][C]0.013893[/C][C]0.0963[/C][C]0.461859[/C][/ROW]
[ROW][C]26[/C][C]-0.085059[/C][C]-0.5893[/C][C]0.279209[/C][/ROW]
[ROW][C]27[/C][C]0.031522[/C][C]0.2184[/C][C]0.414027[/C][/ROW]
[ROW][C]28[/C][C]-0.049877[/C][C]-0.3456[/C][C]0.365591[/C][/ROW]
[ROW][C]29[/C][C]0.005457[/C][C]0.0378[/C][C]0.485[/C][/ROW]
[ROW][C]30[/C][C]-0.098576[/C][C]-0.683[/C][C]0.248959[/C][/ROW]
[ROW][C]31[/C][C]-0.10147[/C][C]-0.703[/C][C]0.242723[/C][/ROW]
[ROW][C]32[/C][C]0.013562[/C][C]0.094[/C][C]0.462766[/C][/ROW]
[ROW][C]33[/C][C]0.05475[/C][C]0.3793[/C][C]0.353062[/C][/ROW]
[ROW][C]34[/C][C]-0.017566[/C][C]-0.1217[/C][C]0.451822[/C][/ROW]
[ROW][C]35[/C][C]-0.060344[/C][C]-0.4181[/C][C]0.338877[/C][/ROW]
[ROW][C]36[/C][C]0.030698[/C][C]0.2127[/C][C]0.416237[/C][/ROW]
[ROW][C]37[/C][C]0.031216[/C][C]0.2163[/C][C]0.414846[/C][/ROW]
[ROW][C]38[/C][C]-0.052046[/C][C]-0.3606[/C][C]0.359996[/C][/ROW]
[ROW][C]39[/C][C]-0.057821[/C][C]-0.4006[/C][C]0.345247[/C][/ROW]
[ROW][C]40[/C][C]-0.027595[/C][C]-0.1912[/C][C]0.424594[/C][/ROW]
[ROW][C]41[/C][C]-0.071117[/C][C]-0.4927[/C][C]0.312232[/C][/ROW]
[ROW][C]42[/C][C]-0.042164[/C][C]-0.2921[/C][C]0.385727[/C][/ROW]
[ROW][C]43[/C][C]-0.054062[/C][C]-0.3746[/C][C]0.354821[/C][/ROW]
[ROW][C]44[/C][C]-0.008909[/C][C]-0.0617[/C][C]0.475519[/C][/ROW]
[ROW][C]45[/C][C]0.072541[/C][C]0.5026[/C][C]0.30878[/C][/ROW]
[ROW][C]46[/C][C]-0.007017[/C][C]-0.0486[/C][C]0.480713[/C][/ROW]
[ROW][C]47[/C][C]-0.004544[/C][C]-0.0315[/C][C]0.487509[/C][/ROW]
[ROW][C]48[/C][C]NA[/C][C]NA[/C][C]NA[/C][/ROW]
[ROW][C]49[/C][C]NA[/C][C]NA[/C][C]NA[/C][/ROW]
[ROW][C]50[/C][C]NA[/C][C]NA[/C][C]NA[/C][/ROW]
[ROW][C]51[/C][C]NA[/C][C]NA[/C][C]NA[/C][/ROW]
[ROW][C]52[/C][C]NA[/C][C]NA[/C][C]NA[/C][/ROW]
[ROW][C]53[/C][C]NA[/C][C]NA[/C][C]NA[/C][/ROW]
[ROW][C]54[/C][C]NA[/C][C]NA[/C][C]NA[/C][/ROW]
[ROW][C]55[/C][C]NA[/C][C]NA[/C][C]NA[/C][/ROW]
[ROW][C]56[/C][C]NA[/C][C]NA[/C][C]NA[/C][/ROW]
[ROW][C]57[/C][C]NA[/C][C]NA[/C][C]NA[/C][/ROW]
[ROW][C]58[/C][C]NA[/C][C]NA[/C][C]NA[/C][/ROW]
[ROW][C]59[/C][C]NA[/C][C]NA[/C][C]NA[/C][/ROW]
[ROW][C]60[/C][C]NA[/C][C]NA[/C][C]NA[/C][/ROW]
[/TABLE]
Source: https://freestatistics.org/blog/index.php?pk=31806&T=2

Globally Unique Identifier (entire table): ba.freestatistics.org/blog/index.php?pk=31806&T=2

As an alternative you can also use a QR Code:  

The GUIDs for individual cells are displayed in the table below:

Partial Autocorrelation Function
Time lag kPACF(k)T-STATP-value
1-0.035137-0.24340.404353
20.0494060.34230.366811
30.1286850.89160.18854
40.026310.18230.428066
50.0869120.60210.274955
60.0441380.30580.38054
7-0.261855-1.81420.037951
8-0.171632-1.18910.120125
90.1729941.19850.118296
10-0.091017-0.63060.265652
11-0.257968-1.78730.040106
12-0.07739-0.53620.297157
13-0.090139-0.62450.267628
14-0.000983-0.00680.497296
15-0.047828-0.33140.370906
160.0886780.61440.270933
170.0867990.60140.275215
18-0.04158-0.28810.387264
19-0.31977-2.21540.015754
20-0.074994-0.51960.302875
210.1039450.72020.237462
22-0.116829-0.80940.211136
230.0904350.62660.26696
24-0.207041-1.43440.078967
250.0138930.09630.461859
26-0.085059-0.58930.279209
270.0315220.21840.414027
28-0.049877-0.34560.365591
290.0054570.03780.485
30-0.098576-0.6830.248959
31-0.10147-0.7030.242723
320.0135620.0940.462766
330.054750.37930.353062
34-0.017566-0.12170.451822
35-0.060344-0.41810.338877
360.0306980.21270.416237
370.0312160.21630.414846
38-0.052046-0.36060.359996
39-0.057821-0.40060.345247
40-0.027595-0.19120.424594
41-0.071117-0.49270.312232
42-0.042164-0.29210.385727
43-0.054062-0.37460.354821
44-0.008909-0.06170.475519
450.0725410.50260.30878
46-0.007017-0.04860.480713
47-0.004544-0.03150.487509
48NANANA
49NANANA
50NANANA
51NANANA
52NANANA
53NANANA
54NANANA
55NANANA
56NANANA
57NANANA
58NANANA
59NANANA
60NANANA


Parameters (Session):
par1 = 60 ; par2 = 1 ; par3 = 0 ; par4 = 1 ; par5 = 12 ;
Parameters (R input):
par1 = 60 ; par2 = 1 ; par3 = 0 ; par4 = 1 ; par5 = 12 ;
R code (references can be found in the software module):
if (par1 == 'Default') {
par1 = 10*log10(length(x))
} else {
par1 <- as.numeric(par1)
}
par2 <- as.numeric(par2)
par3 <- as.numeric(par3)
par4 <- as.numeric(par4)
par5 <- as.numeric(par5)
if (par2 == 0) {
x <- log(x)
} else {
x <- (x ^ par2 - 1) / par2
}
if (par3 > 0) x <- diff(x,lag=1,difference=par3)
if (par4 > 0) x <- diff(x,lag=par5,difference=par4)
bitmap(file='pic1.png')
racf <- acf(x,par1,main='Autocorrelation',xlab='lags',ylab='ACF')
dev.off()
bitmap(file='pic2.png')
rpacf <- pacf(x,par1,main='Partial Autocorrelation',xlab='lags',ylab='PACF')
dev.off()
(myacf <- c(racf$acf))
(mypacf <- c(rpacf$acf))
lengthx <- length(x)
sqrtn <- sqrt(lengthx)
load(file='createtable')
a<-table.start()
a<-table.row.start(a)
a<-table.element(a,'Autocorrelation Function',4,TRUE)
a<-table.row.end(a)
a<-table.row.start(a)
a<-table.element(a,'Time lag k',header=TRUE)
a<-table.element(a,hyperlink('basics.htm','ACF(k)','click here for more information about the Autocorrelation Function'),header=TRUE)
a<-table.element(a,'T-STAT',header=TRUE)
a<-table.element(a,'P-value',header=TRUE)
a<-table.row.end(a)
for (i in 2:(par1+1)) {
a<-table.row.start(a)
a<-table.element(a,i-1,header=TRUE)
a<-table.element(a,round(myacf[i],6))
mytstat <- myacf[i]*sqrtn
a<-table.element(a,round(mytstat,4))
a<-table.element(a,round(1-pt(abs(mytstat),lengthx),6))
a<-table.row.end(a)
}
a<-table.end(a)
table.save(a,file='mytable.tab')
a<-table.start()
a<-table.row.start(a)
a<-table.element(a,'Partial Autocorrelation Function',4,TRUE)
a<-table.row.end(a)
a<-table.row.start(a)
a<-table.element(a,'Time lag k',header=TRUE)
a<-table.element(a,hyperlink('basics.htm','PACF(k)','click here for more information about the Partial Autocorrelation Function'),header=TRUE)
a<-table.element(a,'T-STAT',header=TRUE)
a<-table.element(a,'P-value',header=TRUE)
a<-table.row.end(a)
for (i in 1:par1) {
a<-table.row.start(a)
a<-table.element(a,i,header=TRUE)
a<-table.element(a,round(mypacf[i],6))
mytstat <- mypacf[i]*sqrtn
a<-table.element(a,round(mytstat,4))
a<-table.element(a,round(1-pt(abs(mytstat),lengthx),6))
a<-table.row.end(a)
}
a<-table.end(a)
table.save(a,file='mytable1.tab')