Free Statistics

of Irreproducible Research!

Author's title

Author*Unverified author*
R Software Modulerwasp_autocorrelation.wasp
Title produced by software(Partial) Autocorrelation Function
Date of computationTue, 09 Dec 2008 14:18:26 -0700
Cite this page as followsStatistical Computations at FreeStatistics.org, Office for Research Development and Education, URL https://freestatistics.org/blog/index.php?v=date/2008/Dec/09/t1228857555r07cy020ljnwu5y.htm/, Retrieved Sun, 19 May 2024 10:49:34 +0000
Statistical Computations at FreeStatistics.org, Office for Research Development and Education, URL https://freestatistics.org/blog/index.php?pk=31800, Retrieved Sun, 19 May 2024 10:49:34 +0000
QR Codes:

Original text written by user:
IsPrivate?No (this computation is public)
User-defined keywords
Estimated Impact139
Family? (F = Feedback message, R = changed R code, M = changed R Module, P = changed Parameters, D = changed Data)
F       [(Partial) Autocorrelation Function] [] [2008-12-09 21:18:26] [d41d8cd98f00b204e9800998ecf8427e] [Current]
Feedback Forum
2008-12-16 20:25:48 [Peter Van Doninck] [reply
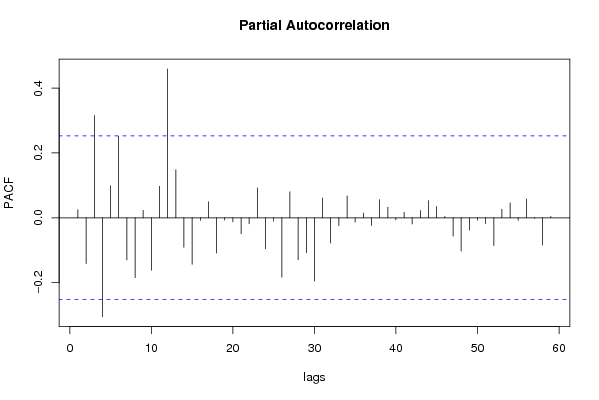
Het klopt dat er hier geen lange termijntrend waar te nemen is. Een seizoenale trend is er wel aanwezig. Dit zien we zeer duidelijk bij lag 12 en lag 24.

Post a new message
Dataseries X:
123.9
124.9
112.7
121.9
100.6
104.3
120.4
107.5
102.9
125.6
107.5
108.8
128.4
121.1
119.5
128.7
108.7
105.5
119.8
111.3
110.6
120.1
97.5
107.7
127.3
117.2
119.8
116.2
111
112.4
130.6
109.1
118.8
123.9
101.6
112.8
128
129.6
125.8
119.5
115.7
113.6
129.7
112
116.8
127
112.1
114.2
121.1
131.6
125
120.4
117.7
117.5
120.6
127.5
112.3
124.5
115.2
105.4


Summary of computational transaction
Raw Inputview raw input (R code)
Raw Outputview raw output of R engine
Computing time2 seconds
R Server'Sir Ronald Aylmer Fisher' @ 193.190.124.24

\begin{tabular}{lllllllll}
\hline
Summary of computational transaction \tabularnewline
Raw Input & view raw input (R code)  \tabularnewline
Raw Output & view raw output of R engine  \tabularnewline
Computing time & 2 seconds \tabularnewline
R Server & 'Sir Ronald Aylmer Fisher' @ 193.190.124.24 \tabularnewline
\hline
\end{tabular}
%Source: https://freestatistics.org/blog/index.php?pk=31800&T=0

[TABLE]
[ROW][C]Summary of computational transaction[/C][/ROW]
[ROW][C]Raw Input[/C][C]view raw input (R code) [/C][/ROW]
[ROW][C]Raw Output[/C][C]view raw output of R engine [/C][/ROW]
[ROW][C]Computing time[/C][C]2 seconds[/C][/ROW]
[ROW][C]R Server[/C][C]'Sir Ronald Aylmer Fisher' @ 193.190.124.24[/C][/ROW]
[/TABLE]
Source: https://freestatistics.org/blog/index.php?pk=31800&T=0

Globally Unique Identifier (entire table): ba.freestatistics.org/blog/index.php?pk=31800&T=0

As an alternative you can also use a QR Code:  

The GUIDs for individual cells are displayed in the table below:

Summary of computational transaction
Raw Inputview raw input (R code)
Raw Outputview raw output of R engine
Computing time2 seconds
R Server'Sir Ronald Aylmer Fisher' @ 193.190.124.24


Autocorrelation Function
Time lag kACF(k)T-STATP-value
10.0249270.19310.423772
2-0.140592-1.0890.14025
30.3017032.3370.011398
4-0.218303-1.6910.048016
5-0.072002-0.55770.289553
60.3906523.0260.001823
7-0.156269-1.21050.115426
8-0.222456-1.72310.045007
90.1696781.31430.09687
10-0.264026-2.04510.022617
11-0.056501-0.43770.331605
120.5859814.5391.4e-05
130.0335920.26020.397799
14-0.117154-0.90750.183894
150.1864091.44390.076982
16-0.178253-1.38070.08624
17-0.025037-0.19390.42344
180.2857122.21310.015352
19-0.118255-0.9160.181667
20-0.175325-1.35810.089764
210.0394120.30530.380602
22-0.246415-1.90870.030542
23-0.047248-0.3660.357834
240.281372.17950.016616
250.0130310.10090.459969
26-0.145622-1.1280.131908
270.0695770.53890.295961
28-0.170399-1.31990.095941
29-0.092189-0.71410.238969
300.114880.88990.188549
31-0.084474-0.65430.257699
32-0.172933-1.33950.092724
33-0.065058-0.50390.308075
34-0.13178-1.02080.155732
35-0.086951-0.67350.251601
360.1807721.40030.083294
370.0538070.41680.33916
38-0.095436-0.73920.23132
390.0654650.50710.306975
40-0.025845-0.20020.421004
41-0.073503-0.56940.285622
420.0715780.55440.290669
43-0.004238-0.03280.486962
44-0.109491-0.84810.199873
45-0.062083-0.48090.31617
46-0.052994-0.41050.341454
47-0.114657-0.88810.189009
480.0624420.48370.31519
490.0398280.30850.379383
50-0.064311-0.49810.3101
510.0330180.25580.399507
520.0311070.2410.405205
53-0.041501-0.32150.374489
540.0809220.62680.266579
550.0436470.33810.368237
56-0.00533-0.04130.483602
570.0206120.15970.436844
58-0.024626-0.19070.424683
59-0.018864-0.14610.442157
60NANANA

\begin{tabular}{lllllllll}
\hline
Autocorrelation Function \tabularnewline
Time lag k & ACF(k) & T-STAT & P-value \tabularnewline
1 & 0.024927 & 0.1931 & 0.423772 \tabularnewline
2 & -0.140592 & -1.089 & 0.14025 \tabularnewline
3 & 0.301703 & 2.337 & 0.011398 \tabularnewline
4 & -0.218303 & -1.691 & 0.048016 \tabularnewline
5 & -0.072002 & -0.5577 & 0.289553 \tabularnewline
6 & 0.390652 & 3.026 & 0.001823 \tabularnewline
7 & -0.156269 & -1.2105 & 0.115426 \tabularnewline
8 & -0.222456 & -1.7231 & 0.045007 \tabularnewline
9 & 0.169678 & 1.3143 & 0.09687 \tabularnewline
10 & -0.264026 & -2.0451 & 0.022617 \tabularnewline
11 & -0.056501 & -0.4377 & 0.331605 \tabularnewline
12 & 0.585981 & 4.539 & 1.4e-05 \tabularnewline
13 & 0.033592 & 0.2602 & 0.397799 \tabularnewline
14 & -0.117154 & -0.9075 & 0.183894 \tabularnewline
15 & 0.186409 & 1.4439 & 0.076982 \tabularnewline
16 & -0.178253 & -1.3807 & 0.08624 \tabularnewline
17 & -0.025037 & -0.1939 & 0.42344 \tabularnewline
18 & 0.285712 & 2.2131 & 0.015352 \tabularnewline
19 & -0.118255 & -0.916 & 0.181667 \tabularnewline
20 & -0.175325 & -1.3581 & 0.089764 \tabularnewline
21 & 0.039412 & 0.3053 & 0.380602 \tabularnewline
22 & -0.246415 & -1.9087 & 0.030542 \tabularnewline
23 & -0.047248 & -0.366 & 0.357834 \tabularnewline
24 & 0.28137 & 2.1795 & 0.016616 \tabularnewline
25 & 0.013031 & 0.1009 & 0.459969 \tabularnewline
26 & -0.145622 & -1.128 & 0.131908 \tabularnewline
27 & 0.069577 & 0.5389 & 0.295961 \tabularnewline
28 & -0.170399 & -1.3199 & 0.095941 \tabularnewline
29 & -0.092189 & -0.7141 & 0.238969 \tabularnewline
30 & 0.11488 & 0.8899 & 0.188549 \tabularnewline
31 & -0.084474 & -0.6543 & 0.257699 \tabularnewline
32 & -0.172933 & -1.3395 & 0.092724 \tabularnewline
33 & -0.065058 & -0.5039 & 0.308075 \tabularnewline
34 & -0.13178 & -1.0208 & 0.155732 \tabularnewline
35 & -0.086951 & -0.6735 & 0.251601 \tabularnewline
36 & 0.180772 & 1.4003 & 0.083294 \tabularnewline
37 & 0.053807 & 0.4168 & 0.33916 \tabularnewline
38 & -0.095436 & -0.7392 & 0.23132 \tabularnewline
39 & 0.065465 & 0.5071 & 0.306975 \tabularnewline
40 & -0.025845 & -0.2002 & 0.421004 \tabularnewline
41 & -0.073503 & -0.5694 & 0.285622 \tabularnewline
42 & 0.071578 & 0.5544 & 0.290669 \tabularnewline
43 & -0.004238 & -0.0328 & 0.486962 \tabularnewline
44 & -0.109491 & -0.8481 & 0.199873 \tabularnewline
45 & -0.062083 & -0.4809 & 0.31617 \tabularnewline
46 & -0.052994 & -0.4105 & 0.341454 \tabularnewline
47 & -0.114657 & -0.8881 & 0.189009 \tabularnewline
48 & 0.062442 & 0.4837 & 0.31519 \tabularnewline
49 & 0.039828 & 0.3085 & 0.379383 \tabularnewline
50 & -0.064311 & -0.4981 & 0.3101 \tabularnewline
51 & 0.033018 & 0.2558 & 0.399507 \tabularnewline
52 & 0.031107 & 0.241 & 0.405205 \tabularnewline
53 & -0.041501 & -0.3215 & 0.374489 \tabularnewline
54 & 0.080922 & 0.6268 & 0.266579 \tabularnewline
55 & 0.043647 & 0.3381 & 0.368237 \tabularnewline
56 & -0.00533 & -0.0413 & 0.483602 \tabularnewline
57 & 0.020612 & 0.1597 & 0.436844 \tabularnewline
58 & -0.024626 & -0.1907 & 0.424683 \tabularnewline
59 & -0.018864 & -0.1461 & 0.442157 \tabularnewline
60 & NA & NA & NA \tabularnewline
\hline
\end{tabular}
%Source: https://freestatistics.org/blog/index.php?pk=31800&T=1

[TABLE]
[ROW][C]Autocorrelation Function[/C][/ROW]
[ROW][C]Time lag k[/C][C]ACF(k)[/C][C]T-STAT[/C][C]P-value[/C][/ROW]
[ROW][C]1[/C][C]0.024927[/C][C]0.1931[/C][C]0.423772[/C][/ROW]
[ROW][C]2[/C][C]-0.140592[/C][C]-1.089[/C][C]0.14025[/C][/ROW]
[ROW][C]3[/C][C]0.301703[/C][C]2.337[/C][C]0.011398[/C][/ROW]
[ROW][C]4[/C][C]-0.218303[/C][C]-1.691[/C][C]0.048016[/C][/ROW]
[ROW][C]5[/C][C]-0.072002[/C][C]-0.5577[/C][C]0.289553[/C][/ROW]
[ROW][C]6[/C][C]0.390652[/C][C]3.026[/C][C]0.001823[/C][/ROW]
[ROW][C]7[/C][C]-0.156269[/C][C]-1.2105[/C][C]0.115426[/C][/ROW]
[ROW][C]8[/C][C]-0.222456[/C][C]-1.7231[/C][C]0.045007[/C][/ROW]
[ROW][C]9[/C][C]0.169678[/C][C]1.3143[/C][C]0.09687[/C][/ROW]
[ROW][C]10[/C][C]-0.264026[/C][C]-2.0451[/C][C]0.022617[/C][/ROW]
[ROW][C]11[/C][C]-0.056501[/C][C]-0.4377[/C][C]0.331605[/C][/ROW]
[ROW][C]12[/C][C]0.585981[/C][C]4.539[/C][C]1.4e-05[/C][/ROW]
[ROW][C]13[/C][C]0.033592[/C][C]0.2602[/C][C]0.397799[/C][/ROW]
[ROW][C]14[/C][C]-0.117154[/C][C]-0.9075[/C][C]0.183894[/C][/ROW]
[ROW][C]15[/C][C]0.186409[/C][C]1.4439[/C][C]0.076982[/C][/ROW]
[ROW][C]16[/C][C]-0.178253[/C][C]-1.3807[/C][C]0.08624[/C][/ROW]
[ROW][C]17[/C][C]-0.025037[/C][C]-0.1939[/C][C]0.42344[/C][/ROW]
[ROW][C]18[/C][C]0.285712[/C][C]2.2131[/C][C]0.015352[/C][/ROW]
[ROW][C]19[/C][C]-0.118255[/C][C]-0.916[/C][C]0.181667[/C][/ROW]
[ROW][C]20[/C][C]-0.175325[/C][C]-1.3581[/C][C]0.089764[/C][/ROW]
[ROW][C]21[/C][C]0.039412[/C][C]0.3053[/C][C]0.380602[/C][/ROW]
[ROW][C]22[/C][C]-0.246415[/C][C]-1.9087[/C][C]0.030542[/C][/ROW]
[ROW][C]23[/C][C]-0.047248[/C][C]-0.366[/C][C]0.357834[/C][/ROW]
[ROW][C]24[/C][C]0.28137[/C][C]2.1795[/C][C]0.016616[/C][/ROW]
[ROW][C]25[/C][C]0.013031[/C][C]0.1009[/C][C]0.459969[/C][/ROW]
[ROW][C]26[/C][C]-0.145622[/C][C]-1.128[/C][C]0.131908[/C][/ROW]
[ROW][C]27[/C][C]0.069577[/C][C]0.5389[/C][C]0.295961[/C][/ROW]
[ROW][C]28[/C][C]-0.170399[/C][C]-1.3199[/C][C]0.095941[/C][/ROW]
[ROW][C]29[/C][C]-0.092189[/C][C]-0.7141[/C][C]0.238969[/C][/ROW]
[ROW][C]30[/C][C]0.11488[/C][C]0.8899[/C][C]0.188549[/C][/ROW]
[ROW][C]31[/C][C]-0.084474[/C][C]-0.6543[/C][C]0.257699[/C][/ROW]
[ROW][C]32[/C][C]-0.172933[/C][C]-1.3395[/C][C]0.092724[/C][/ROW]
[ROW][C]33[/C][C]-0.065058[/C][C]-0.5039[/C][C]0.308075[/C][/ROW]
[ROW][C]34[/C][C]-0.13178[/C][C]-1.0208[/C][C]0.155732[/C][/ROW]
[ROW][C]35[/C][C]-0.086951[/C][C]-0.6735[/C][C]0.251601[/C][/ROW]
[ROW][C]36[/C][C]0.180772[/C][C]1.4003[/C][C]0.083294[/C][/ROW]
[ROW][C]37[/C][C]0.053807[/C][C]0.4168[/C][C]0.33916[/C][/ROW]
[ROW][C]38[/C][C]-0.095436[/C][C]-0.7392[/C][C]0.23132[/C][/ROW]
[ROW][C]39[/C][C]0.065465[/C][C]0.5071[/C][C]0.306975[/C][/ROW]
[ROW][C]40[/C][C]-0.025845[/C][C]-0.2002[/C][C]0.421004[/C][/ROW]
[ROW][C]41[/C][C]-0.073503[/C][C]-0.5694[/C][C]0.285622[/C][/ROW]
[ROW][C]42[/C][C]0.071578[/C][C]0.5544[/C][C]0.290669[/C][/ROW]
[ROW][C]43[/C][C]-0.004238[/C][C]-0.0328[/C][C]0.486962[/C][/ROW]
[ROW][C]44[/C][C]-0.109491[/C][C]-0.8481[/C][C]0.199873[/C][/ROW]
[ROW][C]45[/C][C]-0.062083[/C][C]-0.4809[/C][C]0.31617[/C][/ROW]
[ROW][C]46[/C][C]-0.052994[/C][C]-0.4105[/C][C]0.341454[/C][/ROW]
[ROW][C]47[/C][C]-0.114657[/C][C]-0.8881[/C][C]0.189009[/C][/ROW]
[ROW][C]48[/C][C]0.062442[/C][C]0.4837[/C][C]0.31519[/C][/ROW]
[ROW][C]49[/C][C]0.039828[/C][C]0.3085[/C][C]0.379383[/C][/ROW]
[ROW][C]50[/C][C]-0.064311[/C][C]-0.4981[/C][C]0.3101[/C][/ROW]
[ROW][C]51[/C][C]0.033018[/C][C]0.2558[/C][C]0.399507[/C][/ROW]
[ROW][C]52[/C][C]0.031107[/C][C]0.241[/C][C]0.405205[/C][/ROW]
[ROW][C]53[/C][C]-0.041501[/C][C]-0.3215[/C][C]0.374489[/C][/ROW]
[ROW][C]54[/C][C]0.080922[/C][C]0.6268[/C][C]0.266579[/C][/ROW]
[ROW][C]55[/C][C]0.043647[/C][C]0.3381[/C][C]0.368237[/C][/ROW]
[ROW][C]56[/C][C]-0.00533[/C][C]-0.0413[/C][C]0.483602[/C][/ROW]
[ROW][C]57[/C][C]0.020612[/C][C]0.1597[/C][C]0.436844[/C][/ROW]
[ROW][C]58[/C][C]-0.024626[/C][C]-0.1907[/C][C]0.424683[/C][/ROW]
[ROW][C]59[/C][C]-0.018864[/C][C]-0.1461[/C][C]0.442157[/C][/ROW]
[ROW][C]60[/C][C]NA[/C][C]NA[/C][C]NA[/C][/ROW]
[/TABLE]
Source: https://freestatistics.org/blog/index.php?pk=31800&T=1

Globally Unique Identifier (entire table): ba.freestatistics.org/blog/index.php?pk=31800&T=1

As an alternative you can also use a QR Code:  

The GUIDs for individual cells are displayed in the table below:

Autocorrelation Function
Time lag kACF(k)T-STATP-value
10.0249270.19310.423772
2-0.140592-1.0890.14025
30.3017032.3370.011398
4-0.218303-1.6910.048016
5-0.072002-0.55770.289553
60.3906523.0260.001823
7-0.156269-1.21050.115426
8-0.222456-1.72310.045007
90.1696781.31430.09687
10-0.264026-2.04510.022617
11-0.056501-0.43770.331605
120.5859814.5391.4e-05
130.0335920.26020.397799
14-0.117154-0.90750.183894
150.1864091.44390.076982
16-0.178253-1.38070.08624
17-0.025037-0.19390.42344
180.2857122.21310.015352
19-0.118255-0.9160.181667
20-0.175325-1.35810.089764
210.0394120.30530.380602
22-0.246415-1.90870.030542
23-0.047248-0.3660.357834
240.281372.17950.016616
250.0130310.10090.459969
26-0.145622-1.1280.131908
270.0695770.53890.295961
28-0.170399-1.31990.095941
29-0.092189-0.71410.238969
300.114880.88990.188549
31-0.084474-0.65430.257699
32-0.172933-1.33950.092724
33-0.065058-0.50390.308075
34-0.13178-1.02080.155732
35-0.086951-0.67350.251601
360.1807721.40030.083294
370.0538070.41680.33916
38-0.095436-0.73920.23132
390.0654650.50710.306975
40-0.025845-0.20020.421004
41-0.073503-0.56940.285622
420.0715780.55440.290669
43-0.004238-0.03280.486962
44-0.109491-0.84810.199873
45-0.062083-0.48090.31617
46-0.052994-0.41050.341454
47-0.114657-0.88810.189009
480.0624420.48370.31519
490.0398280.30850.379383
50-0.064311-0.49810.3101
510.0330180.25580.399507
520.0311070.2410.405205
53-0.041501-0.32150.374489
540.0809220.62680.266579
550.0436470.33810.368237
56-0.00533-0.04130.483602
570.0206120.15970.436844
58-0.024626-0.19070.424683
59-0.018864-0.14610.442157
60NANANA


Partial Autocorrelation Function
Time lag kPACF(k)T-STATP-value
10.0249270.19310.423772
2-0.141301-1.09450.139053
30.3157212.44560.008707
4-0.30545-2.3660.010614
50.099220.76860.222586
60.2516841.94950.027955
7-0.130108-1.00780.158796
8-0.185056-1.43340.078462
90.022940.17770.429782
10-0.161874-1.25390.107376
110.0969770.75120.22774
120.4595713.55980.000367
130.1483381.1490.127554
14-0.091225-0.70660.241268
15-0.143917-1.11480.134696
16-0.007525-0.05830.476855
170.0494930.38340.351399
18-0.109028-0.84450.200865
19-0.007241-0.05610.477729
20-0.01236-0.09570.462024
21-0.049272-0.38170.352033
22-0.018839-0.14590.442234
230.0922570.71460.238807
24-0.095732-0.74150.230629
25-0.010221-0.07920.46858
26-0.183477-1.42120.080217
270.0800120.61980.268878
28-0.129488-1.0030.159942
29-0.108315-0.8390.2024
30-0.195331-1.5130.067761
310.0609330.4720.319326
32-0.078212-0.60580.273457
33-0.024057-0.18630.426402
340.0673460.52170.301914
35-0.013595-0.10530.458242
360.014430.11180.455688
37-0.024088-0.18660.426307
380.0554620.42960.33451
390.0322350.24970.401838
40-0.006034-0.04670.481439
410.0166220.12880.448993
42-0.019323-0.14970.440763
430.0224610.1740.431234
440.0524490.40630.342995
450.0349610.27080.393734
460.004160.03220.4872
47-0.056548-0.4380.331472
48-0.103054-0.79830.213936
49-0.03764-0.29160.385814
50-0.007422-0.05750.477174
51-0.018052-0.13980.44463
52-0.085736-0.66410.254582
530.0260580.20180.420359
540.0454150.35180.363117
55-0.008026-0.06220.475318
560.0580780.44990.327212
57-0.001713-0.01330.494728
58-0.083987-0.65060.258907
590.0039740.03080.487774
60NANANA

\begin{tabular}{lllllllll}
\hline
Partial Autocorrelation Function \tabularnewline
Time lag k & PACF(k) & T-STAT & P-value \tabularnewline
1 & 0.024927 & 0.1931 & 0.423772 \tabularnewline
2 & -0.141301 & -1.0945 & 0.139053 \tabularnewline
3 & 0.315721 & 2.4456 & 0.008707 \tabularnewline
4 & -0.30545 & -2.366 & 0.010614 \tabularnewline
5 & 0.09922 & 0.7686 & 0.222586 \tabularnewline
6 & 0.251684 & 1.9495 & 0.027955 \tabularnewline
7 & -0.130108 & -1.0078 & 0.158796 \tabularnewline
8 & -0.185056 & -1.4334 & 0.078462 \tabularnewline
9 & 0.02294 & 0.1777 & 0.429782 \tabularnewline
10 & -0.161874 & -1.2539 & 0.107376 \tabularnewline
11 & 0.096977 & 0.7512 & 0.22774 \tabularnewline
12 & 0.459571 & 3.5598 & 0.000367 \tabularnewline
13 & 0.148338 & 1.149 & 0.127554 \tabularnewline
14 & -0.091225 & -0.7066 & 0.241268 \tabularnewline
15 & -0.143917 & -1.1148 & 0.134696 \tabularnewline
16 & -0.007525 & -0.0583 & 0.476855 \tabularnewline
17 & 0.049493 & 0.3834 & 0.351399 \tabularnewline
18 & -0.109028 & -0.8445 & 0.200865 \tabularnewline
19 & -0.007241 & -0.0561 & 0.477729 \tabularnewline
20 & -0.01236 & -0.0957 & 0.462024 \tabularnewline
21 & -0.049272 & -0.3817 & 0.352033 \tabularnewline
22 & -0.018839 & -0.1459 & 0.442234 \tabularnewline
23 & 0.092257 & 0.7146 & 0.238807 \tabularnewline
24 & -0.095732 & -0.7415 & 0.230629 \tabularnewline
25 & -0.010221 & -0.0792 & 0.46858 \tabularnewline
26 & -0.183477 & -1.4212 & 0.080217 \tabularnewline
27 & 0.080012 & 0.6198 & 0.268878 \tabularnewline
28 & -0.129488 & -1.003 & 0.159942 \tabularnewline
29 & -0.108315 & -0.839 & 0.2024 \tabularnewline
30 & -0.195331 & -1.513 & 0.067761 \tabularnewline
31 & 0.060933 & 0.472 & 0.319326 \tabularnewline
32 & -0.078212 & -0.6058 & 0.273457 \tabularnewline
33 & -0.024057 & -0.1863 & 0.426402 \tabularnewline
34 & 0.067346 & 0.5217 & 0.301914 \tabularnewline
35 & -0.013595 & -0.1053 & 0.458242 \tabularnewline
36 & 0.01443 & 0.1118 & 0.455688 \tabularnewline
37 & -0.024088 & -0.1866 & 0.426307 \tabularnewline
38 & 0.055462 & 0.4296 & 0.33451 \tabularnewline
39 & 0.032235 & 0.2497 & 0.401838 \tabularnewline
40 & -0.006034 & -0.0467 & 0.481439 \tabularnewline
41 & 0.016622 & 0.1288 & 0.448993 \tabularnewline
42 & -0.019323 & -0.1497 & 0.440763 \tabularnewline
43 & 0.022461 & 0.174 & 0.431234 \tabularnewline
44 & 0.052449 & 0.4063 & 0.342995 \tabularnewline
45 & 0.034961 & 0.2708 & 0.393734 \tabularnewline
46 & 0.00416 & 0.0322 & 0.4872 \tabularnewline
47 & -0.056548 & -0.438 & 0.331472 \tabularnewline
48 & -0.103054 & -0.7983 & 0.213936 \tabularnewline
49 & -0.03764 & -0.2916 & 0.385814 \tabularnewline
50 & -0.007422 & -0.0575 & 0.477174 \tabularnewline
51 & -0.018052 & -0.1398 & 0.44463 \tabularnewline
52 & -0.085736 & -0.6641 & 0.254582 \tabularnewline
53 & 0.026058 & 0.2018 & 0.420359 \tabularnewline
54 & 0.045415 & 0.3518 & 0.363117 \tabularnewline
55 & -0.008026 & -0.0622 & 0.475318 \tabularnewline
56 & 0.058078 & 0.4499 & 0.327212 \tabularnewline
57 & -0.001713 & -0.0133 & 0.494728 \tabularnewline
58 & -0.083987 & -0.6506 & 0.258907 \tabularnewline
59 & 0.003974 & 0.0308 & 0.487774 \tabularnewline
60 & NA & NA & NA \tabularnewline
\hline
\end{tabular}
%Source: https://freestatistics.org/blog/index.php?pk=31800&T=2

[TABLE]
[ROW][C]Partial Autocorrelation Function[/C][/ROW]
[ROW][C]Time lag k[/C][C]PACF(k)[/C][C]T-STAT[/C][C]P-value[/C][/ROW]
[ROW][C]1[/C][C]0.024927[/C][C]0.1931[/C][C]0.423772[/C][/ROW]
[ROW][C]2[/C][C]-0.141301[/C][C]-1.0945[/C][C]0.139053[/C][/ROW]
[ROW][C]3[/C][C]0.315721[/C][C]2.4456[/C][C]0.008707[/C][/ROW]
[ROW][C]4[/C][C]-0.30545[/C][C]-2.366[/C][C]0.010614[/C][/ROW]
[ROW][C]5[/C][C]0.09922[/C][C]0.7686[/C][C]0.222586[/C][/ROW]
[ROW][C]6[/C][C]0.251684[/C][C]1.9495[/C][C]0.027955[/C][/ROW]
[ROW][C]7[/C][C]-0.130108[/C][C]-1.0078[/C][C]0.158796[/C][/ROW]
[ROW][C]8[/C][C]-0.185056[/C][C]-1.4334[/C][C]0.078462[/C][/ROW]
[ROW][C]9[/C][C]0.02294[/C][C]0.1777[/C][C]0.429782[/C][/ROW]
[ROW][C]10[/C][C]-0.161874[/C][C]-1.2539[/C][C]0.107376[/C][/ROW]
[ROW][C]11[/C][C]0.096977[/C][C]0.7512[/C][C]0.22774[/C][/ROW]
[ROW][C]12[/C][C]0.459571[/C][C]3.5598[/C][C]0.000367[/C][/ROW]
[ROW][C]13[/C][C]0.148338[/C][C]1.149[/C][C]0.127554[/C][/ROW]
[ROW][C]14[/C][C]-0.091225[/C][C]-0.7066[/C][C]0.241268[/C][/ROW]
[ROW][C]15[/C][C]-0.143917[/C][C]-1.1148[/C][C]0.134696[/C][/ROW]
[ROW][C]16[/C][C]-0.007525[/C][C]-0.0583[/C][C]0.476855[/C][/ROW]
[ROW][C]17[/C][C]0.049493[/C][C]0.3834[/C][C]0.351399[/C][/ROW]
[ROW][C]18[/C][C]-0.109028[/C][C]-0.8445[/C][C]0.200865[/C][/ROW]
[ROW][C]19[/C][C]-0.007241[/C][C]-0.0561[/C][C]0.477729[/C][/ROW]
[ROW][C]20[/C][C]-0.01236[/C][C]-0.0957[/C][C]0.462024[/C][/ROW]
[ROW][C]21[/C][C]-0.049272[/C][C]-0.3817[/C][C]0.352033[/C][/ROW]
[ROW][C]22[/C][C]-0.018839[/C][C]-0.1459[/C][C]0.442234[/C][/ROW]
[ROW][C]23[/C][C]0.092257[/C][C]0.7146[/C][C]0.238807[/C][/ROW]
[ROW][C]24[/C][C]-0.095732[/C][C]-0.7415[/C][C]0.230629[/C][/ROW]
[ROW][C]25[/C][C]-0.010221[/C][C]-0.0792[/C][C]0.46858[/C][/ROW]
[ROW][C]26[/C][C]-0.183477[/C][C]-1.4212[/C][C]0.080217[/C][/ROW]
[ROW][C]27[/C][C]0.080012[/C][C]0.6198[/C][C]0.268878[/C][/ROW]
[ROW][C]28[/C][C]-0.129488[/C][C]-1.003[/C][C]0.159942[/C][/ROW]
[ROW][C]29[/C][C]-0.108315[/C][C]-0.839[/C][C]0.2024[/C][/ROW]
[ROW][C]30[/C][C]-0.195331[/C][C]-1.513[/C][C]0.067761[/C][/ROW]
[ROW][C]31[/C][C]0.060933[/C][C]0.472[/C][C]0.319326[/C][/ROW]
[ROW][C]32[/C][C]-0.078212[/C][C]-0.6058[/C][C]0.273457[/C][/ROW]
[ROW][C]33[/C][C]-0.024057[/C][C]-0.1863[/C][C]0.426402[/C][/ROW]
[ROW][C]34[/C][C]0.067346[/C][C]0.5217[/C][C]0.301914[/C][/ROW]
[ROW][C]35[/C][C]-0.013595[/C][C]-0.1053[/C][C]0.458242[/C][/ROW]
[ROW][C]36[/C][C]0.01443[/C][C]0.1118[/C][C]0.455688[/C][/ROW]
[ROW][C]37[/C][C]-0.024088[/C][C]-0.1866[/C][C]0.426307[/C][/ROW]
[ROW][C]38[/C][C]0.055462[/C][C]0.4296[/C][C]0.33451[/C][/ROW]
[ROW][C]39[/C][C]0.032235[/C][C]0.2497[/C][C]0.401838[/C][/ROW]
[ROW][C]40[/C][C]-0.006034[/C][C]-0.0467[/C][C]0.481439[/C][/ROW]
[ROW][C]41[/C][C]0.016622[/C][C]0.1288[/C][C]0.448993[/C][/ROW]
[ROW][C]42[/C][C]-0.019323[/C][C]-0.1497[/C][C]0.440763[/C][/ROW]
[ROW][C]43[/C][C]0.022461[/C][C]0.174[/C][C]0.431234[/C][/ROW]
[ROW][C]44[/C][C]0.052449[/C][C]0.4063[/C][C]0.342995[/C][/ROW]
[ROW][C]45[/C][C]0.034961[/C][C]0.2708[/C][C]0.393734[/C][/ROW]
[ROW][C]46[/C][C]0.00416[/C][C]0.0322[/C][C]0.4872[/C][/ROW]
[ROW][C]47[/C][C]-0.056548[/C][C]-0.438[/C][C]0.331472[/C][/ROW]
[ROW][C]48[/C][C]-0.103054[/C][C]-0.7983[/C][C]0.213936[/C][/ROW]
[ROW][C]49[/C][C]-0.03764[/C][C]-0.2916[/C][C]0.385814[/C][/ROW]
[ROW][C]50[/C][C]-0.007422[/C][C]-0.0575[/C][C]0.477174[/C][/ROW]
[ROW][C]51[/C][C]-0.018052[/C][C]-0.1398[/C][C]0.44463[/C][/ROW]
[ROW][C]52[/C][C]-0.085736[/C][C]-0.6641[/C][C]0.254582[/C][/ROW]
[ROW][C]53[/C][C]0.026058[/C][C]0.2018[/C][C]0.420359[/C][/ROW]
[ROW][C]54[/C][C]0.045415[/C][C]0.3518[/C][C]0.363117[/C][/ROW]
[ROW][C]55[/C][C]-0.008026[/C][C]-0.0622[/C][C]0.475318[/C][/ROW]
[ROW][C]56[/C][C]0.058078[/C][C]0.4499[/C][C]0.327212[/C][/ROW]
[ROW][C]57[/C][C]-0.001713[/C][C]-0.0133[/C][C]0.494728[/C][/ROW]
[ROW][C]58[/C][C]-0.083987[/C][C]-0.6506[/C][C]0.258907[/C][/ROW]
[ROW][C]59[/C][C]0.003974[/C][C]0.0308[/C][C]0.487774[/C][/ROW]
[ROW][C]60[/C][C]NA[/C][C]NA[/C][C]NA[/C][/ROW]
[/TABLE]
Source: https://freestatistics.org/blog/index.php?pk=31800&T=2

Globally Unique Identifier (entire table): ba.freestatistics.org/blog/index.php?pk=31800&T=2

As an alternative you can also use a QR Code:  

The GUIDs for individual cells are displayed in the table below:

Partial Autocorrelation Function
Time lag kPACF(k)T-STATP-value
10.0249270.19310.423772
2-0.141301-1.09450.139053
30.3157212.44560.008707
4-0.30545-2.3660.010614
50.099220.76860.222586
60.2516841.94950.027955
7-0.130108-1.00780.158796
8-0.185056-1.43340.078462
90.022940.17770.429782
10-0.161874-1.25390.107376
110.0969770.75120.22774
120.4595713.55980.000367
130.1483381.1490.127554
14-0.091225-0.70660.241268
15-0.143917-1.11480.134696
16-0.007525-0.05830.476855
170.0494930.38340.351399
18-0.109028-0.84450.200865
19-0.007241-0.05610.477729
20-0.01236-0.09570.462024
21-0.049272-0.38170.352033
22-0.018839-0.14590.442234
230.0922570.71460.238807
24-0.095732-0.74150.230629
25-0.010221-0.07920.46858
26-0.183477-1.42120.080217
270.0800120.61980.268878
28-0.129488-1.0030.159942
29-0.108315-0.8390.2024
30-0.195331-1.5130.067761
310.0609330.4720.319326
32-0.078212-0.60580.273457
33-0.024057-0.18630.426402
340.0673460.52170.301914
35-0.013595-0.10530.458242
360.014430.11180.455688
37-0.024088-0.18660.426307
380.0554620.42960.33451
390.0322350.24970.401838
40-0.006034-0.04670.481439
410.0166220.12880.448993
42-0.019323-0.14970.440763
430.0224610.1740.431234
440.0524490.40630.342995
450.0349610.27080.393734
460.004160.03220.4872
47-0.056548-0.4380.331472
48-0.103054-0.79830.213936
49-0.03764-0.29160.385814
50-0.007422-0.05750.477174
51-0.018052-0.13980.44463
52-0.085736-0.66410.254582
530.0260580.20180.420359
540.0454150.35180.363117
55-0.008026-0.06220.475318
560.0580780.44990.327212
57-0.001713-0.01330.494728
58-0.083987-0.65060.258907
590.0039740.03080.487774
60NANANA


Parameters (Session):
par1 = 60 ; par2 = 1 ; par3 = 0 ; par4 = 0 ; par5 = 12 ;
Parameters (R input):
par1 = 60 ; par2 = 1 ; par3 = 0 ; par4 = 0 ; par5 = 12 ;
R code (references can be found in the software module):
if (par1 == 'Default') {
par1 = 10*log10(length(x))
} else {
par1 <- as.numeric(par1)
}
par2 <- as.numeric(par2)
par3 <- as.numeric(par3)
par4 <- as.numeric(par4)
par5 <- as.numeric(par5)
if (par2 == 0) {
x <- log(x)
} else {
x <- (x ^ par2 - 1) / par2
}
if (par3 > 0) x <- diff(x,lag=1,difference=par3)
if (par4 > 0) x <- diff(x,lag=par5,difference=par4)
bitmap(file='pic1.png')
racf <- acf(x,par1,main='Autocorrelation',xlab='lags',ylab='ACF')
dev.off()
bitmap(file='pic2.png')
rpacf <- pacf(x,par1,main='Partial Autocorrelation',xlab='lags',ylab='PACF')
dev.off()
(myacf <- c(racf$acf))
(mypacf <- c(rpacf$acf))
lengthx <- length(x)
sqrtn <- sqrt(lengthx)
load(file='createtable')
a<-table.start()
a<-table.row.start(a)
a<-table.element(a,'Autocorrelation Function',4,TRUE)
a<-table.row.end(a)
a<-table.row.start(a)
a<-table.element(a,'Time lag k',header=TRUE)
a<-table.element(a,hyperlink('basics.htm','ACF(k)','click here for more information about the Autocorrelation Function'),header=TRUE)
a<-table.element(a,'T-STAT',header=TRUE)
a<-table.element(a,'P-value',header=TRUE)
a<-table.row.end(a)
for (i in 2:(par1+1)) {
a<-table.row.start(a)
a<-table.element(a,i-1,header=TRUE)
a<-table.element(a,round(myacf[i],6))
mytstat <- myacf[i]*sqrtn
a<-table.element(a,round(mytstat,4))
a<-table.element(a,round(1-pt(abs(mytstat),lengthx),6))
a<-table.row.end(a)
}
a<-table.end(a)
table.save(a,file='mytable.tab')
a<-table.start()
a<-table.row.start(a)
a<-table.element(a,'Partial Autocorrelation Function',4,TRUE)
a<-table.row.end(a)
a<-table.row.start(a)
a<-table.element(a,'Time lag k',header=TRUE)
a<-table.element(a,hyperlink('basics.htm','PACF(k)','click here for more information about the Partial Autocorrelation Function'),header=TRUE)
a<-table.element(a,'T-STAT',header=TRUE)
a<-table.element(a,'P-value',header=TRUE)
a<-table.row.end(a)
for (i in 1:par1) {
a<-table.row.start(a)
a<-table.element(a,i,header=TRUE)
a<-table.element(a,round(mypacf[i],6))
mytstat <- mypacf[i]*sqrtn
a<-table.element(a,round(mytstat,4))
a<-table.element(a,round(1-pt(abs(mytstat),lengthx),6))
a<-table.row.end(a)
}
a<-table.end(a)
table.save(a,file='mytable1.tab')