Free Statistics

of Irreproducible Research!

Author's title

Author*Unverified author*
R Software Modulerwasp_smp.wasp
Title produced by softwareStandard Deviation-Mean Plot
Date of computationTue, 09 Dec 2008 13:52:54 -0700
Cite this page as followsStatistical Computations at FreeStatistics.org, Office for Research Development and Education, URL https://freestatistics.org/blog/index.php?v=date/2008/Dec/09/t1228856095se8olkinenpjykd.htm/, Retrieved Sun, 19 May 2024 08:51:46 +0000
Statistical Computations at FreeStatistics.org, Office for Research Development and Education, URL https://freestatistics.org/blog/index.php?pk=31795, Retrieved Sun, 19 May 2024 08:51:46 +0000
QR Codes:

Original text written by user:
IsPrivate?No (this computation is public)
User-defined keywords
Estimated Impact133
Family? (F = Feedback message, R = changed R code, M = changed R Module, P = changed Parameters, D = changed Data)
F       [Standard Deviation-Mean Plot] [] [2008-12-09 20:52:54] [d41d8cd98f00b204e9800998ecf8427e] [Current]
Feedback Forum
2008-12-16 20:21:19 [Peter Van Doninck] [reply
Correcte argumentatie ivm de p-waarde. De lambda waarde is hier inderdaad vrij groot. Zoals de student opmerkt, moesten we lambda dan op 1 zetten. Dit werd uiteengezet in het college.

Post a new message
Dataseries X:
123,9
124,9
112,7
121,9
100,6
104,3
120,4
107,5
102,9
125,6
107,5
108,8
128,4
121,1
119,5
128,7
108,7
105,5
119,8
111,3
110,6
120,1
97,5
107,7
127,3
117,2
119,8
116,2
111
112,4
130,6
109,1
118,8
123,9
101,6
112,8
128
129,6
125,8
119,5
115,7
113,6
129,7
112
116,8
127
112,1
114,2
121,1
131,6
125
120,4
117,7
117,5
120,6
127,5
112,3
124,5
115,2
105,4


Summary of computational transaction
Raw Inputview raw input (R code)
Raw Outputview raw output of R engine
Computing time1 seconds
R Server'George Udny Yule' @ 72.249.76.132

\begin{tabular}{lllllllll}
\hline
Summary of computational transaction \tabularnewline
Raw Input & view raw input (R code)  \tabularnewline
Raw Output & view raw output of R engine  \tabularnewline
Computing time & 1 seconds \tabularnewline
R Server & 'George Udny Yule' @ 72.249.76.132 \tabularnewline
\hline
\end{tabular}
%Source: https://freestatistics.org/blog/index.php?pk=31795&T=0

[TABLE]
[ROW][C]Summary of computational transaction[/C][/ROW]
[ROW][C]Raw Input[/C][C]view raw input (R code) [/C][/ROW]
[ROW][C]Raw Output[/C][C]view raw output of R engine [/C][/ROW]
[ROW][C]Computing time[/C][C]1 seconds[/C][/ROW]
[ROW][C]R Server[/C][C]'George Udny Yule' @ 72.249.76.132[/C][/ROW]
[/TABLE]
Source: https://freestatistics.org/blog/index.php?pk=31795&T=0

Globally Unique Identifier (entire table): ba.freestatistics.org/blog/index.php?pk=31795&T=0

As an alternative you can also use a QR Code:  

The GUIDs for individual cells are displayed in the table below:

Summary of computational transaction
Raw Inputview raw input (R code)
Raw Outputview raw output of R engine
Computing time1 seconds
R Server'George Udny Yule' @ 72.249.76.132


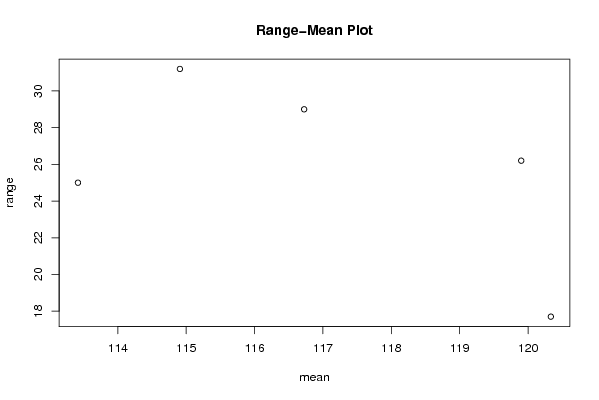
Standard Deviation-Mean Plot
SectionMeanStandard DeviationRange
1113.4166666666679.3456682560165425
2114.9083333333339.5164411160449831.2
3116.7258.1121821971649529
4120.3333333333337.1449070651546617.7
5119.97.0369156466581126.2

\begin{tabular}{lllllllll}
\hline
Standard Deviation-Mean Plot \tabularnewline
Section & Mean & Standard Deviation & Range \tabularnewline
1 & 113.416666666667 & 9.34566825601654 & 25 \tabularnewline
2 & 114.908333333333 & 9.51644111604498 & 31.2 \tabularnewline
3 & 116.725 & 8.11218219716495 & 29 \tabularnewline
4 & 120.333333333333 & 7.14490706515466 & 17.7 \tabularnewline
5 & 119.9 & 7.03691564665811 & 26.2 \tabularnewline
\hline
\end{tabular}
%Source: https://freestatistics.org/blog/index.php?pk=31795&T=1

[TABLE]
[ROW][C]Standard Deviation-Mean Plot[/C][/ROW]
[ROW][C]Section[/C][C]Mean[/C][C]Standard Deviation[/C][C]Range[/C][/ROW]
[ROW][C]1[/C][C]113.416666666667[/C][C]9.34566825601654[/C][C]25[/C][/ROW]
[ROW][C]2[/C][C]114.908333333333[/C][C]9.51644111604498[/C][C]31.2[/C][/ROW]
[ROW][C]3[/C][C]116.725[/C][C]8.11218219716495[/C][C]29[/C][/ROW]
[ROW][C]4[/C][C]120.333333333333[/C][C]7.14490706515466[/C][C]17.7[/C][/ROW]
[ROW][C]5[/C][C]119.9[/C][C]7.03691564665811[/C][C]26.2[/C][/ROW]
[/TABLE]
Source: https://freestatistics.org/blog/index.php?pk=31795&T=1

Globally Unique Identifier (entire table): ba.freestatistics.org/blog/index.php?pk=31795&T=1

As an alternative you can also use a QR Code:  

The GUIDs for individual cells are displayed in the table below:

Standard Deviation-Mean Plot
SectionMeanStandard DeviationRange
1113.4166666666679.3456682560165425
2114.9083333333339.5164411160449831.2
3116.7258.1121821971649529
4120.3333333333337.1449070651546617.7
5119.97.0369156466581126.2


Regression: S.E.(k) = alpha + beta * Mean(k)
alpha51.9206116819473
beta-0.373232811678727
S.D.0.0593329219687259
T-STAT-6.29048425889856
p-value0.00811435345707744

\begin{tabular}{lllllllll}
\hline
Regression: S.E.(k) = alpha + beta * Mean(k) \tabularnewline
alpha & 51.9206116819473 \tabularnewline
beta & -0.373232811678727 \tabularnewline
S.D. & 0.0593329219687259 \tabularnewline
T-STAT & -6.29048425889856 \tabularnewline
p-value & 0.00811435345707744 \tabularnewline
\hline
\end{tabular}
%Source: https://freestatistics.org/blog/index.php?pk=31795&T=2

[TABLE]
[ROW][C]Regression: S.E.(k) = alpha + beta * Mean(k)[/C][/ROW]
[ROW][C]alpha[/C][C]51.9206116819473[/C][/ROW]
[ROW][C]beta[/C][C]-0.373232811678727[/C][/ROW]
[ROW][C]S.D.[/C][C]0.0593329219687259[/C][/ROW]
[ROW][C]T-STAT[/C][C]-6.29048425889856[/C][/ROW]
[ROW][C]p-value[/C][C]0.00811435345707744[/C][/ROW]
[/TABLE]
Source: https://freestatistics.org/blog/index.php?pk=31795&T=2

Globally Unique Identifier (entire table): ba.freestatistics.org/blog/index.php?pk=31795&T=2

As an alternative you can also use a QR Code:  

The GUIDs for individual cells are displayed in the table below:

Regression: S.E.(k) = alpha + beta * Mean(k)
alpha51.9206116819473
beta-0.373232811678727
S.D.0.0593329219687259
T-STAT-6.29048425889856
p-value0.00811435345707744


Regression: ln S.E.(k) = alpha + beta * ln Mean(k)
alpha27.513374712804
beta-5.33631290841421
S.D.0.799114398734517
T-STAT-6.6777834523628
p-value0.00684823601032375
Lambda6.33631290841421

\begin{tabular}{lllllllll}
\hline
Regression: ln S.E.(k) = alpha + beta * ln Mean(k) \tabularnewline
alpha & 27.513374712804 \tabularnewline
beta & -5.33631290841421 \tabularnewline
S.D. & 0.799114398734517 \tabularnewline
T-STAT & -6.6777834523628 \tabularnewline
p-value & 0.00684823601032375 \tabularnewline
Lambda & 6.33631290841421 \tabularnewline
\hline
\end{tabular}
%Source: https://freestatistics.org/blog/index.php?pk=31795&T=3

[TABLE]
[ROW][C]Regression: ln S.E.(k) = alpha + beta * ln Mean(k)[/C][/ROW]
[ROW][C]alpha[/C][C]27.513374712804[/C][/ROW]
[ROW][C]beta[/C][C]-5.33631290841421[/C][/ROW]
[ROW][C]S.D.[/C][C]0.799114398734517[/C][/ROW]
[ROW][C]T-STAT[/C][C]-6.6777834523628[/C][/ROW]
[ROW][C]p-value[/C][C]0.00684823601032375[/C][/ROW]
[ROW][C]Lambda[/C][C]6.33631290841421[/C][/ROW]
[/TABLE]
Source: https://freestatistics.org/blog/index.php?pk=31795&T=3

Globally Unique Identifier (entire table): ba.freestatistics.org/blog/index.php?pk=31795&T=3

As an alternative you can also use a QR Code:  

The GUIDs for individual cells are displayed in the table below:

Regression: ln S.E.(k) = alpha + beta * ln Mean(k)
alpha27.513374712804
beta-5.33631290841421
S.D.0.799114398734517
T-STAT-6.6777834523628
p-value0.00684823601032375
Lambda6.33631290841421


Parameters (Session):
par1 = 12 ;
Parameters (R input):
par1 = 12 ;
R code (references can be found in the software module):
par1 <- as.numeric(par1)
(n <- length(x))
(np <- floor(n / par1))
arr <- array(NA,dim=c(par1,np))
j <- 0
k <- 1
for (i in 1:(np*par1))
{
j = j + 1
arr[j,k] <- x[i]
if (j == par1) {
j = 0
k=k+1
}
}
arr
arr.mean <- array(NA,dim=np)
arr.sd <- array(NA,dim=np)
arr.range <- array(NA,dim=np)
for (j in 1:np)
{
arr.mean[j] <- mean(arr[,j],na.rm=TRUE)
arr.sd[j] <- sd(arr[,j],na.rm=TRUE)
arr.range[j] <- max(arr[,j],na.rm=TRUE) - min(arr[,j],na.rm=TRUE)
}
arr.mean
arr.sd
arr.range
(lm1 <- lm(arr.sd~arr.mean))
(lnlm1 <- lm(log(arr.sd)~log(arr.mean)))
(lm2 <- lm(arr.range~arr.mean))
bitmap(file='test1.png')
plot(arr.mean,arr.sd,main='Standard Deviation-Mean Plot',xlab='mean',ylab='standard deviation')
dev.off()
bitmap(file='test2.png')
plot(arr.mean,arr.range,main='Range-Mean Plot',xlab='mean',ylab='range')
dev.off()
load(file='createtable')
a<-table.start()
a<-table.row.start(a)
a<-table.element(a,'Standard Deviation-Mean Plot',4,TRUE)
a<-table.row.end(a)
a<-table.row.start(a)
a<-table.element(a,'Section',header=TRUE)
a<-table.element(a,'Mean',header=TRUE)
a<-table.element(a,'Standard Deviation',header=TRUE)
a<-table.element(a,'Range',header=TRUE)
a<-table.row.end(a)
for (j in 1:np) {
a<-table.row.start(a)
a<-table.element(a,j,header=TRUE)
a<-table.element(a,arr.mean[j])
a<-table.element(a,arr.sd[j] )
a<-table.element(a,arr.range[j] )
a<-table.row.end(a)
}
a<-table.end(a)
table.save(a,file='mytable.tab')
a<-table.start()
a<-table.row.start(a)
a<-table.element(a,'Regression: S.E.(k) = alpha + beta * Mean(k)',2,TRUE)
a<-table.row.end(a)
a<-table.row.start(a)
a<-table.element(a,'alpha',header=TRUE)
a<-table.element(a,lm1$coefficients[[1]])
a<-table.row.end(a)
a<-table.row.start(a)
a<-table.element(a,'beta',header=TRUE)
a<-table.element(a,lm1$coefficients[[2]])
a<-table.row.end(a)
a<-table.row.start(a)
a<-table.element(a,'S.D.',header=TRUE)
a<-table.element(a,summary(lm1)$coefficients[2,2])
a<-table.row.end(a)
a<-table.row.start(a)
a<-table.element(a,'T-STAT',header=TRUE)
a<-table.element(a,summary(lm1)$coefficients[2,3])
a<-table.row.end(a)
a<-table.row.start(a)
a<-table.element(a,'p-value',header=TRUE)
a<-table.element(a,summary(lm1)$coefficients[2,4])
a<-table.row.end(a)
a<-table.end(a)
table.save(a,file='mytable1.tab')
a<-table.start()
a<-table.row.start(a)
a<-table.element(a,'Regression: ln S.E.(k) = alpha + beta * ln Mean(k)',2,TRUE)
a<-table.row.end(a)
a<-table.row.start(a)
a<-table.element(a,'alpha',header=TRUE)
a<-table.element(a,lnlm1$coefficients[[1]])
a<-table.row.end(a)
a<-table.row.start(a)
a<-table.element(a,'beta',header=TRUE)
a<-table.element(a,lnlm1$coefficients[[2]])
a<-table.row.end(a)
a<-table.row.start(a)
a<-table.element(a,'S.D.',header=TRUE)
a<-table.element(a,summary(lnlm1)$coefficients[2,2])
a<-table.row.end(a)
a<-table.row.start(a)
a<-table.element(a,'T-STAT',header=TRUE)
a<-table.element(a,summary(lnlm1)$coefficients[2,3])
a<-table.row.end(a)
a<-table.row.start(a)
a<-table.element(a,'p-value',header=TRUE)
a<-table.element(a,summary(lnlm1)$coefficients[2,4])
a<-table.row.end(a)
a<-table.row.start(a)
a<-table.element(a,'Lambda',header=TRUE)
a<-table.element(a,1-lnlm1$coefficients[[2]])
a<-table.row.end(a)
a<-table.end(a)
table.save(a,file='mytable2.tab')