Free Statistics

of Irreproducible Research!

Author's title

Author*Unverified author*
R Software Modulerwasp_spectrum.wasp
Title produced by softwareSpectral Analysis
Date of computationTue, 09 Dec 2008 12:54:42 -0700
Cite this page as followsStatistical Computations at FreeStatistics.org, Office for Research Development and Education, URL https://freestatistics.org/blog/index.php?v=date/2008/Dec/09/t1228852527vygde2zrbmyfyn0.htm/, Retrieved Sun, 19 May 2024 10:10:33 +0000
Statistical Computations at FreeStatistics.org, Office for Research Development and Education, URL https://freestatistics.org/blog/index.php?pk=31754, Retrieved Sun, 19 May 2024 10:10:33 +0000
QR Codes:

Original text written by user:
IsPrivate?No (this computation is public)
User-defined keywordsk_vanderheggen
Estimated Impact180
Family? (F = Feedback message, R = changed R code, M = changed R Module, P = changed Parameters, D = changed Data)
F       [Spectral Analysis] [eigen tijdreeks p...] [2008-12-09 19:54:42] [2731fa16c50d4727d0297daf34574cde] [Current]
-   P     [Spectral Analysis] [paper periodogram] [2008-12-14 16:25:55] [1640119c345fbfa2091dc1243f79f7a6]
-   P     [Spectral Analysis] [] [2008-12-16 14:16:33] [74be16979710d4c4e7c6647856088456]
Feedback Forum
2008-12-14 14:00:55 [Jasmine Hendrikx] [reply
Evaluatie stap 3 Spectral Analysis:
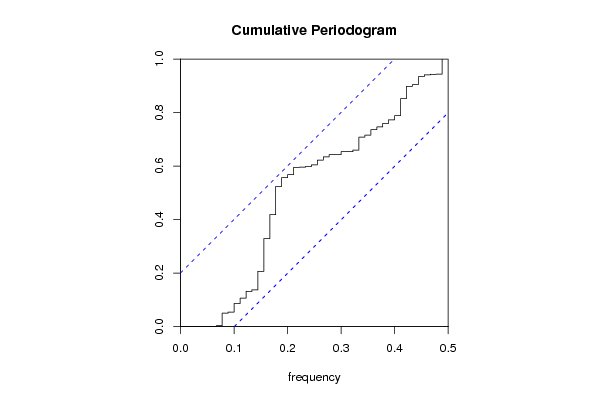
De berekening is goed uitgevoerd met d=2 en D=0. Er is inderdaad een hele verbetering opgetreden, zoals de student correct vermeldt. De langetermijntrend is nu verdwenen (geen steile lijn meer aan de linkerkant). De lijn ligt nu inderdaad in het betrouwbaarheidsinterval, maar als men het beginpunt van de lijn op de diagonaal zou zetten, zou je zien dat er toch nog een deel buiten het betrouwbaarheidsinterval zou vallen, waardoor er dus nog wel een zekere verklaarbaarheid zou overblijven. Er zouden bijvoorbeeld ook nog conjunctuurbewegingen in kunnen zitten. Dit is ook vrij logisch, aangezien er hier gewerkt wordt met werkloosheidscijfers. Er lijkt precies toch nog seizoenaliteit aanwezig te zijn door de trappen, maar er treedt inderdaad geen verbetering op met D=1.
2008-12-16 14:18:01 [Peter Van Doninck] [reply
http://www.freestatistics.org/blog/index.php?v=date/2008/Dec/16/t1229437024c00ueym25v1s3jb.htm

dit is de correcte berekening! Hier valt het op dat de afwijking naar boven groter is dan bij de versie die de studente verbeterd heeft. Het valt hier op dat we te maken hebben met een AR-proces (afwijking naar boven toe)

Post a new message
Dataseries X:
5.5
5.3
5.2
5.3
5.3
5
4.8
4.9
5.3
6
6.2
6.4
6.4
6.4
6.2
6.1
6
5.9
6.2
6.2
6.4
6.8
6.9
7
7
6.9
6.7
6.6
6.5
6.4
6.5
6.5
6.6
6.7
6.8
7.2
7.6
7.6
7.3
6.4
6.1
6.3
7.1
7.5
7.4
7.1
6.8
6.9
7.2
7.4
7.3
6.9
6.9
6.8
7.1
7.2
7.1
7
6.9
7
7.4
7.5
7.5
7.4
7.3
7
6.7
6.5
6.5
6.5
6.6
6.8
6.9
6.9
6.8
6.8
6.5
6.1
6
5.9
5.8
5.9
5.9
6.2
6.3
6.2
6
5.8
5.5
5.5
5.7
5.8


Summary of computational transaction
Raw Inputview raw input (R code)
Raw Outputview raw output of R engine
Computing time1 seconds
R Server'Gwilym Jenkins' @ 72.249.127.135

\begin{tabular}{lllllllll}
\hline
Summary of computational transaction \tabularnewline
Raw Input & view raw input (R code)  \tabularnewline
Raw Output & view raw output of R engine  \tabularnewline
Computing time & 1 seconds \tabularnewline
R Server & 'Gwilym Jenkins' @ 72.249.127.135 \tabularnewline
\hline
\end{tabular}
%Source: https://freestatistics.org/blog/index.php?pk=31754&T=0

[TABLE]
[ROW][C]Summary of computational transaction[/C][/ROW]
[ROW][C]Raw Input[/C][C]view raw input (R code) [/C][/ROW]
[ROW][C]Raw Output[/C][C]view raw output of R engine [/C][/ROW]
[ROW][C]Computing time[/C][C]1 seconds[/C][/ROW]
[ROW][C]R Server[/C][C]'Gwilym Jenkins' @ 72.249.127.135[/C][/ROW]
[/TABLE]
Source: https://freestatistics.org/blog/index.php?pk=31754&T=0

Globally Unique Identifier (entire table): ba.freestatistics.org/blog/index.php?pk=31754&T=0

As an alternative you can also use a QR Code:  

The GUIDs for individual cells are displayed in the table below:

Summary of computational transaction
Raw Inputview raw input (R code)
Raw Outputview raw output of R engine
Computing time1 seconds
R Server'Gwilym Jenkins' @ 72.249.127.135


Raw Periodogram
ParameterValue
Box-Cox transformation parameter (lambda)1
Degree of non-seasonal differencing (d)2
Degree of seasonal differencing (D)0
Seasonal Period (s)12
Frequency (Period)Spectrum
0.0111 (90)0.000282
0.0222 (45)0.000633
0.0333 (30)0.000158
0.0444 (22.5)0.001322
0.0556 (18)0.000744
0.0667 (15)0.006079
0.0778 (12.8571)0.12711
0.0889 (11.25)0.010577
0.1 (10)0.08693
0.1111 (9)0.053983
0.1222 (8.1818)0.069496
0.1333 (7.5)0.014437
0.1444 (6.9231)0.18808
0.1556 (6.4286)0.330672
0.1667 (6)0.244071
0.1778 (5.625)0.284337
0.1889 (5.2941)0.089366
0.2 (5)0.029505
0.2111 (4.7368)0.075021
0.2222 (4.5)0.001595
0.2333 (4.2857)0.0058
0.2444 (4.0909)0.015779
0.2556 (3.913)0.04884
0.2667 (3.75)0.033989
0.2778 (3.6)0.020917
0.2889 (3.4615)0.000835
0.3 (3.3333)0.029574
0.3111 (3.2143)0.001831
0.3222 (3.1034)0.014875
0.3333 (3)0.131098
0.3444 (2.9032)0.019225
0.3556 (2.8125)0.056314
0.3667 (2.7273)0.028275
0.3778 (2.6471)0.034443
0.3889 (2.5714)0.037817
0.4 (2.5)0.04182
0.4111 (2.4324)0.171217
0.4222 (2.3684)0.124223
0.4333 (2.3077)0.017208
0.4444 (2.25)0.080965
0.4556 (2.1951)0.01984
0.4667 (2.1429)0.004898
0.4778 (2.093)0.001774
0.4889 (2.0455)0.151875
0.5 (2)0.022386

\begin{tabular}{lllllllll}
\hline
Raw Periodogram \tabularnewline
Parameter & Value \tabularnewline
Box-Cox transformation parameter (lambda) & 1 \tabularnewline
Degree of non-seasonal differencing (d) & 2 \tabularnewline
Degree of seasonal differencing (D) & 0 \tabularnewline
Seasonal Period (s) & 12 \tabularnewline
Frequency (Period) & Spectrum \tabularnewline
0.0111 (90) & 0.000282 \tabularnewline
0.0222 (45) & 0.000633 \tabularnewline
0.0333 (30) & 0.000158 \tabularnewline
0.0444 (22.5) & 0.001322 \tabularnewline
0.0556 (18) & 0.000744 \tabularnewline
0.0667 (15) & 0.006079 \tabularnewline
0.0778 (12.8571) & 0.12711 \tabularnewline
0.0889 (11.25) & 0.010577 \tabularnewline
0.1 (10) & 0.08693 \tabularnewline
0.1111 (9) & 0.053983 \tabularnewline
0.1222 (8.1818) & 0.069496 \tabularnewline
0.1333 (7.5) & 0.014437 \tabularnewline
0.1444 (6.9231) & 0.18808 \tabularnewline
0.1556 (6.4286) & 0.330672 \tabularnewline
0.1667 (6) & 0.244071 \tabularnewline
0.1778 (5.625) & 0.284337 \tabularnewline
0.1889 (5.2941) & 0.089366 \tabularnewline
0.2 (5) & 0.029505 \tabularnewline
0.2111 (4.7368) & 0.075021 \tabularnewline
0.2222 (4.5) & 0.001595 \tabularnewline
0.2333 (4.2857) & 0.0058 \tabularnewline
0.2444 (4.0909) & 0.015779 \tabularnewline
0.2556 (3.913) & 0.04884 \tabularnewline
0.2667 (3.75) & 0.033989 \tabularnewline
0.2778 (3.6) & 0.020917 \tabularnewline
0.2889 (3.4615) & 0.000835 \tabularnewline
0.3 (3.3333) & 0.029574 \tabularnewline
0.3111 (3.2143) & 0.001831 \tabularnewline
0.3222 (3.1034) & 0.014875 \tabularnewline
0.3333 (3) & 0.131098 \tabularnewline
0.3444 (2.9032) & 0.019225 \tabularnewline
0.3556 (2.8125) & 0.056314 \tabularnewline
0.3667 (2.7273) & 0.028275 \tabularnewline
0.3778 (2.6471) & 0.034443 \tabularnewline
0.3889 (2.5714) & 0.037817 \tabularnewline
0.4 (2.5) & 0.04182 \tabularnewline
0.4111 (2.4324) & 0.171217 \tabularnewline
0.4222 (2.3684) & 0.124223 \tabularnewline
0.4333 (2.3077) & 0.017208 \tabularnewline
0.4444 (2.25) & 0.080965 \tabularnewline
0.4556 (2.1951) & 0.01984 \tabularnewline
0.4667 (2.1429) & 0.004898 \tabularnewline
0.4778 (2.093) & 0.001774 \tabularnewline
0.4889 (2.0455) & 0.151875 \tabularnewline
0.5 (2) & 0.022386 \tabularnewline
\hline
\end{tabular}
%Source: https://freestatistics.org/blog/index.php?pk=31754&T=1

[TABLE]
[ROW][C]Raw Periodogram[/C][/ROW]
[ROW][C]Parameter[/C][C]Value[/C][/ROW]
[ROW][C]Box-Cox transformation parameter (lambda)[/C][C]1[/C][/ROW]
[ROW][C]Degree of non-seasonal differencing (d)[/C][C]2[/C][/ROW]
[ROW][C]Degree of seasonal differencing (D)[/C][C]0[/C][/ROW]
[ROW][C]Seasonal Period (s)[/C][C]12[/C][/ROW]
[ROW][C]Frequency (Period)[/C][C]Spectrum[/C][/ROW]
[ROW][C]0.0111 (90)[/C][C]0.000282[/C][/ROW]
[ROW][C]0.0222 (45)[/C][C]0.000633[/C][/ROW]
[ROW][C]0.0333 (30)[/C][C]0.000158[/C][/ROW]
[ROW][C]0.0444 (22.5)[/C][C]0.001322[/C][/ROW]
[ROW][C]0.0556 (18)[/C][C]0.000744[/C][/ROW]
[ROW][C]0.0667 (15)[/C][C]0.006079[/C][/ROW]
[ROW][C]0.0778 (12.8571)[/C][C]0.12711[/C][/ROW]
[ROW][C]0.0889 (11.25)[/C][C]0.010577[/C][/ROW]
[ROW][C]0.1 (10)[/C][C]0.08693[/C][/ROW]
[ROW][C]0.1111 (9)[/C][C]0.053983[/C][/ROW]
[ROW][C]0.1222 (8.1818)[/C][C]0.069496[/C][/ROW]
[ROW][C]0.1333 (7.5)[/C][C]0.014437[/C][/ROW]
[ROW][C]0.1444 (6.9231)[/C][C]0.18808[/C][/ROW]
[ROW][C]0.1556 (6.4286)[/C][C]0.330672[/C][/ROW]
[ROW][C]0.1667 (6)[/C][C]0.244071[/C][/ROW]
[ROW][C]0.1778 (5.625)[/C][C]0.284337[/C][/ROW]
[ROW][C]0.1889 (5.2941)[/C][C]0.089366[/C][/ROW]
[ROW][C]0.2 (5)[/C][C]0.029505[/C][/ROW]
[ROW][C]0.2111 (4.7368)[/C][C]0.075021[/C][/ROW]
[ROW][C]0.2222 (4.5)[/C][C]0.001595[/C][/ROW]
[ROW][C]0.2333 (4.2857)[/C][C]0.0058[/C][/ROW]
[ROW][C]0.2444 (4.0909)[/C][C]0.015779[/C][/ROW]
[ROW][C]0.2556 (3.913)[/C][C]0.04884[/C][/ROW]
[ROW][C]0.2667 (3.75)[/C][C]0.033989[/C][/ROW]
[ROW][C]0.2778 (3.6)[/C][C]0.020917[/C][/ROW]
[ROW][C]0.2889 (3.4615)[/C][C]0.000835[/C][/ROW]
[ROW][C]0.3 (3.3333)[/C][C]0.029574[/C][/ROW]
[ROW][C]0.3111 (3.2143)[/C][C]0.001831[/C][/ROW]
[ROW][C]0.3222 (3.1034)[/C][C]0.014875[/C][/ROW]
[ROW][C]0.3333 (3)[/C][C]0.131098[/C][/ROW]
[ROW][C]0.3444 (2.9032)[/C][C]0.019225[/C][/ROW]
[ROW][C]0.3556 (2.8125)[/C][C]0.056314[/C][/ROW]
[ROW][C]0.3667 (2.7273)[/C][C]0.028275[/C][/ROW]
[ROW][C]0.3778 (2.6471)[/C][C]0.034443[/C][/ROW]
[ROW][C]0.3889 (2.5714)[/C][C]0.037817[/C][/ROW]
[ROW][C]0.4 (2.5)[/C][C]0.04182[/C][/ROW]
[ROW][C]0.4111 (2.4324)[/C][C]0.171217[/C][/ROW]
[ROW][C]0.4222 (2.3684)[/C][C]0.124223[/C][/ROW]
[ROW][C]0.4333 (2.3077)[/C][C]0.017208[/C][/ROW]
[ROW][C]0.4444 (2.25)[/C][C]0.080965[/C][/ROW]
[ROW][C]0.4556 (2.1951)[/C][C]0.01984[/C][/ROW]
[ROW][C]0.4667 (2.1429)[/C][C]0.004898[/C][/ROW]
[ROW][C]0.4778 (2.093)[/C][C]0.001774[/C][/ROW]
[ROW][C]0.4889 (2.0455)[/C][C]0.151875[/C][/ROW]
[ROW][C]0.5 (2)[/C][C]0.022386[/C][/ROW]
[/TABLE]
Source: https://freestatistics.org/blog/index.php?pk=31754&T=1

Globally Unique Identifier (entire table): ba.freestatistics.org/blog/index.php?pk=31754&T=1

As an alternative you can also use a QR Code:  

The GUIDs for individual cells are displayed in the table below:

Raw Periodogram
ParameterValue
Box-Cox transformation parameter (lambda)1
Degree of non-seasonal differencing (d)2
Degree of seasonal differencing (D)0
Seasonal Period (s)12
Frequency (Period)Spectrum
0.0111 (90)0.000282
0.0222 (45)0.000633
0.0333 (30)0.000158
0.0444 (22.5)0.001322
0.0556 (18)0.000744
0.0667 (15)0.006079
0.0778 (12.8571)0.12711
0.0889 (11.25)0.010577
0.1 (10)0.08693
0.1111 (9)0.053983
0.1222 (8.1818)0.069496
0.1333 (7.5)0.014437
0.1444 (6.9231)0.18808
0.1556 (6.4286)0.330672
0.1667 (6)0.244071
0.1778 (5.625)0.284337
0.1889 (5.2941)0.089366
0.2 (5)0.029505
0.2111 (4.7368)0.075021
0.2222 (4.5)0.001595
0.2333 (4.2857)0.0058
0.2444 (4.0909)0.015779
0.2556 (3.913)0.04884
0.2667 (3.75)0.033989
0.2778 (3.6)0.020917
0.2889 (3.4615)0.000835
0.3 (3.3333)0.029574
0.3111 (3.2143)0.001831
0.3222 (3.1034)0.014875
0.3333 (3)0.131098
0.3444 (2.9032)0.019225
0.3556 (2.8125)0.056314
0.3667 (2.7273)0.028275
0.3778 (2.6471)0.034443
0.3889 (2.5714)0.037817
0.4 (2.5)0.04182
0.4111 (2.4324)0.171217
0.4222 (2.3684)0.124223
0.4333 (2.3077)0.017208
0.4444 (2.25)0.080965
0.4556 (2.1951)0.01984
0.4667 (2.1429)0.004898
0.4778 (2.093)0.001774
0.4889 (2.0455)0.151875
0.5 (2)0.022386


Parameters (Session):
par1 = 1 ; par2 = 2 ; par3 = 0 ; par4 = 12 ;
Parameters (R input):
par1 = 1 ; par2 = 2 ; par3 = 0 ; par4 = 12 ;
R code (references can be found in the software module):
par1 <- as.numeric(par1)
par2 <- as.numeric(par2)
par3 <- as.numeric(par3)
par4 <- as.numeric(par4)
if (par1 == 0) {
x <- log(x)
} else {
x <- (x ^ par1 - 1) / par1
}
if (par2 > 0) x <- diff(x,lag=1,difference=par2)
if (par3 > 0) x <- diff(x,lag=par4,difference=par3)
bitmap(file='test1.png')
r <- spectrum(x,main='Raw Periodogram')
dev.off()
bitmap(file='test2.png')
cpgram(x,main='Cumulative Periodogram')
dev.off()
load(file='createtable')
a<-table.start()
a<-table.row.start(a)
a<-table.element(a,'Raw Periodogram',2,TRUE)
a<-table.row.end(a)
a<-table.row.start(a)
a<-table.element(a,'Parameter',header=TRUE)
a<-table.element(a,'Value',header=TRUE)
a<-table.row.end(a)
a<-table.row.start(a)
a<-table.element(a,'Box-Cox transformation parameter (lambda)',header=TRUE)
a<-table.element(a,par1)
a<-table.row.end(a)
a<-table.row.start(a)
a<-table.element(a,'Degree of non-seasonal differencing (d)',header=TRUE)
a<-table.element(a,par2)
a<-table.row.end(a)
a<-table.row.start(a)
a<-table.element(a,'Degree of seasonal differencing (D)',header=TRUE)
a<-table.element(a,par3)
a<-table.row.end(a)
a<-table.row.start(a)
a<-table.element(a,'Seasonal Period (s)',header=TRUE)
a<-table.element(a,par4)
a<-table.row.end(a)
a<-table.row.start(a)
a<-table.element(a,'Frequency (Period)',header=TRUE)
a<-table.element(a,'Spectrum',header=TRUE)
a<-table.row.end(a)
for (i in 1:length(r$freq)) {
a<-table.row.start(a)
mylab <- round(r$freq[i],4)
mylab <- paste(mylab,' (',sep='')
mylab <- paste(mylab,round(1/r$freq[i],4),sep='')
mylab <- paste(mylab,')',sep='')
a<-table.element(a,mylab,header=TRUE)
a<-table.element(a,round(r$spec[i],6))
a<-table.row.end(a)
}
a<-table.end(a)
table.save(a,file='mytable.tab')