Free Statistics

of Irreproducible Research!

Author's title

Author*Unverified author*
R Software Modulerwasp_autocorrelation.wasp
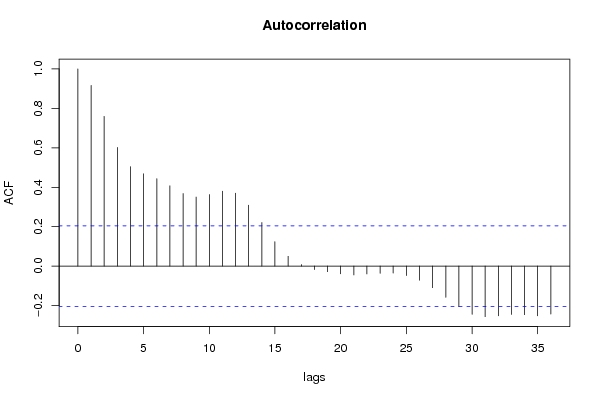
Title produced by software(Partial) Autocorrelation Function
Date of computationTue, 09 Dec 2008 12:49:31 -0700
Cite this page as followsStatistical Computations at FreeStatistics.org, Office for Research Development and Education, URL https://freestatistics.org/blog/index.php?v=date/2008/Dec/09/t1228852215ggne4iohfi7op5b.htm/, Retrieved Sun, 19 May 2024 12:02:14 +0000
Statistical Computations at FreeStatistics.org, Office for Research Development and Education, URL https://freestatistics.org/blog/index.php?pk=31748, Retrieved Sun, 19 May 2024 12:02:14 +0000
QR Codes:

Original text written by user:
IsPrivate?No (this computation is public)
User-defined keywordsk_vanderheggen
Estimated Impact150
Family? (F = Feedback message, R = changed R code, M = changed R Module, P = changed Parameters, D = changed Data)
F       [(Partial) Autocorrelation Function] [eigen tijdreeks s...] [2008-12-09 19:49:31] [2731fa16c50d4727d0297daf34574cde] [Current]
-         [(Partial) Autocorrelation Function] [Paper autocorr] [2008-12-18 15:16:05] [1640119c345fbfa2091dc1243f79f7a6]
Feedback Forum
2008-12-14 13:54:33 [Jasmine Hendrikx] [reply
Evaluatie stap 2 ACF:
De berekening is goed uitgevoerd. Er blijkt inderdaad sprake te zijn van een langetermijntrend door het dalende verloop. Er zou misschien ook seizoenaliteit kunnen inzitten, maar dit is niet zo duidelijk, aangezien de pieken niet exact overeenkomen met lag 6, 12 en op lag 24 is al helemaal niets te bespeuren. Lag 36 is zelfs negatief.
2008-12-16 14:05:38 [Peter Van Doninck] [reply
Ik ben het er mee eens dat er sprake is van een dalende lange termijntrend. Van seizoenaliteit is er minder sprake! Enkel op lag 12 is er een zekere significantie. Op lach 24 is er geen seizoenaliteit en op lag 36 is de seizoenaliteit negatief! Dit duidt erop dat er enkel niet seizoenaal gedifferentieerd dient te worden, zoals reeds bleek bij de VRM.

Post a new message
Dataseries X:
5.5
5.3
5.2
5.3
5.3
5
4.8
4.9
5.3
6
6.2
6.4
6.4
6.4
6.2
6.1
6
5.9
6.2
6.2
6.4
6.8
6.9
7
7
6.9
6.7
6.6
6.5
6.4
6.5
6.5
6.6
6.7
6.8
7.2
7.6
7.6
7.3
6.4
6.1
6.3
7.1
7.5
7.4
7.1
6.8
6.9
7.2
7.4
7.3
6.9
6.9
6.8
7.1
7.2
7.1
7
6.9
7
7.4
7.5
7.5
7.4
7.3
7
6.7
6.5
6.5
6.5
6.6
6.8
6.9
6.9
6.8
6.8
6.5
6.1
6
5.9
5.8
5.9
5.9
6.2
6.3
6.2
6
5.8
5.5
5.5
5.7
5.8


Summary of computational transaction
Raw Inputview raw input (R code)
Raw Outputview raw output of R engine
Computing time1 seconds
R Server'George Udny Yule' @ 72.249.76.132

\begin{tabular}{lllllllll}
\hline
Summary of computational transaction \tabularnewline
Raw Input & view raw input (R code)  \tabularnewline
Raw Output & view raw output of R engine  \tabularnewline
Computing time & 1 seconds \tabularnewline
R Server & 'George Udny Yule' @ 72.249.76.132 \tabularnewline
\hline
\end{tabular}
%Source: https://freestatistics.org/blog/index.php?pk=31748&T=0

[TABLE]
[ROW][C]Summary of computational transaction[/C][/ROW]
[ROW][C]Raw Input[/C][C]view raw input (R code) [/C][/ROW]
[ROW][C]Raw Output[/C][C]view raw output of R engine [/C][/ROW]
[ROW][C]Computing time[/C][C]1 seconds[/C][/ROW]
[ROW][C]R Server[/C][C]'George Udny Yule' @ 72.249.76.132[/C][/ROW]
[/TABLE]
Source: https://freestatistics.org/blog/index.php?pk=31748&T=0

Globally Unique Identifier (entire table): ba.freestatistics.org/blog/index.php?pk=31748&T=0

As an alternative you can also use a QR Code:  

The GUIDs for individual cells are displayed in the table below:

Summary of computational transaction
Raw Inputview raw input (R code)
Raw Outputview raw output of R engine
Computing time1 seconds
R Server'George Udny Yule' @ 72.249.76.132


Autocorrelation Function
Time lag kACF(k)T-STATP-value
10.9164818.79060
20.7594777.28470
30.60185.77230
40.5041214.83543e-06
50.468124.491e-05
60.4437014.25582.5e-05
70.407233.9068.9e-05
80.3677633.52750.000328
90.3501263.35830.000571
100.363153.48320.00038
110.3800683.64550.000221
120.3701523.55040.000304
130.3090492.96430.001931
140.2211142.12080.018312
150.1240981.19030.118495
160.0498940.47860.31669
170.0081180.07790.469052
18-0.017648-0.16930.432976
19-0.028495-0.27330.392613
20-0.039341-0.37730.353392
21-0.044551-0.42730.335071
22-0.039965-0.38330.351179
23-0.036363-0.34880.364026
24-0.035488-0.34040.367171
25-0.047896-0.45940.323515
26-0.071148-0.68240.24834
27-0.109182-1.04720.148868
28-0.158327-1.51860.066144
29-0.20575-1.97350.02572
30-0.244318-2.34340.010631
31-0.256341-2.45870.007907
32-0.252354-2.42050.008732
33-0.24535-2.35330.010368
34-0.246218-2.36160.010152
35-0.251803-2.41520.008852
36-0.242982-2.33060.01098

\begin{tabular}{lllllllll}
\hline
Autocorrelation Function \tabularnewline
Time lag k & ACF(k) & T-STAT & P-value \tabularnewline
1 & 0.916481 & 8.7906 & 0 \tabularnewline
2 & 0.759477 & 7.2847 & 0 \tabularnewline
3 & 0.6018 & 5.7723 & 0 \tabularnewline
4 & 0.504121 & 4.8354 & 3e-06 \tabularnewline
5 & 0.46812 & 4.49 & 1e-05 \tabularnewline
6 & 0.443701 & 4.2558 & 2.5e-05 \tabularnewline
7 & 0.40723 & 3.906 & 8.9e-05 \tabularnewline
8 & 0.367763 & 3.5275 & 0.000328 \tabularnewline
9 & 0.350126 & 3.3583 & 0.000571 \tabularnewline
10 & 0.36315 & 3.4832 & 0.00038 \tabularnewline
11 & 0.380068 & 3.6455 & 0.000221 \tabularnewline
12 & 0.370152 & 3.5504 & 0.000304 \tabularnewline
13 & 0.309049 & 2.9643 & 0.001931 \tabularnewline
14 & 0.221114 & 2.1208 & 0.018312 \tabularnewline
15 & 0.124098 & 1.1903 & 0.118495 \tabularnewline
16 & 0.049894 & 0.4786 & 0.31669 \tabularnewline
17 & 0.008118 & 0.0779 & 0.469052 \tabularnewline
18 & -0.017648 & -0.1693 & 0.432976 \tabularnewline
19 & -0.028495 & -0.2733 & 0.392613 \tabularnewline
20 & -0.039341 & -0.3773 & 0.353392 \tabularnewline
21 & -0.044551 & -0.4273 & 0.335071 \tabularnewline
22 & -0.039965 & -0.3833 & 0.351179 \tabularnewline
23 & -0.036363 & -0.3488 & 0.364026 \tabularnewline
24 & -0.035488 & -0.3404 & 0.367171 \tabularnewline
25 & -0.047896 & -0.4594 & 0.323515 \tabularnewline
26 & -0.071148 & -0.6824 & 0.24834 \tabularnewline
27 & -0.109182 & -1.0472 & 0.148868 \tabularnewline
28 & -0.158327 & -1.5186 & 0.066144 \tabularnewline
29 & -0.20575 & -1.9735 & 0.02572 \tabularnewline
30 & -0.244318 & -2.3434 & 0.010631 \tabularnewline
31 & -0.256341 & -2.4587 & 0.007907 \tabularnewline
32 & -0.252354 & -2.4205 & 0.008732 \tabularnewline
33 & -0.24535 & -2.3533 & 0.010368 \tabularnewline
34 & -0.246218 & -2.3616 & 0.010152 \tabularnewline
35 & -0.251803 & -2.4152 & 0.008852 \tabularnewline
36 & -0.242982 & -2.3306 & 0.01098 \tabularnewline
\hline
\end{tabular}
%Source: https://freestatistics.org/blog/index.php?pk=31748&T=1

[TABLE]
[ROW][C]Autocorrelation Function[/C][/ROW]
[ROW][C]Time lag k[/C][C]ACF(k)[/C][C]T-STAT[/C][C]P-value[/C][/ROW]
[ROW][C]1[/C][C]0.916481[/C][C]8.7906[/C][C]0[/C][/ROW]
[ROW][C]2[/C][C]0.759477[/C][C]7.2847[/C][C]0[/C][/ROW]
[ROW][C]3[/C][C]0.6018[/C][C]5.7723[/C][C]0[/C][/ROW]
[ROW][C]4[/C][C]0.504121[/C][C]4.8354[/C][C]3e-06[/C][/ROW]
[ROW][C]5[/C][C]0.46812[/C][C]4.49[/C][C]1e-05[/C][/ROW]
[ROW][C]6[/C][C]0.443701[/C][C]4.2558[/C][C]2.5e-05[/C][/ROW]
[ROW][C]7[/C][C]0.40723[/C][C]3.906[/C][C]8.9e-05[/C][/ROW]
[ROW][C]8[/C][C]0.367763[/C][C]3.5275[/C][C]0.000328[/C][/ROW]
[ROW][C]9[/C][C]0.350126[/C][C]3.3583[/C][C]0.000571[/C][/ROW]
[ROW][C]10[/C][C]0.36315[/C][C]3.4832[/C][C]0.00038[/C][/ROW]
[ROW][C]11[/C][C]0.380068[/C][C]3.6455[/C][C]0.000221[/C][/ROW]
[ROW][C]12[/C][C]0.370152[/C][C]3.5504[/C][C]0.000304[/C][/ROW]
[ROW][C]13[/C][C]0.309049[/C][C]2.9643[/C][C]0.001931[/C][/ROW]
[ROW][C]14[/C][C]0.221114[/C][C]2.1208[/C][C]0.018312[/C][/ROW]
[ROW][C]15[/C][C]0.124098[/C][C]1.1903[/C][C]0.118495[/C][/ROW]
[ROW][C]16[/C][C]0.049894[/C][C]0.4786[/C][C]0.31669[/C][/ROW]
[ROW][C]17[/C][C]0.008118[/C][C]0.0779[/C][C]0.469052[/C][/ROW]
[ROW][C]18[/C][C]-0.017648[/C][C]-0.1693[/C][C]0.432976[/C][/ROW]
[ROW][C]19[/C][C]-0.028495[/C][C]-0.2733[/C][C]0.392613[/C][/ROW]
[ROW][C]20[/C][C]-0.039341[/C][C]-0.3773[/C][C]0.353392[/C][/ROW]
[ROW][C]21[/C][C]-0.044551[/C][C]-0.4273[/C][C]0.335071[/C][/ROW]
[ROW][C]22[/C][C]-0.039965[/C][C]-0.3833[/C][C]0.351179[/C][/ROW]
[ROW][C]23[/C][C]-0.036363[/C][C]-0.3488[/C][C]0.364026[/C][/ROW]
[ROW][C]24[/C][C]-0.035488[/C][C]-0.3404[/C][C]0.367171[/C][/ROW]
[ROW][C]25[/C][C]-0.047896[/C][C]-0.4594[/C][C]0.323515[/C][/ROW]
[ROW][C]26[/C][C]-0.071148[/C][C]-0.6824[/C][C]0.24834[/C][/ROW]
[ROW][C]27[/C][C]-0.109182[/C][C]-1.0472[/C][C]0.148868[/C][/ROW]
[ROW][C]28[/C][C]-0.158327[/C][C]-1.5186[/C][C]0.066144[/C][/ROW]
[ROW][C]29[/C][C]-0.20575[/C][C]-1.9735[/C][C]0.02572[/C][/ROW]
[ROW][C]30[/C][C]-0.244318[/C][C]-2.3434[/C][C]0.010631[/C][/ROW]
[ROW][C]31[/C][C]-0.256341[/C][C]-2.4587[/C][C]0.007907[/C][/ROW]
[ROW][C]32[/C][C]-0.252354[/C][C]-2.4205[/C][C]0.008732[/C][/ROW]
[ROW][C]33[/C][C]-0.24535[/C][C]-2.3533[/C][C]0.010368[/C][/ROW]
[ROW][C]34[/C][C]-0.246218[/C][C]-2.3616[/C][C]0.010152[/C][/ROW]
[ROW][C]35[/C][C]-0.251803[/C][C]-2.4152[/C][C]0.008852[/C][/ROW]
[ROW][C]36[/C][C]-0.242982[/C][C]-2.3306[/C][C]0.01098[/C][/ROW]
[/TABLE]
Source: https://freestatistics.org/blog/index.php?pk=31748&T=1

Globally Unique Identifier (entire table): ba.freestatistics.org/blog/index.php?pk=31748&T=1

As an alternative you can also use a QR Code:  

The GUIDs for individual cells are displayed in the table below:

Autocorrelation Function
Time lag kACF(k)T-STATP-value
10.9164818.79060
20.7594777.28470
30.60185.77230
40.5041214.83543e-06
50.468124.491e-05
60.4437014.25582.5e-05
70.407233.9068.9e-05
80.3677633.52750.000328
90.3501263.35830.000571
100.363153.48320.00038
110.3800683.64550.000221
120.3701523.55040.000304
130.3090492.96430.001931
140.2211142.12080.018312
150.1240981.19030.118495
160.0498940.47860.31669
170.0081180.07790.469052
18-0.017648-0.16930.432976
19-0.028495-0.27330.392613
20-0.039341-0.37730.353392
21-0.044551-0.42730.335071
22-0.039965-0.38330.351179
23-0.036363-0.34880.364026
24-0.035488-0.34040.367171
25-0.047896-0.45940.323515
26-0.071148-0.68240.24834
27-0.109182-1.04720.148868
28-0.158327-1.51860.066144
29-0.20575-1.97350.02572
30-0.244318-2.34340.010631
31-0.256341-2.45870.007907
32-0.252354-2.42050.008732
33-0.24535-2.35330.010368
34-0.246218-2.36160.010152
35-0.251803-2.41520.008852
36-0.242982-2.33060.01098


Partial Autocorrelation Function
Time lag kPACF(k)T-STATP-value
10.9164818.79060
2-0.502682-4.82163e-06
30.1384561.3280.093728
40.2825462.71010.004012
50.039050.37460.354425
6-0.206579-1.98140.025264
70.0641670.61550.269882
80.1846711.77130.039911
90.0959960.92080.179791
10-0.007042-0.06750.473147
11-0.081133-0.77820.219223
12-0.037293-0.35770.360692
13-0.158808-1.52320.065565
140.010240.09820.460987
15-0.180163-1.72810.043666
160.0222040.2130.41591
170.0404260.38780.349548
18-0.071175-0.68270.248259
190.057170.54840.292388
20-0.056302-0.540.295242
210.0359680.3450.365445
220.0161570.1550.438592
23-0.042687-0.40940.341585
240.0334510.32080.374526
250.0148630.14260.443474
26-0.007225-0.06930.472451
27-0.117769-1.12960.13079
28-0.091067-0.87350.192337
290.0098320.09430.462535
30-0.041838-0.40130.344567
310.019990.19170.424187
32-0.060085-0.57630.282906
33-0.073793-0.70780.24043
34-0.007137-0.06850.472787
350.0633990.60810.27231
360.0455540.43690.331589

\begin{tabular}{lllllllll}
\hline
Partial Autocorrelation Function \tabularnewline
Time lag k & PACF(k) & T-STAT & P-value \tabularnewline
1 & 0.916481 & 8.7906 & 0 \tabularnewline
2 & -0.502682 & -4.8216 & 3e-06 \tabularnewline
3 & 0.138456 & 1.328 & 0.093728 \tabularnewline
4 & 0.282546 & 2.7101 & 0.004012 \tabularnewline
5 & 0.03905 & 0.3746 & 0.354425 \tabularnewline
6 & -0.206579 & -1.9814 & 0.025264 \tabularnewline
7 & 0.064167 & 0.6155 & 0.269882 \tabularnewline
8 & 0.184671 & 1.7713 & 0.039911 \tabularnewline
9 & 0.095996 & 0.9208 & 0.179791 \tabularnewline
10 & -0.007042 & -0.0675 & 0.473147 \tabularnewline
11 & -0.081133 & -0.7782 & 0.219223 \tabularnewline
12 & -0.037293 & -0.3577 & 0.360692 \tabularnewline
13 & -0.158808 & -1.5232 & 0.065565 \tabularnewline
14 & 0.01024 & 0.0982 & 0.460987 \tabularnewline
15 & -0.180163 & -1.7281 & 0.043666 \tabularnewline
16 & 0.022204 & 0.213 & 0.41591 \tabularnewline
17 & 0.040426 & 0.3878 & 0.349548 \tabularnewline
18 & -0.071175 & -0.6827 & 0.248259 \tabularnewline
19 & 0.05717 & 0.5484 & 0.292388 \tabularnewline
20 & -0.056302 & -0.54 & 0.295242 \tabularnewline
21 & 0.035968 & 0.345 & 0.365445 \tabularnewline
22 & 0.016157 & 0.155 & 0.438592 \tabularnewline
23 & -0.042687 & -0.4094 & 0.341585 \tabularnewline
24 & 0.033451 & 0.3208 & 0.374526 \tabularnewline
25 & 0.014863 & 0.1426 & 0.443474 \tabularnewline
26 & -0.007225 & -0.0693 & 0.472451 \tabularnewline
27 & -0.117769 & -1.1296 & 0.13079 \tabularnewline
28 & -0.091067 & -0.8735 & 0.192337 \tabularnewline
29 & 0.009832 & 0.0943 & 0.462535 \tabularnewline
30 & -0.041838 & -0.4013 & 0.344567 \tabularnewline
31 & 0.01999 & 0.1917 & 0.424187 \tabularnewline
32 & -0.060085 & -0.5763 & 0.282906 \tabularnewline
33 & -0.073793 & -0.7078 & 0.24043 \tabularnewline
34 & -0.007137 & -0.0685 & 0.472787 \tabularnewline
35 & 0.063399 & 0.6081 & 0.27231 \tabularnewline
36 & 0.045554 & 0.4369 & 0.331589 \tabularnewline
\hline
\end{tabular}
%Source: https://freestatistics.org/blog/index.php?pk=31748&T=2

[TABLE]
[ROW][C]Partial Autocorrelation Function[/C][/ROW]
[ROW][C]Time lag k[/C][C]PACF(k)[/C][C]T-STAT[/C][C]P-value[/C][/ROW]
[ROW][C]1[/C][C]0.916481[/C][C]8.7906[/C][C]0[/C][/ROW]
[ROW][C]2[/C][C]-0.502682[/C][C]-4.8216[/C][C]3e-06[/C][/ROW]
[ROW][C]3[/C][C]0.138456[/C][C]1.328[/C][C]0.093728[/C][/ROW]
[ROW][C]4[/C][C]0.282546[/C][C]2.7101[/C][C]0.004012[/C][/ROW]
[ROW][C]5[/C][C]0.03905[/C][C]0.3746[/C][C]0.354425[/C][/ROW]
[ROW][C]6[/C][C]-0.206579[/C][C]-1.9814[/C][C]0.025264[/C][/ROW]
[ROW][C]7[/C][C]0.064167[/C][C]0.6155[/C][C]0.269882[/C][/ROW]
[ROW][C]8[/C][C]0.184671[/C][C]1.7713[/C][C]0.039911[/C][/ROW]
[ROW][C]9[/C][C]0.095996[/C][C]0.9208[/C][C]0.179791[/C][/ROW]
[ROW][C]10[/C][C]-0.007042[/C][C]-0.0675[/C][C]0.473147[/C][/ROW]
[ROW][C]11[/C][C]-0.081133[/C][C]-0.7782[/C][C]0.219223[/C][/ROW]
[ROW][C]12[/C][C]-0.037293[/C][C]-0.3577[/C][C]0.360692[/C][/ROW]
[ROW][C]13[/C][C]-0.158808[/C][C]-1.5232[/C][C]0.065565[/C][/ROW]
[ROW][C]14[/C][C]0.01024[/C][C]0.0982[/C][C]0.460987[/C][/ROW]
[ROW][C]15[/C][C]-0.180163[/C][C]-1.7281[/C][C]0.043666[/C][/ROW]
[ROW][C]16[/C][C]0.022204[/C][C]0.213[/C][C]0.41591[/C][/ROW]
[ROW][C]17[/C][C]0.040426[/C][C]0.3878[/C][C]0.349548[/C][/ROW]
[ROW][C]18[/C][C]-0.071175[/C][C]-0.6827[/C][C]0.248259[/C][/ROW]
[ROW][C]19[/C][C]0.05717[/C][C]0.5484[/C][C]0.292388[/C][/ROW]
[ROW][C]20[/C][C]-0.056302[/C][C]-0.54[/C][C]0.295242[/C][/ROW]
[ROW][C]21[/C][C]0.035968[/C][C]0.345[/C][C]0.365445[/C][/ROW]
[ROW][C]22[/C][C]0.016157[/C][C]0.155[/C][C]0.438592[/C][/ROW]
[ROW][C]23[/C][C]-0.042687[/C][C]-0.4094[/C][C]0.341585[/C][/ROW]
[ROW][C]24[/C][C]0.033451[/C][C]0.3208[/C][C]0.374526[/C][/ROW]
[ROW][C]25[/C][C]0.014863[/C][C]0.1426[/C][C]0.443474[/C][/ROW]
[ROW][C]26[/C][C]-0.007225[/C][C]-0.0693[/C][C]0.472451[/C][/ROW]
[ROW][C]27[/C][C]-0.117769[/C][C]-1.1296[/C][C]0.13079[/C][/ROW]
[ROW][C]28[/C][C]-0.091067[/C][C]-0.8735[/C][C]0.192337[/C][/ROW]
[ROW][C]29[/C][C]0.009832[/C][C]0.0943[/C][C]0.462535[/C][/ROW]
[ROW][C]30[/C][C]-0.041838[/C][C]-0.4013[/C][C]0.344567[/C][/ROW]
[ROW][C]31[/C][C]0.01999[/C][C]0.1917[/C][C]0.424187[/C][/ROW]
[ROW][C]32[/C][C]-0.060085[/C][C]-0.5763[/C][C]0.282906[/C][/ROW]
[ROW][C]33[/C][C]-0.073793[/C][C]-0.7078[/C][C]0.24043[/C][/ROW]
[ROW][C]34[/C][C]-0.007137[/C][C]-0.0685[/C][C]0.472787[/C][/ROW]
[ROW][C]35[/C][C]0.063399[/C][C]0.6081[/C][C]0.27231[/C][/ROW]
[ROW][C]36[/C][C]0.045554[/C][C]0.4369[/C][C]0.331589[/C][/ROW]
[/TABLE]
Source: https://freestatistics.org/blog/index.php?pk=31748&T=2

Globally Unique Identifier (entire table): ba.freestatistics.org/blog/index.php?pk=31748&T=2

As an alternative you can also use a QR Code:  

The GUIDs for individual cells are displayed in the table below:

Partial Autocorrelation Function
Time lag kPACF(k)T-STATP-value
10.9164818.79060
2-0.502682-4.82163e-06
30.1384561.3280.093728
40.2825462.71010.004012
50.039050.37460.354425
6-0.206579-1.98140.025264
70.0641670.61550.269882
80.1846711.77130.039911
90.0959960.92080.179791
10-0.007042-0.06750.473147
11-0.081133-0.77820.219223
12-0.037293-0.35770.360692
13-0.158808-1.52320.065565
140.010240.09820.460987
15-0.180163-1.72810.043666
160.0222040.2130.41591
170.0404260.38780.349548
18-0.071175-0.68270.248259
190.057170.54840.292388
20-0.056302-0.540.295242
210.0359680.3450.365445
220.0161570.1550.438592
23-0.042687-0.40940.341585
240.0334510.32080.374526
250.0148630.14260.443474
26-0.007225-0.06930.472451
27-0.117769-1.12960.13079
28-0.091067-0.87350.192337
290.0098320.09430.462535
30-0.041838-0.40130.344567
310.019990.19170.424187
32-0.060085-0.57630.282906
33-0.073793-0.70780.24043
34-0.007137-0.06850.472787
350.0633990.60810.27231
360.0455540.43690.331589


Parameters (Session):
par1 = 36 ; par2 = 1 ; par3 = 0 ; par4 = 0 ; par5 = 12 ;
Parameters (R input):
par1 = 36 ; par2 = 1 ; par3 = 0 ; par4 = 0 ; par5 = 12 ;
R code (references can be found in the software module):
if (par1 == 'Default') {
par1 = 10*log10(length(x))
} else {
par1 <- as.numeric(par1)
}
par2 <- as.numeric(par2)
par3 <- as.numeric(par3)
par4 <- as.numeric(par4)
par5 <- as.numeric(par5)
if (par2 == 0) {
x <- log(x)
} else {
x <- (x ^ par2 - 1) / par2
}
if (par3 > 0) x <- diff(x,lag=1,difference=par3)
if (par4 > 0) x <- diff(x,lag=par5,difference=par4)
bitmap(file='pic1.png')
racf <- acf(x,par1,main='Autocorrelation',xlab='lags',ylab='ACF')
dev.off()
bitmap(file='pic2.png')
rpacf <- pacf(x,par1,main='Partial Autocorrelation',xlab='lags',ylab='PACF')
dev.off()
(myacf <- c(racf$acf))
(mypacf <- c(rpacf$acf))
lengthx <- length(x)
sqrtn <- sqrt(lengthx)
load(file='createtable')
a<-table.start()
a<-table.row.start(a)
a<-table.element(a,'Autocorrelation Function',4,TRUE)
a<-table.row.end(a)
a<-table.row.start(a)
a<-table.element(a,'Time lag k',header=TRUE)
a<-table.element(a,hyperlink('basics.htm','ACF(k)','click here for more information about the Autocorrelation Function'),header=TRUE)
a<-table.element(a,'T-STAT',header=TRUE)
a<-table.element(a,'P-value',header=TRUE)
a<-table.row.end(a)
for (i in 2:(par1+1)) {
a<-table.row.start(a)
a<-table.element(a,i-1,header=TRUE)
a<-table.element(a,round(myacf[i],6))
mytstat <- myacf[i]*sqrtn
a<-table.element(a,round(mytstat,4))
a<-table.element(a,round(1-pt(abs(mytstat),lengthx),6))
a<-table.row.end(a)
}
a<-table.end(a)
table.save(a,file='mytable.tab')
a<-table.start()
a<-table.row.start(a)
a<-table.element(a,'Partial Autocorrelation Function',4,TRUE)
a<-table.row.end(a)
a<-table.row.start(a)
a<-table.element(a,'Time lag k',header=TRUE)
a<-table.element(a,hyperlink('basics.htm','PACF(k)','click here for more information about the Partial Autocorrelation Function'),header=TRUE)
a<-table.element(a,'T-STAT',header=TRUE)
a<-table.element(a,'P-value',header=TRUE)
a<-table.row.end(a)
for (i in 1:par1) {
a<-table.row.start(a)
a<-table.element(a,i,header=TRUE)
a<-table.element(a,round(mypacf[i],6))
mytstat <- mypacf[i]*sqrtn
a<-table.element(a,round(mytstat,4))
a<-table.element(a,round(1-pt(abs(mytstat),lengthx),6))
a<-table.row.end(a)
}
a<-table.end(a)
table.save(a,file='mytable1.tab')