Free Statistics

of Irreproducible Research!

Author's title

Author*The author of this computation has been verified*
R Software Modulerwasp_arimaforecasting.wasp
Title produced by softwareARIMA Forecasting
Date of computationTue, 09 Dec 2008 12:20:45 -0700
Cite this page as followsStatistical Computations at FreeStatistics.org, Office for Research Development and Education, URL https://freestatistics.org/blog/index.php?v=date/2008/Dec/09/t1228850478stdqt6phrt9u7vs.htm/, Retrieved Sun, 19 May 2024 10:47:38 +0000
Statistical Computations at FreeStatistics.org, Office for Research Development and Education, URL https://freestatistics.org/blog/index.php?pk=31724, Retrieved Sun, 19 May 2024 10:47:38 +0000
QR Codes:

Original text written by user:
IsPrivate?No (this computation is public)
User-defined keywords
Estimated Impact142
Family? (F = Feedback message, R = changed R code, M = changed R Module, P = changed Parameters, D = changed Data)
F     [ARIMA Forecasting] [ARIMA forecasting...] [2008-12-09 15:51:08] [e1a46c1dcfccb0cb690f79a1a409b517]
-   PD    [ARIMA Forecasting] [Taak 9 - step 1 (2)] [2008-12-09 19:20:45] [b23db733701c4d62df5e228d507c1c6a] [Current]
Feedback Forum

Post a new message
Dataseries X:
267.850
255.468
246.717
238.276
229.336
231.047
264.440
261.308
257.844
253.687
248.286
248.641
243.753
233.495
222.356
211.333
202.478
202.746
238.802
235.385
224.820
219.386
213.106
213.166
208.201
197.775
189.191
178.543
171.809
172.365
204.140
205.467
193.079
190.224
185.553
185.184
183.059
175.496
168.120
160.374
155.290
156.152
189.784
192.250
184.896
184.835
180.172
181.875
182.412
180.627
174.303
169.431
163.902
166.114
198.414
205.626
199.333
199.588
196.569
200.880
201.579
195.483
190.617
187.576
183.968
186.998
216.617
224.692
222.476
223.247
225.618
232.758
235.868
232.863
227.564
226.822
223.864
227.155
260.300
273.944
270.779
268.104
268.703
273.413
275.597
270.111
262.272
255.823
250.753
250.512
277.888
289.694
281.310
275.425
271.287
274.059
274.113
267.546
257.622
250.612
243.829
243.180
275.362
287.027
279.175
282.416
275.424
277.862
284.998
272.182
258.613
253.046
243.315
234.312
265.912
279.384
262.547
256.102
251.133
249.598
251.592
244.976
237.527
232.790
224.726
223.918
252.637
263.736
251.143
239.530
232.401
233.749
232.055
224.473
215.866
207.808
199.440
193.330
222.787
241.434
221.263
207.448
200.241
205.009
206.230
198.253
194.660
185.847
180.314
176.282
203.541
222.042
197.519
185.142
176.355
180.448
180.143
173.666
165.687
162.719
157.079
153.730
182.698
200.765
176.512
166.618
158.644
159.585
163.095
159.044
155.511
153.745
150.569
150.605
179.612
194.690
189.917
184.128
175.335
179.566
181.140
177.876
175.041
169.292
166.070
166.972
206.348
215.706
202.108
195.411
193.111
195.198
198.770
194.163
190.420
189.733
186.029
191.531
232.571
243.477
227.247
217.859
208.679
213.188
216.234
213.587
209.465
204.045
200.237
203.666
241.476
260.307
243.324
244.460
233.575
237.217
235.243
230.354
227.184
221.678
217.142
219.452
256.446
265.845
248.624
241.114
229.245
231.805
219.277
219.313
212.610
214.771
211.142
211.457
240.048
240.636
230.580
208.795
197.922
194.596
194.581
185.686
178.106
172.608
167.302
168.053
202.300
202.388
182.516
173.476
166.444
171.297


Summary of computational transaction
Raw Inputview raw input (R code)
Raw Outputview raw output of R engine
Computing time5 seconds
R Server'Sir Ronald Aylmer Fisher' @ 193.190.124.24

\begin{tabular}{lllllllll}
\hline
Summary of computational transaction \tabularnewline
Raw Input & view raw input (R code)  \tabularnewline
Raw Output & view raw output of R engine  \tabularnewline
Computing time & 5 seconds \tabularnewline
R Server & 'Sir Ronald Aylmer Fisher' @ 193.190.124.24 \tabularnewline
\hline
\end{tabular}
%Source: https://freestatistics.org/blog/index.php?pk=31724&T=0

[TABLE]
[ROW][C]Summary of computational transaction[/C][/ROW]
[ROW][C]Raw Input[/C][C]view raw input (R code) [/C][/ROW]
[ROW][C]Raw Output[/C][C]view raw output of R engine [/C][/ROW]
[ROW][C]Computing time[/C][C]5 seconds[/C][/ROW]
[ROW][C]R Server[/C][C]'Sir Ronald Aylmer Fisher' @ 193.190.124.24[/C][/ROW]
[/TABLE]
Source: https://freestatistics.org/blog/index.php?pk=31724&T=0

Globally Unique Identifier (entire table): ba.freestatistics.org/blog/index.php?pk=31724&T=0

As an alternative you can also use a QR Code:  

The GUIDs for individual cells are displayed in the table below:

Summary of computational transaction
Raw Inputview raw input (R code)
Raw Outputview raw output of R engine
Computing time5 seconds
R Server'Sir Ronald Aylmer Fisher' @ 193.190.124.24


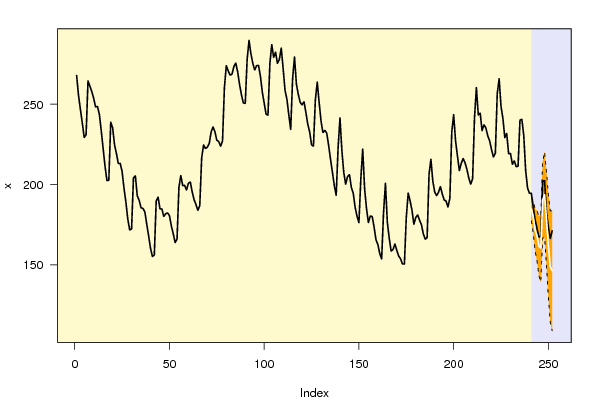
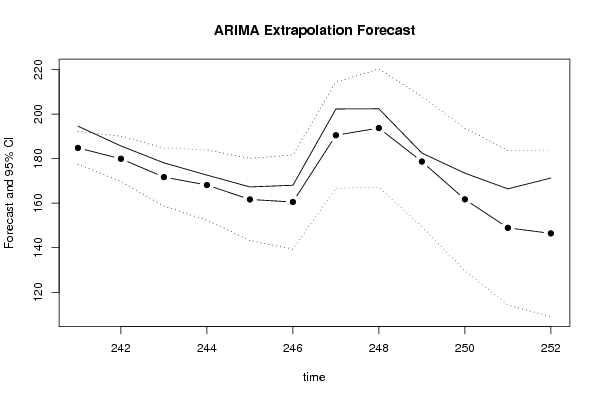
Univariate ARIMA Extrapolation Forecast
timeY[t]F[t]95% LB95% UBp-value(H0: Y[t] = F[t])P(F[t]>Y[t-1])P(F[t]>Y[t-s])P(F[t]>Y[240])
228231.805-------
229219.277-------
230219.313-------
231212.61-------
232214.771-------
233211.142-------
234211.457-------
235240.048-------
236240.636-------
237230.58-------
238208.795-------
239197.922-------
240194.596-------
241194.581184.8127177.4703192.15510.00460.004500.0045
242185.686179.9258169.7331190.11850.1340.002400.0024
243178.106171.729158.7084184.74960.16850.017803e-04
244172.608168.1534152.4064183.90050.28960.107705e-04
245167.302161.6763143.2256180.12710.27510.122802e-04
246168.053160.534139.3873181.68060.24290.265208e-04
247202.3190.5196166.6757214.36360.16640.967600.3688
248202.388193.7268167.1812220.27240.26120.26343e-040.4744
249182.516178.6876149.4356207.93950.39880.05613e-040.1432
250173.476161.7325129.7704193.69450.23570.10120.0020.0219
251166.444148.9339114.2595183.60820.16110.08270.00280.0049
252171.297146.446109.0591183.8330.09630.14720.00580.0058

\begin{tabular}{lllllllll}
\hline
Univariate ARIMA Extrapolation Forecast \tabularnewline
time & Y[t] & F[t] & 95% LB & 95% UB & p-value(H0: Y[t] = F[t]) & P(F[t]>Y[t-1]) & P(F[t]>Y[t-s]) & P(F[t]>Y[240]) \tabularnewline
228 & 231.805 & - & - & - & - & - & - & - \tabularnewline
229 & 219.277 & - & - & - & - & - & - & - \tabularnewline
230 & 219.313 & - & - & - & - & - & - & - \tabularnewline
231 & 212.61 & - & - & - & - & - & - & - \tabularnewline
232 & 214.771 & - & - & - & - & - & - & - \tabularnewline
233 & 211.142 & - & - & - & - & - & - & - \tabularnewline
234 & 211.457 & - & - & - & - & - & - & - \tabularnewline
235 & 240.048 & - & - & - & - & - & - & - \tabularnewline
236 & 240.636 & - & - & - & - & - & - & - \tabularnewline
237 & 230.58 & - & - & - & - & - & - & - \tabularnewline
238 & 208.795 & - & - & - & - & - & - & - \tabularnewline
239 & 197.922 & - & - & - & - & - & - & - \tabularnewline
240 & 194.596 & - & - & - & - & - & - & - \tabularnewline
241 & 194.581 & 184.8127 & 177.4703 & 192.1551 & 0.0046 & 0.0045 & 0 & 0.0045 \tabularnewline
242 & 185.686 & 179.9258 & 169.7331 & 190.1185 & 0.134 & 0.0024 & 0 & 0.0024 \tabularnewline
243 & 178.106 & 171.729 & 158.7084 & 184.7496 & 0.1685 & 0.0178 & 0 & 3e-04 \tabularnewline
244 & 172.608 & 168.1534 & 152.4064 & 183.9005 & 0.2896 & 0.1077 & 0 & 5e-04 \tabularnewline
245 & 167.302 & 161.6763 & 143.2256 & 180.1271 & 0.2751 & 0.1228 & 0 & 2e-04 \tabularnewline
246 & 168.053 & 160.534 & 139.3873 & 181.6806 & 0.2429 & 0.2652 & 0 & 8e-04 \tabularnewline
247 & 202.3 & 190.5196 & 166.6757 & 214.3636 & 0.1664 & 0.9676 & 0 & 0.3688 \tabularnewline
248 & 202.388 & 193.7268 & 167.1812 & 220.2724 & 0.2612 & 0.2634 & 3e-04 & 0.4744 \tabularnewline
249 & 182.516 & 178.6876 & 149.4356 & 207.9395 & 0.3988 & 0.0561 & 3e-04 & 0.1432 \tabularnewline
250 & 173.476 & 161.7325 & 129.7704 & 193.6945 & 0.2357 & 0.1012 & 0.002 & 0.0219 \tabularnewline
251 & 166.444 & 148.9339 & 114.2595 & 183.6082 & 0.1611 & 0.0827 & 0.0028 & 0.0049 \tabularnewline
252 & 171.297 & 146.446 & 109.0591 & 183.833 & 0.0963 & 0.1472 & 0.0058 & 0.0058 \tabularnewline
\hline
\end{tabular}
%Source: https://freestatistics.org/blog/index.php?pk=31724&T=1

[TABLE]
[ROW][C]Univariate ARIMA Extrapolation Forecast[/C][/ROW]
[ROW][C]time[/C][C]Y[t][/C][C]F[t][/C][C]95% LB[/C][C]95% UB[/C][C]p-value(H0: Y[t] = F[t])[/C][C]P(F[t]>Y[t-1])[/C][C]P(F[t]>Y[t-s])[/C][C]P(F[t]>Y[240])[/C][/ROW]
[ROW][C]228[/C][C]231.805[/C][C]-[/C][C]-[/C][C]-[/C][C]-[/C][C]-[/C][C]-[/C][C]-[/C][/ROW]
[ROW][C]229[/C][C]219.277[/C][C]-[/C][C]-[/C][C]-[/C][C]-[/C][C]-[/C][C]-[/C][C]-[/C][/ROW]
[ROW][C]230[/C][C]219.313[/C][C]-[/C][C]-[/C][C]-[/C][C]-[/C][C]-[/C][C]-[/C][C]-[/C][/ROW]
[ROW][C]231[/C][C]212.61[/C][C]-[/C][C]-[/C][C]-[/C][C]-[/C][C]-[/C][C]-[/C][C]-[/C][/ROW]
[ROW][C]232[/C][C]214.771[/C][C]-[/C][C]-[/C][C]-[/C][C]-[/C][C]-[/C][C]-[/C][C]-[/C][/ROW]
[ROW][C]233[/C][C]211.142[/C][C]-[/C][C]-[/C][C]-[/C][C]-[/C][C]-[/C][C]-[/C][C]-[/C][/ROW]
[ROW][C]234[/C][C]211.457[/C][C]-[/C][C]-[/C][C]-[/C][C]-[/C][C]-[/C][C]-[/C][C]-[/C][/ROW]
[ROW][C]235[/C][C]240.048[/C][C]-[/C][C]-[/C][C]-[/C][C]-[/C][C]-[/C][C]-[/C][C]-[/C][/ROW]
[ROW][C]236[/C][C]240.636[/C][C]-[/C][C]-[/C][C]-[/C][C]-[/C][C]-[/C][C]-[/C][C]-[/C][/ROW]
[ROW][C]237[/C][C]230.58[/C][C]-[/C][C]-[/C][C]-[/C][C]-[/C][C]-[/C][C]-[/C][C]-[/C][/ROW]
[ROW][C]238[/C][C]208.795[/C][C]-[/C][C]-[/C][C]-[/C][C]-[/C][C]-[/C][C]-[/C][C]-[/C][/ROW]
[ROW][C]239[/C][C]197.922[/C][C]-[/C][C]-[/C][C]-[/C][C]-[/C][C]-[/C][C]-[/C][C]-[/C][/ROW]
[ROW][C]240[/C][C]194.596[/C][C]-[/C][C]-[/C][C]-[/C][C]-[/C][C]-[/C][C]-[/C][C]-[/C][/ROW]
[ROW][C]241[/C][C]194.581[/C][C]184.8127[/C][C]177.4703[/C][C]192.1551[/C][C]0.0046[/C][C]0.0045[/C][C]0[/C][C]0.0045[/C][/ROW]
[ROW][C]242[/C][C]185.686[/C][C]179.9258[/C][C]169.7331[/C][C]190.1185[/C][C]0.134[/C][C]0.0024[/C][C]0[/C][C]0.0024[/C][/ROW]
[ROW][C]243[/C][C]178.106[/C][C]171.729[/C][C]158.7084[/C][C]184.7496[/C][C]0.1685[/C][C]0.0178[/C][C]0[/C][C]3e-04[/C][/ROW]
[ROW][C]244[/C][C]172.608[/C][C]168.1534[/C][C]152.4064[/C][C]183.9005[/C][C]0.2896[/C][C]0.1077[/C][C]0[/C][C]5e-04[/C][/ROW]
[ROW][C]245[/C][C]167.302[/C][C]161.6763[/C][C]143.2256[/C][C]180.1271[/C][C]0.2751[/C][C]0.1228[/C][C]0[/C][C]2e-04[/C][/ROW]
[ROW][C]246[/C][C]168.053[/C][C]160.534[/C][C]139.3873[/C][C]181.6806[/C][C]0.2429[/C][C]0.2652[/C][C]0[/C][C]8e-04[/C][/ROW]
[ROW][C]247[/C][C]202.3[/C][C]190.5196[/C][C]166.6757[/C][C]214.3636[/C][C]0.1664[/C][C]0.9676[/C][C]0[/C][C]0.3688[/C][/ROW]
[ROW][C]248[/C][C]202.388[/C][C]193.7268[/C][C]167.1812[/C][C]220.2724[/C][C]0.2612[/C][C]0.2634[/C][C]3e-04[/C][C]0.4744[/C][/ROW]
[ROW][C]249[/C][C]182.516[/C][C]178.6876[/C][C]149.4356[/C][C]207.9395[/C][C]0.3988[/C][C]0.0561[/C][C]3e-04[/C][C]0.1432[/C][/ROW]
[ROW][C]250[/C][C]173.476[/C][C]161.7325[/C][C]129.7704[/C][C]193.6945[/C][C]0.2357[/C][C]0.1012[/C][C]0.002[/C][C]0.0219[/C][/ROW]
[ROW][C]251[/C][C]166.444[/C][C]148.9339[/C][C]114.2595[/C][C]183.6082[/C][C]0.1611[/C][C]0.0827[/C][C]0.0028[/C][C]0.0049[/C][/ROW]
[ROW][C]252[/C][C]171.297[/C][C]146.446[/C][C]109.0591[/C][C]183.833[/C][C]0.0963[/C][C]0.1472[/C][C]0.0058[/C][C]0.0058[/C][/ROW]
[/TABLE]
Source: https://freestatistics.org/blog/index.php?pk=31724&T=1

Globally Unique Identifier (entire table): ba.freestatistics.org/blog/index.php?pk=31724&T=1

As an alternative you can also use a QR Code:  

The GUIDs for individual cells are displayed in the table below:

Univariate ARIMA Extrapolation Forecast
timeY[t]F[t]95% LB95% UBp-value(H0: Y[t] = F[t])P(F[t]>Y[t-1])P(F[t]>Y[t-s])P(F[t]>Y[240])
228231.805-------
229219.277-------
230219.313-------
231212.61-------
232214.771-------
233211.142-------
234211.457-------
235240.048-------
236240.636-------
237230.58-------
238208.795-------
239197.922-------
240194.596-------
241194.581184.8127177.4703192.15510.00460.004500.0045
242185.686179.9258169.7331190.11850.1340.002400.0024
243178.106171.729158.7084184.74960.16850.017803e-04
244172.608168.1534152.4064183.90050.28960.107705e-04
245167.302161.6763143.2256180.12710.27510.122802e-04
246168.053160.534139.3873181.68060.24290.265208e-04
247202.3190.5196166.6757214.36360.16640.967600.3688
248202.388193.7268167.1812220.27240.26120.26343e-040.4744
249182.516178.6876149.4356207.93950.39880.05613e-040.1432
250173.476161.7325129.7704193.69450.23570.10120.0020.0219
251166.444148.9339114.2595183.60820.16110.08270.00280.0049
252171.297146.446109.0591183.8330.09630.14720.00580.0058


Univariate ARIMA Extrapolation Forecast Performance
time% S.E.PEMAPESq.EMSERMSE
2410.02030.05290.004495.41967.95162.8199
2420.02890.0320.002733.18022.7651.6628
2430.03870.03710.003140.66613.38881.8409
2440.04780.02650.002219.8431.65361.2859
2450.05820.03480.002931.64832.63741.624
2460.06720.04680.003956.53594.71132.1706
2470.06390.06180.0052138.776911.56473.4007
2480.06990.04470.003775.01696.25142.5003
2490.08350.02140.001814.65691.22141.1052
2500.10080.07260.0061137.9111.49253.3901
2510.11880.11760.0098306.605225.55045.0547
2520.13030.16970.0141617.57151.46437.1739

\begin{tabular}{lllllllll}
\hline
Univariate ARIMA Extrapolation Forecast Performance \tabularnewline
time & % S.E. & PE & MAPE & Sq.E & MSE & RMSE \tabularnewline
241 & 0.0203 & 0.0529 & 0.0044 & 95.4196 & 7.9516 & 2.8199 \tabularnewline
242 & 0.0289 & 0.032 & 0.0027 & 33.1802 & 2.765 & 1.6628 \tabularnewline
243 & 0.0387 & 0.0371 & 0.0031 & 40.6661 & 3.3888 & 1.8409 \tabularnewline
244 & 0.0478 & 0.0265 & 0.0022 & 19.843 & 1.6536 & 1.2859 \tabularnewline
245 & 0.0582 & 0.0348 & 0.0029 & 31.6483 & 2.6374 & 1.624 \tabularnewline
246 & 0.0672 & 0.0468 & 0.0039 & 56.5359 & 4.7113 & 2.1706 \tabularnewline
247 & 0.0639 & 0.0618 & 0.0052 & 138.7769 & 11.5647 & 3.4007 \tabularnewline
248 & 0.0699 & 0.0447 & 0.0037 & 75.0169 & 6.2514 & 2.5003 \tabularnewline
249 & 0.0835 & 0.0214 & 0.0018 & 14.6569 & 1.2214 & 1.1052 \tabularnewline
250 & 0.1008 & 0.0726 & 0.0061 & 137.91 & 11.4925 & 3.3901 \tabularnewline
251 & 0.1188 & 0.1176 & 0.0098 & 306.6052 & 25.5504 & 5.0547 \tabularnewline
252 & 0.1303 & 0.1697 & 0.0141 & 617.571 & 51.4643 & 7.1739 \tabularnewline
\hline
\end{tabular}
%Source: https://freestatistics.org/blog/index.php?pk=31724&T=2

[TABLE]
[ROW][C]Univariate ARIMA Extrapolation Forecast Performance[/C][/ROW]
[ROW][C]time[/C][C]% S.E.[/C][C]PE[/C][C]MAPE[/C][C]Sq.E[/C][C]MSE[/C][C]RMSE[/C][/ROW]
[ROW][C]241[/C][C]0.0203[/C][C]0.0529[/C][C]0.0044[/C][C]95.4196[/C][C]7.9516[/C][C]2.8199[/C][/ROW]
[ROW][C]242[/C][C]0.0289[/C][C]0.032[/C][C]0.0027[/C][C]33.1802[/C][C]2.765[/C][C]1.6628[/C][/ROW]
[ROW][C]243[/C][C]0.0387[/C][C]0.0371[/C][C]0.0031[/C][C]40.6661[/C][C]3.3888[/C][C]1.8409[/C][/ROW]
[ROW][C]244[/C][C]0.0478[/C][C]0.0265[/C][C]0.0022[/C][C]19.843[/C][C]1.6536[/C][C]1.2859[/C][/ROW]
[ROW][C]245[/C][C]0.0582[/C][C]0.0348[/C][C]0.0029[/C][C]31.6483[/C][C]2.6374[/C][C]1.624[/C][/ROW]
[ROW][C]246[/C][C]0.0672[/C][C]0.0468[/C][C]0.0039[/C][C]56.5359[/C][C]4.7113[/C][C]2.1706[/C][/ROW]
[ROW][C]247[/C][C]0.0639[/C][C]0.0618[/C][C]0.0052[/C][C]138.7769[/C][C]11.5647[/C][C]3.4007[/C][/ROW]
[ROW][C]248[/C][C]0.0699[/C][C]0.0447[/C][C]0.0037[/C][C]75.0169[/C][C]6.2514[/C][C]2.5003[/C][/ROW]
[ROW][C]249[/C][C]0.0835[/C][C]0.0214[/C][C]0.0018[/C][C]14.6569[/C][C]1.2214[/C][C]1.1052[/C][/ROW]
[ROW][C]250[/C][C]0.1008[/C][C]0.0726[/C][C]0.0061[/C][C]137.91[/C][C]11.4925[/C][C]3.3901[/C][/ROW]
[ROW][C]251[/C][C]0.1188[/C][C]0.1176[/C][C]0.0098[/C][C]306.6052[/C][C]25.5504[/C][C]5.0547[/C][/ROW]
[ROW][C]252[/C][C]0.1303[/C][C]0.1697[/C][C]0.0141[/C][C]617.571[/C][C]51.4643[/C][C]7.1739[/C][/ROW]
[/TABLE]
Source: https://freestatistics.org/blog/index.php?pk=31724&T=2

Globally Unique Identifier (entire table): ba.freestatistics.org/blog/index.php?pk=31724&T=2

As an alternative you can also use a QR Code:  

The GUIDs for individual cells are displayed in the table below:

Univariate ARIMA Extrapolation Forecast Performance
time% S.E.PEMAPESq.EMSERMSE
2410.02030.05290.004495.41967.95162.8199
2420.02890.0320.002733.18022.7651.6628
2430.03870.03710.003140.66613.38881.8409
2440.04780.02650.002219.8431.65361.2859
2450.05820.03480.002931.64832.63741.624
2460.06720.04680.003956.53594.71132.1706
2470.06390.06180.0052138.776911.56473.4007
2480.06990.04470.003775.01696.25142.5003
2490.08350.02140.001814.65691.22141.1052
2500.10080.07260.0061137.9111.49253.3901
2510.11880.11760.0098306.605225.55045.0547
2520.13030.16970.0141617.57151.46437.1739


Parameters (Session):
par1 = 12 ; par2 = 1 ; par3 = 1 ; par4 = 1 ; par5 = 12 ; par6 = 2 ; par7 = 1 ; par8 = 0 ; par9 = 1 ; par10 = FALSE ;
Parameters (R input):
par1 = 12 ; par2 = 1 ; par3 = 1 ; par4 = 1 ; par5 = 12 ; par6 = 2 ; par7 = 1 ; par8 = 0 ; par9 = 1 ; par10 = FALSE ;
R code (references can be found in the software module):
par1 <- as.numeric(par1) #cut off periods
par2 <- as.numeric(par2) #lambda
par3 <- as.numeric(par3) #degree of non-seasonal differencing
par4 <- as.numeric(par4) #degree of seasonal differencing
par5 <- as.numeric(par5) #seasonal period
par6 <- as.numeric(par6) #p
par7 <- as.numeric(par7) #q
par8 <- as.numeric(par8) #P
par9 <- as.numeric(par9) #Q
if (par10 == 'TRUE') par10 <- TRUE
if (par10 == 'FALSE') par10 <- FALSE
if (par2 == 0) x <- log(x)
if (par2 != 0) x <- x^par2
lx <- length(x)
first <- lx - 2*par1
nx <- lx - par1
nx1 <- nx + 1
fx <- lx - nx
if (fx < 1) {
fx <- par5
nx1 <- lx + fx - 1
first <- lx - 2*fx
}
first <- 1
if (fx < 3) fx <- round(lx/10,0)
(arima.out <- arima(x[1:nx], order=c(par6,par3,par7), seasonal=list(order=c(par8,par4,par9), period=par5), include.mean=par10, method='ML'))
(forecast <- predict(arima.out,fx))
(lb <- forecast$pred - 1.96 * forecast$se)
(ub <- forecast$pred + 1.96 * forecast$se)
if (par2 == 0) {
x <- exp(x)
forecast$pred <- exp(forecast$pred)
lb <- exp(lb)
ub <- exp(ub)
}
if (par2 != 0) {
x <- x^(1/par2)
forecast$pred <- forecast$pred^(1/par2)
lb <- lb^(1/par2)
ub <- ub^(1/par2)
}
if (par2 < 0) {
olb <- lb
lb <- ub
ub <- olb
}
(actandfor <- c(x[1:nx], forecast$pred))
(perc.se <- (ub-forecast$pred)/1.96/forecast$pred)
bitmap(file='test1.png')
opar <- par(mar=c(4,4,2,2),las=1)
ylim <- c( min(x[first:nx],lb), max(x[first:nx],ub))
plot(x,ylim=ylim,type='n',xlim=c(first,lx))
usr <- par('usr')
rect(usr[1],usr[3],nx+1,usr[4],border=NA,col='lemonchiffon')
rect(nx1,usr[3],usr[2],usr[4],border=NA,col='lavender')
abline(h= (-3:3)*2 , col ='gray', lty =3)
polygon( c(nx1:lx,lx:nx1), c(lb,rev(ub)), col = 'orange', lty=2,border=NA)
lines(nx1:lx, lb , lty=2)
lines(nx1:lx, ub , lty=2)
lines(x, lwd=2)
lines(nx1:lx, forecast$pred , lwd=2 , col ='white')
box()
par(opar)
dev.off()
prob.dec <- array(NA, dim=fx)
prob.sdec <- array(NA, dim=fx)
prob.ldec <- array(NA, dim=fx)
prob.pval <- array(NA, dim=fx)
perf.pe <- array(0, dim=fx)
perf.mape <- array(0, dim=fx)
perf.se <- array(0, dim=fx)
perf.mse <- array(0, dim=fx)
perf.rmse <- array(0, dim=fx)
for (i in 1:fx) {
locSD <- (ub[i] - forecast$pred[i]) / 1.96
perf.pe[i] = (x[nx+i] - forecast$pred[i]) / forecast$pred[i]
perf.mape[i] = perf.mape[i] + abs(perf.pe[i])
perf.se[i] = (x[nx+i] - forecast$pred[i])^2
perf.mse[i] = perf.mse[i] + perf.se[i]
prob.dec[i] = pnorm((x[nx+i-1] - forecast$pred[i]) / locSD)
prob.sdec[i] = pnorm((x[nx+i-par5] - forecast$pred[i]) / locSD)
prob.ldec[i] = pnorm((x[nx] - forecast$pred[i]) / locSD)
prob.pval[i] = pnorm(abs(x[nx+i] - forecast$pred[i]) / locSD)
}
perf.mape = perf.mape / fx
perf.mse = perf.mse / fx
perf.rmse = sqrt(perf.mse)
bitmap(file='test2.png')
plot(forecast$pred, pch=19, type='b',main='ARIMA Extrapolation Forecast', ylab='Forecast and 95% CI', xlab='time',ylim=c(min(lb),max(ub)))
dum <- forecast$pred
dum[1:12] <- x[(nx+1):lx]
lines(dum, lty=1)
lines(ub,lty=3)
lines(lb,lty=3)
dev.off()
load(file='createtable')
a<-table.start()
a<-table.row.start(a)
a<-table.element(a,'Univariate ARIMA Extrapolation Forecast',9,TRUE)
a<-table.row.end(a)
a<-table.row.start(a)
a<-table.element(a,'time',1,header=TRUE)
a<-table.element(a,'Y[t]',1,header=TRUE)
a<-table.element(a,'F[t]',1,header=TRUE)
a<-table.element(a,'95% LB',1,header=TRUE)
a<-table.element(a,'95% UB',1,header=TRUE)
a<-table.element(a,'p-value
(H0: Y[t] = F[t])',1,header=TRUE)
a<-table.element(a,'P(F[t]>Y[t-1])',1,header=TRUE)
a<-table.element(a,'P(F[t]>Y[t-s])',1,header=TRUE)
mylab <- paste('P(F[t]>Y[',nx,sep='')
mylab <- paste(mylab,'])',sep='')
a<-table.element(a,mylab,1,header=TRUE)
a<-table.row.end(a)
for (i in (nx-par5):nx) {
a<-table.row.start(a)
a<-table.element(a,i,header=TRUE)
a<-table.element(a,x[i])
a<-table.element(a,'-')
a<-table.row.end(a)
}
for (i in 1:fx) {
a<-table.row.start(a)
a<-table.element(a,nx+i,header=TRUE)
a<-table.element(a,round(x[nx+i],4))
a<-table.element(a,round(forecast$pred[i],4))
a<-table.element(a,round(lb[i],4))
a<-table.element(a,round(ub[i],4))
a<-table.element(a,round((1-prob.pval[i]),4))
a<-table.element(a,round((1-prob.dec[i]),4))
a<-table.element(a,round((1-prob.sdec[i]),4))
a<-table.element(a,round((1-prob.ldec[i]),4))
a<-table.row.end(a)
}
a<-table.end(a)
table.save(a,file='mytable.tab')
a<-table.start()
a<-table.row.start(a)
a<-table.element(a,'Univariate ARIMA Extrapolation Forecast Performance',7,TRUE)
a<-table.row.end(a)
a<-table.row.start(a)
a<-table.element(a,'time',1,header=TRUE)
a<-table.element(a,'% S.E.',1,header=TRUE)
a<-table.element(a,'PE',1,header=TRUE)
a<-table.element(a,'MAPE',1,header=TRUE)
a<-table.element(a,'Sq.E',1,header=TRUE)
a<-table.element(a,'MSE',1,header=TRUE)
a<-table.element(a,'RMSE',1,header=TRUE)
a<-table.row.end(a)
for (i in 1:fx) {
a<-table.row.start(a)
a<-table.element(a,nx+i,header=TRUE)
a<-table.element(a,round(perc.se[i],4))
a<-table.element(a,round(perf.pe[i],4))
a<-table.element(a,round(perf.mape[i],4))
a<-table.element(a,round(perf.se[i],4))
a<-table.element(a,round(perf.mse[i],4))
a<-table.element(a,round(perf.rmse[i],4))
a<-table.row.end(a)
}
a<-table.end(a)
table.save(a,file='mytable1.tab')