Free Statistics

of Irreproducible Research!

Author's title

Author*Unverified author*
R Software Modulerwasp_autocorrelation.wasp
Title produced by software(Partial) Autocorrelation Function
Date of computationTue, 09 Dec 2008 11:56:19 -0700
Cite this page as followsStatistical Computations at FreeStatistics.org, Office for Research Development and Education, URL https://freestatistics.org/blog/index.php?v=date/2008/Dec/09/t1228849002oa65a9tt7f9c8xv.htm/, Retrieved Sun, 19 May 2024 08:52:15 +0000
Statistical Computations at FreeStatistics.org, Office for Research Development and Education, URL https://freestatistics.org/blog/index.php?pk=31696, Retrieved Sun, 19 May 2024 08:52:15 +0000
QR Codes:

Original text written by user:
IsPrivate?No (this computation is public)
User-defined keywords
Estimated Impact179
Family? (F = Feedback message, R = changed R code, M = changed R Module, P = changed Parameters, D = changed Data)
-     [Univariate Data Series] [data set] [2008-12-01 19:54:57] [b98453cac15ba1066b407e146608df68]
F RMP   [Standard Deviation-Mean Plot] [step 1] [2008-12-06 15:53:54] [74be16979710d4c4e7c6647856088456]
F RMPD      [(Partial) Autocorrelation Function] [step 3] [2008-12-09 18:56:19] [d41d8cd98f00b204e9800998ecf8427e] [Current]
Feedback Forum
2008-12-16 18:10:45 [6066575aa30c0611e452e930b1dff53d] [reply
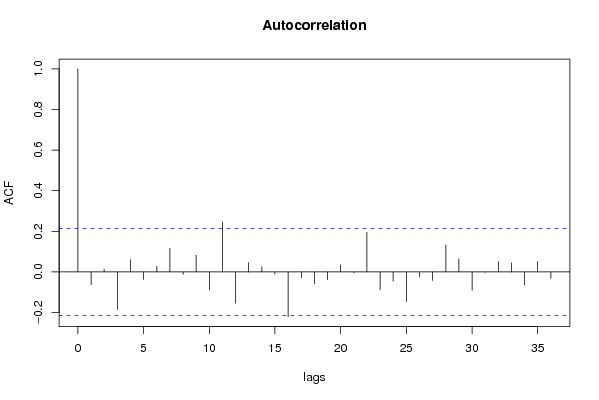
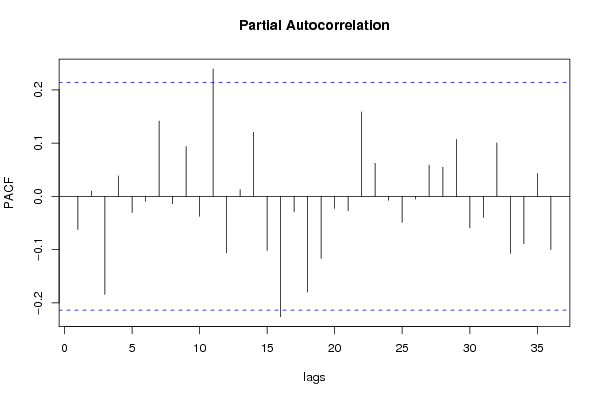
We zien inderdaad dat de seizoenaliteit en de lange termijn trend volledig zijn verdwenen.

Post a new message
Dataseries X:
113438
109416
109406
105645
101328
97686
93093
91382
122257
139183
139887
131822
116805
113706
113012
110452
107005
102841
98173
98181
137277
147579
146571
138920
130340
128140
127059
122860
117702
113537
108366
111078
150739
159129
157928
147768
137507
136919
136151
133001
125554
119647
114158
116193
152803
161761
160942
149470
139208
134588
130322
126611
122401
117352
112135
112879
148729
157230
157221
146681
136524
132111
125326
122716
116615
113719
110737
112093
143565
149946
149147
134339
122683
115614
116566
111272
104609
101802
94542
93051
124129
130374
123946
114971
105531
104919
104782
101281
94545
93248
84031
87486
115867
120327
117008
108811
104519


Summary of computational transaction
Raw Inputview raw input (R code)
Raw Outputview raw output of R engine
Computing time1 seconds
R Server'Gwilym Jenkins' @ 72.249.127.135

\begin{tabular}{lllllllll}
\hline
Summary of computational transaction \tabularnewline
Raw Input & view raw input (R code)  \tabularnewline
Raw Output & view raw output of R engine  \tabularnewline
Computing time & 1 seconds \tabularnewline
R Server & 'Gwilym Jenkins' @ 72.249.127.135 \tabularnewline
\hline
\end{tabular}
%Source: https://freestatistics.org/blog/index.php?pk=31696&T=0

[TABLE]
[ROW][C]Summary of computational transaction[/C][/ROW]
[ROW][C]Raw Input[/C][C]view raw input (R code) [/C][/ROW]
[ROW][C]Raw Output[/C][C]view raw output of R engine [/C][/ROW]
[ROW][C]Computing time[/C][C]1 seconds[/C][/ROW]
[ROW][C]R Server[/C][C]'Gwilym Jenkins' @ 72.249.127.135[/C][/ROW]
[/TABLE]
Source: https://freestatistics.org/blog/index.php?pk=31696&T=0

Globally Unique Identifier (entire table): ba.freestatistics.org/blog/index.php?pk=31696&T=0

As an alternative you can also use a QR Code:  

The GUIDs for individual cells are displayed in the table below:

Summary of computational transaction
Raw Inputview raw input (R code)
Raw Outputview raw output of R engine
Computing time1 seconds
R Server'Gwilym Jenkins' @ 72.249.127.135


Autocorrelation Function
Time lag kACF(k)T-STATP-value
1-0.062442-0.57230.284326
20.0136830.12540.45025
3-0.185124-1.69670.046729
40.0594980.54530.293492
5-0.036924-0.33840.367949
60.0284720.26090.397386
70.1168031.07050.143726
8-0.011622-0.10650.457712
90.0816680.74850.228126
10-0.088556-0.81160.209648
110.246912.2630.013109
12-0.153292-1.40490.081862
130.0464630.42580.335657
140.0258220.23670.406747
15-0.009487-0.0870.465458
16-0.220473-2.02070.02325
17-0.028943-0.26530.395725
18-0.058458-0.53580.296765
19-0.038135-0.34950.363789
200.0354080.32450.373174
21-0.003744-0.03430.486356
220.1947991.78540.038906
23-0.088484-0.8110.209838
24-0.045928-0.42090.337437
25-0.145934-1.33750.092333
26-0.023862-0.21870.413707
27-0.042333-0.3880.349503
280.1320421.21020.114802
290.0643980.59020.278316
30-0.09085-0.83270.2037
31-0.002146-0.01970.492177
320.0514690.47170.319175
330.0450090.41250.340505
34-0.063562-0.58260.280876
350.0516550.47340.318569
36-0.030738-0.28170.389425

\begin{tabular}{lllllllll}
\hline
Autocorrelation Function \tabularnewline
Time lag k & ACF(k) & T-STAT & P-value \tabularnewline
1 & -0.062442 & -0.5723 & 0.284326 \tabularnewline
2 & 0.013683 & 0.1254 & 0.45025 \tabularnewline
3 & -0.185124 & -1.6967 & 0.046729 \tabularnewline
4 & 0.059498 & 0.5453 & 0.293492 \tabularnewline
5 & -0.036924 & -0.3384 & 0.367949 \tabularnewline
6 & 0.028472 & 0.2609 & 0.397386 \tabularnewline
7 & 0.116803 & 1.0705 & 0.143726 \tabularnewline
8 & -0.011622 & -0.1065 & 0.457712 \tabularnewline
9 & 0.081668 & 0.7485 & 0.228126 \tabularnewline
10 & -0.088556 & -0.8116 & 0.209648 \tabularnewline
11 & 0.24691 & 2.263 & 0.013109 \tabularnewline
12 & -0.153292 & -1.4049 & 0.081862 \tabularnewline
13 & 0.046463 & 0.4258 & 0.335657 \tabularnewline
14 & 0.025822 & 0.2367 & 0.406747 \tabularnewline
15 & -0.009487 & -0.087 & 0.465458 \tabularnewline
16 & -0.220473 & -2.0207 & 0.02325 \tabularnewline
17 & -0.028943 & -0.2653 & 0.395725 \tabularnewline
18 & -0.058458 & -0.5358 & 0.296765 \tabularnewline
19 & -0.038135 & -0.3495 & 0.363789 \tabularnewline
20 & 0.035408 & 0.3245 & 0.373174 \tabularnewline
21 & -0.003744 & -0.0343 & 0.486356 \tabularnewline
22 & 0.194799 & 1.7854 & 0.038906 \tabularnewline
23 & -0.088484 & -0.811 & 0.209838 \tabularnewline
24 & -0.045928 & -0.4209 & 0.337437 \tabularnewline
25 & -0.145934 & -1.3375 & 0.092333 \tabularnewline
26 & -0.023862 & -0.2187 & 0.413707 \tabularnewline
27 & -0.042333 & -0.388 & 0.349503 \tabularnewline
28 & 0.132042 & 1.2102 & 0.114802 \tabularnewline
29 & 0.064398 & 0.5902 & 0.278316 \tabularnewline
30 & -0.09085 & -0.8327 & 0.2037 \tabularnewline
31 & -0.002146 & -0.0197 & 0.492177 \tabularnewline
32 & 0.051469 & 0.4717 & 0.319175 \tabularnewline
33 & 0.045009 & 0.4125 & 0.340505 \tabularnewline
34 & -0.063562 & -0.5826 & 0.280876 \tabularnewline
35 & 0.051655 & 0.4734 & 0.318569 \tabularnewline
36 & -0.030738 & -0.2817 & 0.389425 \tabularnewline
\hline
\end{tabular}
%Source: https://freestatistics.org/blog/index.php?pk=31696&T=1

[TABLE]
[ROW][C]Autocorrelation Function[/C][/ROW]
[ROW][C]Time lag k[/C][C]ACF(k)[/C][C]T-STAT[/C][C]P-value[/C][/ROW]
[ROW][C]1[/C][C]-0.062442[/C][C]-0.5723[/C][C]0.284326[/C][/ROW]
[ROW][C]2[/C][C]0.013683[/C][C]0.1254[/C][C]0.45025[/C][/ROW]
[ROW][C]3[/C][C]-0.185124[/C][C]-1.6967[/C][C]0.046729[/C][/ROW]
[ROW][C]4[/C][C]0.059498[/C][C]0.5453[/C][C]0.293492[/C][/ROW]
[ROW][C]5[/C][C]-0.036924[/C][C]-0.3384[/C][C]0.367949[/C][/ROW]
[ROW][C]6[/C][C]0.028472[/C][C]0.2609[/C][C]0.397386[/C][/ROW]
[ROW][C]7[/C][C]0.116803[/C][C]1.0705[/C][C]0.143726[/C][/ROW]
[ROW][C]8[/C][C]-0.011622[/C][C]-0.1065[/C][C]0.457712[/C][/ROW]
[ROW][C]9[/C][C]0.081668[/C][C]0.7485[/C][C]0.228126[/C][/ROW]
[ROW][C]10[/C][C]-0.088556[/C][C]-0.8116[/C][C]0.209648[/C][/ROW]
[ROW][C]11[/C][C]0.24691[/C][C]2.263[/C][C]0.013109[/C][/ROW]
[ROW][C]12[/C][C]-0.153292[/C][C]-1.4049[/C][C]0.081862[/C][/ROW]
[ROW][C]13[/C][C]0.046463[/C][C]0.4258[/C][C]0.335657[/C][/ROW]
[ROW][C]14[/C][C]0.025822[/C][C]0.2367[/C][C]0.406747[/C][/ROW]
[ROW][C]15[/C][C]-0.009487[/C][C]-0.087[/C][C]0.465458[/C][/ROW]
[ROW][C]16[/C][C]-0.220473[/C][C]-2.0207[/C][C]0.02325[/C][/ROW]
[ROW][C]17[/C][C]-0.028943[/C][C]-0.2653[/C][C]0.395725[/C][/ROW]
[ROW][C]18[/C][C]-0.058458[/C][C]-0.5358[/C][C]0.296765[/C][/ROW]
[ROW][C]19[/C][C]-0.038135[/C][C]-0.3495[/C][C]0.363789[/C][/ROW]
[ROW][C]20[/C][C]0.035408[/C][C]0.3245[/C][C]0.373174[/C][/ROW]
[ROW][C]21[/C][C]-0.003744[/C][C]-0.0343[/C][C]0.486356[/C][/ROW]
[ROW][C]22[/C][C]0.194799[/C][C]1.7854[/C][C]0.038906[/C][/ROW]
[ROW][C]23[/C][C]-0.088484[/C][C]-0.811[/C][C]0.209838[/C][/ROW]
[ROW][C]24[/C][C]-0.045928[/C][C]-0.4209[/C][C]0.337437[/C][/ROW]
[ROW][C]25[/C][C]-0.145934[/C][C]-1.3375[/C][C]0.092333[/C][/ROW]
[ROW][C]26[/C][C]-0.023862[/C][C]-0.2187[/C][C]0.413707[/C][/ROW]
[ROW][C]27[/C][C]-0.042333[/C][C]-0.388[/C][C]0.349503[/C][/ROW]
[ROW][C]28[/C][C]0.132042[/C][C]1.2102[/C][C]0.114802[/C][/ROW]
[ROW][C]29[/C][C]0.064398[/C][C]0.5902[/C][C]0.278316[/C][/ROW]
[ROW][C]30[/C][C]-0.09085[/C][C]-0.8327[/C][C]0.2037[/C][/ROW]
[ROW][C]31[/C][C]-0.002146[/C][C]-0.0197[/C][C]0.492177[/C][/ROW]
[ROW][C]32[/C][C]0.051469[/C][C]0.4717[/C][C]0.319175[/C][/ROW]
[ROW][C]33[/C][C]0.045009[/C][C]0.4125[/C][C]0.340505[/C][/ROW]
[ROW][C]34[/C][C]-0.063562[/C][C]-0.5826[/C][C]0.280876[/C][/ROW]
[ROW][C]35[/C][C]0.051655[/C][C]0.4734[/C][C]0.318569[/C][/ROW]
[ROW][C]36[/C][C]-0.030738[/C][C]-0.2817[/C][C]0.389425[/C][/ROW]
[/TABLE]
Source: https://freestatistics.org/blog/index.php?pk=31696&T=1

Globally Unique Identifier (entire table): ba.freestatistics.org/blog/index.php?pk=31696&T=1

As an alternative you can also use a QR Code:  

The GUIDs for individual cells are displayed in the table below:

Autocorrelation Function
Time lag kACF(k)T-STATP-value
1-0.062442-0.57230.284326
20.0136830.12540.45025
3-0.185124-1.69670.046729
40.0594980.54530.293492
5-0.036924-0.33840.367949
60.0284720.26090.397386
70.1168031.07050.143726
8-0.011622-0.10650.457712
90.0816680.74850.228126
10-0.088556-0.81160.209648
110.246912.2630.013109
12-0.153292-1.40490.081862
130.0464630.42580.335657
140.0258220.23670.406747
15-0.009487-0.0870.465458
16-0.220473-2.02070.02325
17-0.028943-0.26530.395725
18-0.058458-0.53580.296765
19-0.038135-0.34950.363789
200.0354080.32450.373174
21-0.003744-0.03430.486356
220.1947991.78540.038906
23-0.088484-0.8110.209838
24-0.045928-0.42090.337437
25-0.145934-1.33750.092333
26-0.023862-0.21870.413707
27-0.042333-0.3880.349503
280.1320421.21020.114802
290.0643980.59020.278316
30-0.09085-0.83270.2037
31-0.002146-0.01970.492177
320.0514690.47170.319175
330.0450090.41250.340505
34-0.063562-0.58260.280876
350.0516550.47340.318569
36-0.030738-0.28170.389425


Partial Autocorrelation Function
Time lag kPACF(k)T-STATP-value
1-0.062442-0.57230.284326
20.0098220.090.464241
3-0.184402-1.69010.047361
40.0383470.35150.363064
5-0.030361-0.27830.390748
6-0.009522-0.08730.465333
70.1412821.29490.099456
8-0.013847-0.12690.449659
90.0934250.85630.197147
10-0.037506-0.34370.365949
110.2392892.19310.015531
12-0.106069-0.97210.166886
130.0124570.11420.454688
140.120221.10180.136839
15-0.102025-0.93510.176216
16-0.226087-2.07210.02066
17-0.029284-0.26840.394528
18-0.179806-1.6480.051549
19-0.116668-1.06930.144003
20-0.022859-0.20950.417279
21-0.026938-0.24690.402797
220.1584831.45250.075041
230.061970.5680.285787
24-0.007562-0.06930.472456
25-0.049105-0.45010.326914
26-0.005093-0.04670.48144
270.0586020.53710.29631
280.0547520.50180.308557
290.1068890.97970.165036
30-0.05947-0.54510.293581
31-0.039963-0.36630.357542
320.1003250.91950.180236
33-0.107086-0.98150.164592
34-0.089348-0.81890.207584
350.0429840.3940.347308
36-0.099903-0.91560.181241

\begin{tabular}{lllllllll}
\hline
Partial Autocorrelation Function \tabularnewline
Time lag k & PACF(k) & T-STAT & P-value \tabularnewline
1 & -0.062442 & -0.5723 & 0.284326 \tabularnewline
2 & 0.009822 & 0.09 & 0.464241 \tabularnewline
3 & -0.184402 & -1.6901 & 0.047361 \tabularnewline
4 & 0.038347 & 0.3515 & 0.363064 \tabularnewline
5 & -0.030361 & -0.2783 & 0.390748 \tabularnewline
6 & -0.009522 & -0.0873 & 0.465333 \tabularnewline
7 & 0.141282 & 1.2949 & 0.099456 \tabularnewline
8 & -0.013847 & -0.1269 & 0.449659 \tabularnewline
9 & 0.093425 & 0.8563 & 0.197147 \tabularnewline
10 & -0.037506 & -0.3437 & 0.365949 \tabularnewline
11 & 0.239289 & 2.1931 & 0.015531 \tabularnewline
12 & -0.106069 & -0.9721 & 0.166886 \tabularnewline
13 & 0.012457 & 0.1142 & 0.454688 \tabularnewline
14 & 0.12022 & 1.1018 & 0.136839 \tabularnewline
15 & -0.102025 & -0.9351 & 0.176216 \tabularnewline
16 & -0.226087 & -2.0721 & 0.02066 \tabularnewline
17 & -0.029284 & -0.2684 & 0.394528 \tabularnewline
18 & -0.179806 & -1.648 & 0.051549 \tabularnewline
19 & -0.116668 & -1.0693 & 0.144003 \tabularnewline
20 & -0.022859 & -0.2095 & 0.417279 \tabularnewline
21 & -0.026938 & -0.2469 & 0.402797 \tabularnewline
22 & 0.158483 & 1.4525 & 0.075041 \tabularnewline
23 & 0.06197 & 0.568 & 0.285787 \tabularnewline
24 & -0.007562 & -0.0693 & 0.472456 \tabularnewline
25 & -0.049105 & -0.4501 & 0.326914 \tabularnewline
26 & -0.005093 & -0.0467 & 0.48144 \tabularnewline
27 & 0.058602 & 0.5371 & 0.29631 \tabularnewline
28 & 0.054752 & 0.5018 & 0.308557 \tabularnewline
29 & 0.106889 & 0.9797 & 0.165036 \tabularnewline
30 & -0.05947 & -0.5451 & 0.293581 \tabularnewline
31 & -0.039963 & -0.3663 & 0.357542 \tabularnewline
32 & 0.100325 & 0.9195 & 0.180236 \tabularnewline
33 & -0.107086 & -0.9815 & 0.164592 \tabularnewline
34 & -0.089348 & -0.8189 & 0.207584 \tabularnewline
35 & 0.042984 & 0.394 & 0.347308 \tabularnewline
36 & -0.099903 & -0.9156 & 0.181241 \tabularnewline
\hline
\end{tabular}
%Source: https://freestatistics.org/blog/index.php?pk=31696&T=2

[TABLE]
[ROW][C]Partial Autocorrelation Function[/C][/ROW]
[ROW][C]Time lag k[/C][C]PACF(k)[/C][C]T-STAT[/C][C]P-value[/C][/ROW]
[ROW][C]1[/C][C]-0.062442[/C][C]-0.5723[/C][C]0.284326[/C][/ROW]
[ROW][C]2[/C][C]0.009822[/C][C]0.09[/C][C]0.464241[/C][/ROW]
[ROW][C]3[/C][C]-0.184402[/C][C]-1.6901[/C][C]0.047361[/C][/ROW]
[ROW][C]4[/C][C]0.038347[/C][C]0.3515[/C][C]0.363064[/C][/ROW]
[ROW][C]5[/C][C]-0.030361[/C][C]-0.2783[/C][C]0.390748[/C][/ROW]
[ROW][C]6[/C][C]-0.009522[/C][C]-0.0873[/C][C]0.465333[/C][/ROW]
[ROW][C]7[/C][C]0.141282[/C][C]1.2949[/C][C]0.099456[/C][/ROW]
[ROW][C]8[/C][C]-0.013847[/C][C]-0.1269[/C][C]0.449659[/C][/ROW]
[ROW][C]9[/C][C]0.093425[/C][C]0.8563[/C][C]0.197147[/C][/ROW]
[ROW][C]10[/C][C]-0.037506[/C][C]-0.3437[/C][C]0.365949[/C][/ROW]
[ROW][C]11[/C][C]0.239289[/C][C]2.1931[/C][C]0.015531[/C][/ROW]
[ROW][C]12[/C][C]-0.106069[/C][C]-0.9721[/C][C]0.166886[/C][/ROW]
[ROW][C]13[/C][C]0.012457[/C][C]0.1142[/C][C]0.454688[/C][/ROW]
[ROW][C]14[/C][C]0.12022[/C][C]1.1018[/C][C]0.136839[/C][/ROW]
[ROW][C]15[/C][C]-0.102025[/C][C]-0.9351[/C][C]0.176216[/C][/ROW]
[ROW][C]16[/C][C]-0.226087[/C][C]-2.0721[/C][C]0.02066[/C][/ROW]
[ROW][C]17[/C][C]-0.029284[/C][C]-0.2684[/C][C]0.394528[/C][/ROW]
[ROW][C]18[/C][C]-0.179806[/C][C]-1.648[/C][C]0.051549[/C][/ROW]
[ROW][C]19[/C][C]-0.116668[/C][C]-1.0693[/C][C]0.144003[/C][/ROW]
[ROW][C]20[/C][C]-0.022859[/C][C]-0.2095[/C][C]0.417279[/C][/ROW]
[ROW][C]21[/C][C]-0.026938[/C][C]-0.2469[/C][C]0.402797[/C][/ROW]
[ROW][C]22[/C][C]0.158483[/C][C]1.4525[/C][C]0.075041[/C][/ROW]
[ROW][C]23[/C][C]0.06197[/C][C]0.568[/C][C]0.285787[/C][/ROW]
[ROW][C]24[/C][C]-0.007562[/C][C]-0.0693[/C][C]0.472456[/C][/ROW]
[ROW][C]25[/C][C]-0.049105[/C][C]-0.4501[/C][C]0.326914[/C][/ROW]
[ROW][C]26[/C][C]-0.005093[/C][C]-0.0467[/C][C]0.48144[/C][/ROW]
[ROW][C]27[/C][C]0.058602[/C][C]0.5371[/C][C]0.29631[/C][/ROW]
[ROW][C]28[/C][C]0.054752[/C][C]0.5018[/C][C]0.308557[/C][/ROW]
[ROW][C]29[/C][C]0.106889[/C][C]0.9797[/C][C]0.165036[/C][/ROW]
[ROW][C]30[/C][C]-0.05947[/C][C]-0.5451[/C][C]0.293581[/C][/ROW]
[ROW][C]31[/C][C]-0.039963[/C][C]-0.3663[/C][C]0.357542[/C][/ROW]
[ROW][C]32[/C][C]0.100325[/C][C]0.9195[/C][C]0.180236[/C][/ROW]
[ROW][C]33[/C][C]-0.107086[/C][C]-0.9815[/C][C]0.164592[/C][/ROW]
[ROW][C]34[/C][C]-0.089348[/C][C]-0.8189[/C][C]0.207584[/C][/ROW]
[ROW][C]35[/C][C]0.042984[/C][C]0.394[/C][C]0.347308[/C][/ROW]
[ROW][C]36[/C][C]-0.099903[/C][C]-0.9156[/C][C]0.181241[/C][/ROW]
[/TABLE]
Source: https://freestatistics.org/blog/index.php?pk=31696&T=2

Globally Unique Identifier (entire table): ba.freestatistics.org/blog/index.php?pk=31696&T=2

As an alternative you can also use a QR Code:  

The GUIDs for individual cells are displayed in the table below:

Partial Autocorrelation Function
Time lag kPACF(k)T-STATP-value
1-0.062442-0.57230.284326
20.0098220.090.464241
3-0.184402-1.69010.047361
40.0383470.35150.363064
5-0.030361-0.27830.390748
6-0.009522-0.08730.465333
70.1412821.29490.099456
8-0.013847-0.12690.449659
90.0934250.85630.197147
10-0.037506-0.34370.365949
110.2392892.19310.015531
12-0.106069-0.97210.166886
130.0124570.11420.454688
140.120221.10180.136839
15-0.102025-0.93510.176216
16-0.226087-2.07210.02066
17-0.029284-0.26840.394528
18-0.179806-1.6480.051549
19-0.116668-1.06930.144003
20-0.022859-0.20950.417279
21-0.026938-0.24690.402797
220.1584831.45250.075041
230.061970.5680.285787
24-0.007562-0.06930.472456
25-0.049105-0.45010.326914
26-0.005093-0.04670.48144
270.0586020.53710.29631
280.0547520.50180.308557
290.1068890.97970.165036
30-0.05947-0.54510.293581
31-0.039963-0.36630.357542
320.1003250.91950.180236
33-0.107086-0.98150.164592
34-0.089348-0.81890.207584
350.0429840.3940.347308
36-0.099903-0.91560.181241


Parameters (Session):
par1 = 36 ; par2 = 1 ; par3 = 1 ; par4 = 1 ; par5 = 12 ;
Parameters (R input):
par1 = 36 ; par2 = 1 ; par3 = 1 ; par4 = 1 ; par5 = 12 ;
R code (references can be found in the software module):
if (par1 == 'Default') {
par1 = 10*log10(length(x))
} else {
par1 <- as.numeric(par1)
}
par2 <- as.numeric(par2)
par3 <- as.numeric(par3)
par4 <- as.numeric(par4)
par5 <- as.numeric(par5)
if (par2 == 0) {
x <- log(x)
} else {
x <- (x ^ par2 - 1) / par2
}
if (par3 > 0) x <- diff(x,lag=1,difference=par3)
if (par4 > 0) x <- diff(x,lag=par5,difference=par4)
bitmap(file='pic1.png')
racf <- acf(x,par1,main='Autocorrelation',xlab='lags',ylab='ACF')
dev.off()
bitmap(file='pic2.png')
rpacf <- pacf(x,par1,main='Partial Autocorrelation',xlab='lags',ylab='PACF')
dev.off()
(myacf <- c(racf$acf))
(mypacf <- c(rpacf$acf))
lengthx <- length(x)
sqrtn <- sqrt(lengthx)
load(file='createtable')
a<-table.start()
a<-table.row.start(a)
a<-table.element(a,'Autocorrelation Function',4,TRUE)
a<-table.row.end(a)
a<-table.row.start(a)
a<-table.element(a,'Time lag k',header=TRUE)
a<-table.element(a,hyperlink('basics.htm','ACF(k)','click here for more information about the Autocorrelation Function'),header=TRUE)
a<-table.element(a,'T-STAT',header=TRUE)
a<-table.element(a,'P-value',header=TRUE)
a<-table.row.end(a)
for (i in 2:(par1+1)) {
a<-table.row.start(a)
a<-table.element(a,i-1,header=TRUE)
a<-table.element(a,round(myacf[i],6))
mytstat <- myacf[i]*sqrtn
a<-table.element(a,round(mytstat,4))
a<-table.element(a,round(1-pt(abs(mytstat),lengthx),6))
a<-table.row.end(a)
}
a<-table.end(a)
table.save(a,file='mytable.tab')
a<-table.start()
a<-table.row.start(a)
a<-table.element(a,'Partial Autocorrelation Function',4,TRUE)
a<-table.row.end(a)
a<-table.row.start(a)
a<-table.element(a,'Time lag k',header=TRUE)
a<-table.element(a,hyperlink('basics.htm','PACF(k)','click here for more information about the Partial Autocorrelation Function'),header=TRUE)
a<-table.element(a,'T-STAT',header=TRUE)
a<-table.element(a,'P-value',header=TRUE)
a<-table.row.end(a)
for (i in 1:par1) {
a<-table.row.start(a)
a<-table.element(a,i,header=TRUE)
a<-table.element(a,round(mypacf[i],6))
mytstat <- mypacf[i]*sqrtn
a<-table.element(a,round(mytstat,4))
a<-table.element(a,round(1-pt(abs(mytstat),lengthx),6))
a<-table.row.end(a)
}
a<-table.end(a)
table.save(a,file='mytable1.tab')