Free Statistics

of Irreproducible Research!

Author's title

Author*The author of this computation has been verified*
R Software Modulerwasp_autocorrelation.wasp
Title produced by software(Partial) Autocorrelation Function
Date of computationTue, 09 Dec 2008 11:47:11 -0700
Cite this page as followsStatistical Computations at FreeStatistics.org, Office for Research Development and Education, URL https://freestatistics.org/blog/index.php?v=date/2008/Dec/09/t1228848577r061f6lki8runyf.htm/, Retrieved Sun, 19 May 2024 12:42:40 +0000
Statistical Computations at FreeStatistics.org, Office for Research Development and Education, URL https://freestatistics.org/blog/index.php?pk=31690, Retrieved Sun, 19 May 2024 12:42:40 +0000
QR Codes:

Original text written by user:
IsPrivate?No (this computation is public)
User-defined keywords
Estimated Impact186
Family? (F = Feedback message, R = changed R code, M = changed R Module, P = changed Parameters, D = changed Data)
-     [Univariate Data Series] [data set] [2008-12-01 19:54:57] [b98453cac15ba1066b407e146608df68]
F RMP   [Standard Deviation-Mean Plot] [Q1 ] [2008-12-07 13:13:15] [74be16979710d4c4e7c6647856088456]
- RMPD      [(Partial) Autocorrelation Function] [testje] [2008-12-09 18:47:11] [d41d8cd98f00b204e9800998ecf8427e] [Current]
Feedback Forum

Post a new message
Dataseries X:
1091075
1514814
1748997
2424406
2747942
2377332
5210706
3882821
2197469
2271155
1618917
1391579
1143249
1445785
1870242
2597788
2436231
2684184
4705109
4331347
2369192
2283947
1749607
1598601
1221234
1497778
1823567
2489908
2532837
2456065
4627018
4276894
2314950
2238987
1652753
1561968
1115878
1596714
1910242
2286450
2772441
2394538
4715128
4402420
2325392
2306683
1725282
1541370
1168142
1457835
1816380
2446552
2575774
2537852
4728097
4372685
2302672
2346402
1689915
1576183


Summary of computational transaction
Raw Inputview raw input (R code)
Raw Outputview raw output of R engine
Computing time1 seconds
R Server'Gwilym Jenkins' @ 72.249.127.135

\begin{tabular}{lllllllll}
\hline
Summary of computational transaction \tabularnewline
Raw Input & view raw input (R code)  \tabularnewline
Raw Output & view raw output of R engine  \tabularnewline
Computing time & 1 seconds \tabularnewline
R Server & 'Gwilym Jenkins' @ 72.249.127.135 \tabularnewline
\hline
\end{tabular}
%Source: https://freestatistics.org/blog/index.php?pk=31690&T=0

[TABLE]
[ROW][C]Summary of computational transaction[/C][/ROW]
[ROW][C]Raw Input[/C][C]view raw input (R code) [/C][/ROW]
[ROW][C]Raw Output[/C][C]view raw output of R engine [/C][/ROW]
[ROW][C]Computing time[/C][C]1 seconds[/C][/ROW]
[ROW][C]R Server[/C][C]'Gwilym Jenkins' @ 72.249.127.135[/C][/ROW]
[/TABLE]
Source: https://freestatistics.org/blog/index.php?pk=31690&T=0

Globally Unique Identifier (entire table): ba.freestatistics.org/blog/index.php?pk=31690&T=0

As an alternative you can also use a QR Code:  

The GUIDs for individual cells are displayed in the table below:

Summary of computational transaction
Raw Inputview raw input (R code)
Raw Outputview raw output of R engine
Computing time1 seconds
R Server'Gwilym Jenkins' @ 72.249.127.135


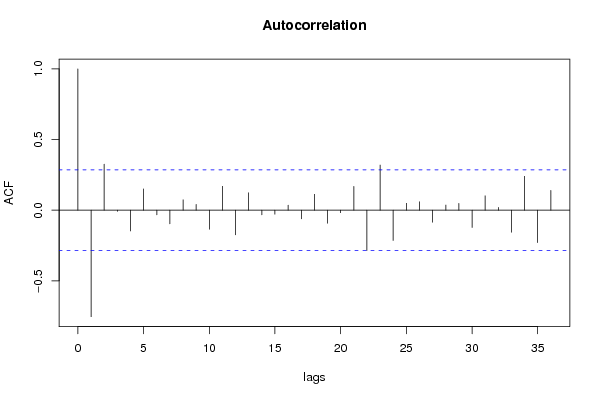
Autocorrelation Function
Time lag kACF(k)T-STATP-value
1-0.753732-5.16732e-06
20.3260462.23530.015095
3-0.008366-0.05740.477253
4-0.146745-1.0060.159776
50.1500781.02890.1544
6-0.032846-0.22520.411408
7-0.096447-0.66120.255854
80.0735880.50450.308137
90.0410120.28120.389908
10-0.134291-0.92060.180967
110.1693121.16070.125804
12-0.174256-1.19460.119111
130.1234910.84660.200751
14-0.032682-0.22410.411842
15-0.027896-0.19120.424579
160.0357120.24480.403827
17-0.060907-0.41760.339086
180.112140.76880.222932
19-0.091984-0.63060.265675
20-0.017806-0.12210.45168
210.1681161.15250.127463
22-0.285466-1.95710.028148
230.3194262.18990.016766
24-0.214081-1.46770.074428
250.0488710.3350.369542
260.0590870.40510.343628
27-0.085247-0.58440.280864
280.0363480.24920.40215
290.0475720.32610.372884
30-0.122354-0.83880.20291
310.1017460.69750.244452
320.0198440.1360.446183
33-0.155339-1.0650.14617
340.2398841.64460.053366
35-0.229077-1.57050.061507
360.139720.95790.171515

\begin{tabular}{lllllllll}
\hline
Autocorrelation Function \tabularnewline
Time lag k & ACF(k) & T-STAT & P-value \tabularnewline
1 & -0.753732 & -5.1673 & 2e-06 \tabularnewline
2 & 0.326046 & 2.2353 & 0.015095 \tabularnewline
3 & -0.008366 & -0.0574 & 0.477253 \tabularnewline
4 & -0.146745 & -1.006 & 0.159776 \tabularnewline
5 & 0.150078 & 1.0289 & 0.1544 \tabularnewline
6 & -0.032846 & -0.2252 & 0.411408 \tabularnewline
7 & -0.096447 & -0.6612 & 0.255854 \tabularnewline
8 & 0.073588 & 0.5045 & 0.308137 \tabularnewline
9 & 0.041012 & 0.2812 & 0.389908 \tabularnewline
10 & -0.134291 & -0.9206 & 0.180967 \tabularnewline
11 & 0.169312 & 1.1607 & 0.125804 \tabularnewline
12 & -0.174256 & -1.1946 & 0.119111 \tabularnewline
13 & 0.123491 & 0.8466 & 0.200751 \tabularnewline
14 & -0.032682 & -0.2241 & 0.411842 \tabularnewline
15 & -0.027896 & -0.1912 & 0.424579 \tabularnewline
16 & 0.035712 & 0.2448 & 0.403827 \tabularnewline
17 & -0.060907 & -0.4176 & 0.339086 \tabularnewline
18 & 0.11214 & 0.7688 & 0.222932 \tabularnewline
19 & -0.091984 & -0.6306 & 0.265675 \tabularnewline
20 & -0.017806 & -0.1221 & 0.45168 \tabularnewline
21 & 0.168116 & 1.1525 & 0.127463 \tabularnewline
22 & -0.285466 & -1.9571 & 0.028148 \tabularnewline
23 & 0.319426 & 2.1899 & 0.016766 \tabularnewline
24 & -0.214081 & -1.4677 & 0.074428 \tabularnewline
25 & 0.048871 & 0.335 & 0.369542 \tabularnewline
26 & 0.059087 & 0.4051 & 0.343628 \tabularnewline
27 & -0.085247 & -0.5844 & 0.280864 \tabularnewline
28 & 0.036348 & 0.2492 & 0.40215 \tabularnewline
29 & 0.047572 & 0.3261 & 0.372884 \tabularnewline
30 & -0.122354 & -0.8388 & 0.20291 \tabularnewline
31 & 0.101746 & 0.6975 & 0.244452 \tabularnewline
32 & 0.019844 & 0.136 & 0.446183 \tabularnewline
33 & -0.155339 & -1.065 & 0.14617 \tabularnewline
34 & 0.239884 & 1.6446 & 0.053366 \tabularnewline
35 & -0.229077 & -1.5705 & 0.061507 \tabularnewline
36 & 0.13972 & 0.9579 & 0.171515 \tabularnewline
\hline
\end{tabular}
%Source: https://freestatistics.org/blog/index.php?pk=31690&T=1

[TABLE]
[ROW][C]Autocorrelation Function[/C][/ROW]
[ROW][C]Time lag k[/C][C]ACF(k)[/C][C]T-STAT[/C][C]P-value[/C][/ROW]
[ROW][C]1[/C][C]-0.753732[/C][C]-5.1673[/C][C]2e-06[/C][/ROW]
[ROW][C]2[/C][C]0.326046[/C][C]2.2353[/C][C]0.015095[/C][/ROW]
[ROW][C]3[/C][C]-0.008366[/C][C]-0.0574[/C][C]0.477253[/C][/ROW]
[ROW][C]4[/C][C]-0.146745[/C][C]-1.006[/C][C]0.159776[/C][/ROW]
[ROW][C]5[/C][C]0.150078[/C][C]1.0289[/C][C]0.1544[/C][/ROW]
[ROW][C]6[/C][C]-0.032846[/C][C]-0.2252[/C][C]0.411408[/C][/ROW]
[ROW][C]7[/C][C]-0.096447[/C][C]-0.6612[/C][C]0.255854[/C][/ROW]
[ROW][C]8[/C][C]0.073588[/C][C]0.5045[/C][C]0.308137[/C][/ROW]
[ROW][C]9[/C][C]0.041012[/C][C]0.2812[/C][C]0.389908[/C][/ROW]
[ROW][C]10[/C][C]-0.134291[/C][C]-0.9206[/C][C]0.180967[/C][/ROW]
[ROW][C]11[/C][C]0.169312[/C][C]1.1607[/C][C]0.125804[/C][/ROW]
[ROW][C]12[/C][C]-0.174256[/C][C]-1.1946[/C][C]0.119111[/C][/ROW]
[ROW][C]13[/C][C]0.123491[/C][C]0.8466[/C][C]0.200751[/C][/ROW]
[ROW][C]14[/C][C]-0.032682[/C][C]-0.2241[/C][C]0.411842[/C][/ROW]
[ROW][C]15[/C][C]-0.027896[/C][C]-0.1912[/C][C]0.424579[/C][/ROW]
[ROW][C]16[/C][C]0.035712[/C][C]0.2448[/C][C]0.403827[/C][/ROW]
[ROW][C]17[/C][C]-0.060907[/C][C]-0.4176[/C][C]0.339086[/C][/ROW]
[ROW][C]18[/C][C]0.11214[/C][C]0.7688[/C][C]0.222932[/C][/ROW]
[ROW][C]19[/C][C]-0.091984[/C][C]-0.6306[/C][C]0.265675[/C][/ROW]
[ROW][C]20[/C][C]-0.017806[/C][C]-0.1221[/C][C]0.45168[/C][/ROW]
[ROW][C]21[/C][C]0.168116[/C][C]1.1525[/C][C]0.127463[/C][/ROW]
[ROW][C]22[/C][C]-0.285466[/C][C]-1.9571[/C][C]0.028148[/C][/ROW]
[ROW][C]23[/C][C]0.319426[/C][C]2.1899[/C][C]0.016766[/C][/ROW]
[ROW][C]24[/C][C]-0.214081[/C][C]-1.4677[/C][C]0.074428[/C][/ROW]
[ROW][C]25[/C][C]0.048871[/C][C]0.335[/C][C]0.369542[/C][/ROW]
[ROW][C]26[/C][C]0.059087[/C][C]0.4051[/C][C]0.343628[/C][/ROW]
[ROW][C]27[/C][C]-0.085247[/C][C]-0.5844[/C][C]0.280864[/C][/ROW]
[ROW][C]28[/C][C]0.036348[/C][C]0.2492[/C][C]0.40215[/C][/ROW]
[ROW][C]29[/C][C]0.047572[/C][C]0.3261[/C][C]0.372884[/C][/ROW]
[ROW][C]30[/C][C]-0.122354[/C][C]-0.8388[/C][C]0.20291[/C][/ROW]
[ROW][C]31[/C][C]0.101746[/C][C]0.6975[/C][C]0.244452[/C][/ROW]
[ROW][C]32[/C][C]0.019844[/C][C]0.136[/C][C]0.446183[/C][/ROW]
[ROW][C]33[/C][C]-0.155339[/C][C]-1.065[/C][C]0.14617[/C][/ROW]
[ROW][C]34[/C][C]0.239884[/C][C]1.6446[/C][C]0.053366[/C][/ROW]
[ROW][C]35[/C][C]-0.229077[/C][C]-1.5705[/C][C]0.061507[/C][/ROW]
[ROW][C]36[/C][C]0.13972[/C][C]0.9579[/C][C]0.171515[/C][/ROW]
[/TABLE]
Source: https://freestatistics.org/blog/index.php?pk=31690&T=1

Globally Unique Identifier (entire table): ba.freestatistics.org/blog/index.php?pk=31690&T=1

As an alternative you can also use a QR Code:  

The GUIDs for individual cells are displayed in the table below:

Autocorrelation Function
Time lag kACF(k)T-STATP-value
1-0.753732-5.16732e-06
20.3260462.23530.015095
3-0.008366-0.05740.477253
4-0.146745-1.0060.159776
50.1500781.02890.1544
6-0.032846-0.22520.411408
7-0.096447-0.66120.255854
80.0735880.50450.308137
90.0410120.28120.389908
10-0.134291-0.92060.180967
110.1693121.16070.125804
12-0.174256-1.19460.119111
130.1234910.84660.200751
14-0.032682-0.22410.411842
15-0.027896-0.19120.424579
160.0357120.24480.403827
17-0.060907-0.41760.339086
180.112140.76880.222932
19-0.091984-0.63060.265675
20-0.017806-0.12210.45168
210.1681161.15250.127463
22-0.285466-1.95710.028148
230.3194262.18990.016766
24-0.214081-1.46770.074428
250.0488710.3350.369542
260.0590870.40510.343628
27-0.085247-0.58440.280864
280.0363480.24920.40215
290.0475720.32610.372884
30-0.122354-0.83880.20291
310.1017460.69750.244452
320.0198440.1360.446183
33-0.155339-1.0650.14617
340.2398841.64460.053366
35-0.229077-1.57050.061507
360.139720.95790.171515


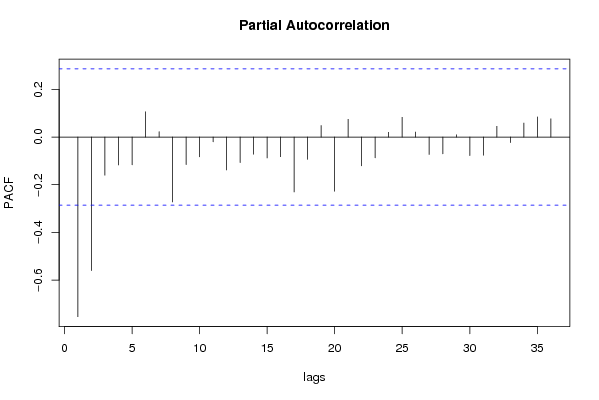
Partial Autocorrelation Function
Time lag kPACF(k)T-STATP-value
1-0.753732-5.16732e-06
2-0.560484-3.84250.000182
3-0.159782-1.09540.13946
4-0.116917-0.80150.213425
5-0.116523-0.79880.2142
60.1058780.72590.235762
70.0226440.15520.438648
8-0.272289-1.86670.034093
9-0.115621-0.79270.21598
10-0.082931-0.56850.286184
11-0.019717-0.13520.446525
12-0.138016-0.94620.174446
13-0.106841-0.73250.23376
14-0.071695-0.49150.312674
15-0.087446-0.59950.27586
16-0.08239-0.56480.287435
17-0.230039-1.57710.060744
18-0.093192-0.63890.262997
190.0485080.33260.370474
20-0.227225-1.55780.062997
210.0742610.50910.306529
22-0.120736-0.82770.206005
23-0.087336-0.59870.276108
240.0200240.13730.4457
250.0826740.56680.286779
260.0209910.14390.443095
27-0.073099-0.50110.309305
28-0.070276-0.48180.316096
290.0093660.06420.474538
30-0.077442-0.53090.298989
31-0.075921-0.52050.302585
320.0449880.30840.379563
33-0.023249-0.15940.437024
340.058840.40340.344246
350.0846020.580.282342
360.0765920.52510.300995

\begin{tabular}{lllllllll}
\hline
Partial Autocorrelation Function \tabularnewline
Time lag k & PACF(k) & T-STAT & P-value \tabularnewline
1 & -0.753732 & -5.1673 & 2e-06 \tabularnewline
2 & -0.560484 & -3.8425 & 0.000182 \tabularnewline
3 & -0.159782 & -1.0954 & 0.13946 \tabularnewline
4 & -0.116917 & -0.8015 & 0.213425 \tabularnewline
5 & -0.116523 & -0.7988 & 0.2142 \tabularnewline
6 & 0.105878 & 0.7259 & 0.235762 \tabularnewline
7 & 0.022644 & 0.1552 & 0.438648 \tabularnewline
8 & -0.272289 & -1.8667 & 0.034093 \tabularnewline
9 & -0.115621 & -0.7927 & 0.21598 \tabularnewline
10 & -0.082931 & -0.5685 & 0.286184 \tabularnewline
11 & -0.019717 & -0.1352 & 0.446525 \tabularnewline
12 & -0.138016 & -0.9462 & 0.174446 \tabularnewline
13 & -0.106841 & -0.7325 & 0.23376 \tabularnewline
14 & -0.071695 & -0.4915 & 0.312674 \tabularnewline
15 & -0.087446 & -0.5995 & 0.27586 \tabularnewline
16 & -0.08239 & -0.5648 & 0.287435 \tabularnewline
17 & -0.230039 & -1.5771 & 0.060744 \tabularnewline
18 & -0.093192 & -0.6389 & 0.262997 \tabularnewline
19 & 0.048508 & 0.3326 & 0.370474 \tabularnewline
20 & -0.227225 & -1.5578 & 0.062997 \tabularnewline
21 & 0.074261 & 0.5091 & 0.306529 \tabularnewline
22 & -0.120736 & -0.8277 & 0.206005 \tabularnewline
23 & -0.087336 & -0.5987 & 0.276108 \tabularnewline
24 & 0.020024 & 0.1373 & 0.4457 \tabularnewline
25 & 0.082674 & 0.5668 & 0.286779 \tabularnewline
26 & 0.020991 & 0.1439 & 0.443095 \tabularnewline
27 & -0.073099 & -0.5011 & 0.309305 \tabularnewline
28 & -0.070276 & -0.4818 & 0.316096 \tabularnewline
29 & 0.009366 & 0.0642 & 0.474538 \tabularnewline
30 & -0.077442 & -0.5309 & 0.298989 \tabularnewline
31 & -0.075921 & -0.5205 & 0.302585 \tabularnewline
32 & 0.044988 & 0.3084 & 0.379563 \tabularnewline
33 & -0.023249 & -0.1594 & 0.437024 \tabularnewline
34 & 0.05884 & 0.4034 & 0.344246 \tabularnewline
35 & 0.084602 & 0.58 & 0.282342 \tabularnewline
36 & 0.076592 & 0.5251 & 0.300995 \tabularnewline
\hline
\end{tabular}
%Source: https://freestatistics.org/blog/index.php?pk=31690&T=2

[TABLE]
[ROW][C]Partial Autocorrelation Function[/C][/ROW]
[ROW][C]Time lag k[/C][C]PACF(k)[/C][C]T-STAT[/C][C]P-value[/C][/ROW]
[ROW][C]1[/C][C]-0.753732[/C][C]-5.1673[/C][C]2e-06[/C][/ROW]
[ROW][C]2[/C][C]-0.560484[/C][C]-3.8425[/C][C]0.000182[/C][/ROW]
[ROW][C]3[/C][C]-0.159782[/C][C]-1.0954[/C][C]0.13946[/C][/ROW]
[ROW][C]4[/C][C]-0.116917[/C][C]-0.8015[/C][C]0.213425[/C][/ROW]
[ROW][C]5[/C][C]-0.116523[/C][C]-0.7988[/C][C]0.2142[/C][/ROW]
[ROW][C]6[/C][C]0.105878[/C][C]0.7259[/C][C]0.235762[/C][/ROW]
[ROW][C]7[/C][C]0.022644[/C][C]0.1552[/C][C]0.438648[/C][/ROW]
[ROW][C]8[/C][C]-0.272289[/C][C]-1.8667[/C][C]0.034093[/C][/ROW]
[ROW][C]9[/C][C]-0.115621[/C][C]-0.7927[/C][C]0.21598[/C][/ROW]
[ROW][C]10[/C][C]-0.082931[/C][C]-0.5685[/C][C]0.286184[/C][/ROW]
[ROW][C]11[/C][C]-0.019717[/C][C]-0.1352[/C][C]0.446525[/C][/ROW]
[ROW][C]12[/C][C]-0.138016[/C][C]-0.9462[/C][C]0.174446[/C][/ROW]
[ROW][C]13[/C][C]-0.106841[/C][C]-0.7325[/C][C]0.23376[/C][/ROW]
[ROW][C]14[/C][C]-0.071695[/C][C]-0.4915[/C][C]0.312674[/C][/ROW]
[ROW][C]15[/C][C]-0.087446[/C][C]-0.5995[/C][C]0.27586[/C][/ROW]
[ROW][C]16[/C][C]-0.08239[/C][C]-0.5648[/C][C]0.287435[/C][/ROW]
[ROW][C]17[/C][C]-0.230039[/C][C]-1.5771[/C][C]0.060744[/C][/ROW]
[ROW][C]18[/C][C]-0.093192[/C][C]-0.6389[/C][C]0.262997[/C][/ROW]
[ROW][C]19[/C][C]0.048508[/C][C]0.3326[/C][C]0.370474[/C][/ROW]
[ROW][C]20[/C][C]-0.227225[/C][C]-1.5578[/C][C]0.062997[/C][/ROW]
[ROW][C]21[/C][C]0.074261[/C][C]0.5091[/C][C]0.306529[/C][/ROW]
[ROW][C]22[/C][C]-0.120736[/C][C]-0.8277[/C][C]0.206005[/C][/ROW]
[ROW][C]23[/C][C]-0.087336[/C][C]-0.5987[/C][C]0.276108[/C][/ROW]
[ROW][C]24[/C][C]0.020024[/C][C]0.1373[/C][C]0.4457[/C][/ROW]
[ROW][C]25[/C][C]0.082674[/C][C]0.5668[/C][C]0.286779[/C][/ROW]
[ROW][C]26[/C][C]0.020991[/C][C]0.1439[/C][C]0.443095[/C][/ROW]
[ROW][C]27[/C][C]-0.073099[/C][C]-0.5011[/C][C]0.309305[/C][/ROW]
[ROW][C]28[/C][C]-0.070276[/C][C]-0.4818[/C][C]0.316096[/C][/ROW]
[ROW][C]29[/C][C]0.009366[/C][C]0.0642[/C][C]0.474538[/C][/ROW]
[ROW][C]30[/C][C]-0.077442[/C][C]-0.5309[/C][C]0.298989[/C][/ROW]
[ROW][C]31[/C][C]-0.075921[/C][C]-0.5205[/C][C]0.302585[/C][/ROW]
[ROW][C]32[/C][C]0.044988[/C][C]0.3084[/C][C]0.379563[/C][/ROW]
[ROW][C]33[/C][C]-0.023249[/C][C]-0.1594[/C][C]0.437024[/C][/ROW]
[ROW][C]34[/C][C]0.05884[/C][C]0.4034[/C][C]0.344246[/C][/ROW]
[ROW][C]35[/C][C]0.084602[/C][C]0.58[/C][C]0.282342[/C][/ROW]
[ROW][C]36[/C][C]0.076592[/C][C]0.5251[/C][C]0.300995[/C][/ROW]
[/TABLE]
Source: https://freestatistics.org/blog/index.php?pk=31690&T=2

Globally Unique Identifier (entire table): ba.freestatistics.org/blog/index.php?pk=31690&T=2

As an alternative you can also use a QR Code:  

The GUIDs for individual cells are displayed in the table below:

Partial Autocorrelation Function
Time lag kPACF(k)T-STATP-value
1-0.753732-5.16732e-06
2-0.560484-3.84250.000182
3-0.159782-1.09540.13946
4-0.116917-0.80150.213425
5-0.116523-0.79880.2142
60.1058780.72590.235762
70.0226440.15520.438648
8-0.272289-1.86670.034093
9-0.115621-0.79270.21598
10-0.082931-0.56850.286184
11-0.019717-0.13520.446525
12-0.138016-0.94620.174446
13-0.106841-0.73250.23376
14-0.071695-0.49150.312674
15-0.087446-0.59950.27586
16-0.08239-0.56480.287435
17-0.230039-1.57710.060744
18-0.093192-0.63890.262997
190.0485080.33260.370474
20-0.227225-1.55780.062997
210.0742610.50910.306529
22-0.120736-0.82770.206005
23-0.087336-0.59870.276108
240.0200240.13730.4457
250.0826740.56680.286779
260.0209910.14390.443095
27-0.073099-0.50110.309305
28-0.070276-0.48180.316096
290.0093660.06420.474538
30-0.077442-0.53090.298989
31-0.075921-0.52050.302585
320.0449880.30840.379563
33-0.023249-0.15940.437024
340.058840.40340.344246
350.0846020.580.282342
360.0765920.52510.300995


Parameters (Session):
par1 = 36 ; par2 = 1 ; par3 = 1 ; par4 = 1 ; par5 = 12 ;
Parameters (R input):
par1 = 36 ; par2 = 1 ; par3 = 1 ; par4 = 1 ; par5 = 12 ;
R code (references can be found in the software module):
if (par1 == 'Default') {
par1 = 10*log10(length(x))
} else {
par1 <- as.numeric(par1)
}
par2 <- as.numeric(par2)
par3 <- as.numeric(par3)
par4 <- as.numeric(par4)
par5 <- as.numeric(par5)
if (par2 == 0) {
x <- log(x)
} else {
x <- (x ^ par2 - 1) / par2
}
if (par3 > 0) x <- diff(x,lag=1,difference=par3)
if (par4 > 0) x <- diff(x,lag=par5,difference=par4)
bitmap(file='pic1.png')
racf <- acf(x,par1,main='Autocorrelation',xlab='lags',ylab='ACF')
dev.off()
bitmap(file='pic2.png')
rpacf <- pacf(x,par1,main='Partial Autocorrelation',xlab='lags',ylab='PACF')
dev.off()
(myacf <- c(racf$acf))
(mypacf <- c(rpacf$acf))
lengthx <- length(x)
sqrtn <- sqrt(lengthx)
load(file='createtable')
a<-table.start()
a<-table.row.start(a)
a<-table.element(a,'Autocorrelation Function',4,TRUE)
a<-table.row.end(a)
a<-table.row.start(a)
a<-table.element(a,'Time lag k',header=TRUE)
a<-table.element(a,hyperlink('basics.htm','ACF(k)','click here for more information about the Autocorrelation Function'),header=TRUE)
a<-table.element(a,'T-STAT',header=TRUE)
a<-table.element(a,'P-value',header=TRUE)
a<-table.row.end(a)
for (i in 2:(par1+1)) {
a<-table.row.start(a)
a<-table.element(a,i-1,header=TRUE)
a<-table.element(a,round(myacf[i],6))
mytstat <- myacf[i]*sqrtn
a<-table.element(a,round(mytstat,4))
a<-table.element(a,round(1-pt(abs(mytstat),lengthx),6))
a<-table.row.end(a)
}
a<-table.end(a)
table.save(a,file='mytable.tab')
a<-table.start()
a<-table.row.start(a)
a<-table.element(a,'Partial Autocorrelation Function',4,TRUE)
a<-table.row.end(a)
a<-table.row.start(a)
a<-table.element(a,'Time lag k',header=TRUE)
a<-table.element(a,hyperlink('basics.htm','PACF(k)','click here for more information about the Partial Autocorrelation Function'),header=TRUE)
a<-table.element(a,'T-STAT',header=TRUE)
a<-table.element(a,'P-value',header=TRUE)
a<-table.row.end(a)
for (i in 1:par1) {
a<-table.row.start(a)
a<-table.element(a,i,header=TRUE)
a<-table.element(a,round(mypacf[i],6))
mytstat <- mypacf[i]*sqrtn
a<-table.element(a,round(mytstat,4))
a<-table.element(a,round(1-pt(abs(mytstat),lengthx),6))
a<-table.row.end(a)
}
a<-table.end(a)
table.save(a,file='mytable1.tab')