Free Statistics

of Irreproducible Research!

Author's title

Author*The author of this computation has been verified*
R Software Modulerwasp_autocorrelation.wasp
Title produced by software(Partial) Autocorrelation Function
Date of computationTue, 09 Dec 2008 11:21:55 -0700
Cite this page as followsStatistical Computations at FreeStatistics.org, Office for Research Development and Education, URL https://freestatistics.org/blog/index.php?v=date/2008/Dec/09/t12288479061jd7q6leqjj59ws.htm/, Retrieved Sun, 19 May 2024 12:35:45 +0000
Statistical Computations at FreeStatistics.org, Office for Research Development and Education, URL https://freestatistics.org/blog/index.php?pk=31680, Retrieved Sun, 19 May 2024 12:35:45 +0000
QR Codes:

Original text written by user:
IsPrivate?No (this computation is public)
User-defined keywordsjenske_cole@hotmail.com
Estimated Impact189
Family? (F = Feedback message, R = changed R code, M = changed R Module, P = changed Parameters, D = changed Data)
-     [Univariate Data Series] [data set] [2008-12-01 19:54:57] [b98453cac15ba1066b407e146608df68]
- RMPD    [(Partial) Autocorrelation Function] [eigen tijdreeks p...] [2008-12-09 18:21:55] [120dfa2440e51a0cfc0f5296bc5d7460] [Current]
Feedback Forum

Post a new message
Dataseries X:
98.6
98
106.8
96.6
100.1
107.7
91.5
97.8
107.4
117.5
105.6
97.4
99.5
98
104.3
100.6
101.1
103.9
96.9
95.5
108.4
117
103.8
100.8
110.6
104
112.6
107.3
98.9
109.8
104.9
102.2
123.9
124.9
112.7
121.9
100.6
104.3
120.4
107.5
102.9
125.6
107.5
108.8
128.4
121.1
119.5
128.7
108.7
105.5
119.8
111.3
110.6
120.1
97.5
107.7
127.3
117.2
119.8
116.2
111
112.4
130.6
109.1
118.8
123.9
101.6
112.8
128
129.6
125.8
119.5


Summary of computational transaction
Raw Inputview raw input (R code)
Raw Outputview raw output of R engine
Computing time2 seconds
R Server'Sir Ronald Aylmer Fisher' @ 193.190.124.24

\begin{tabular}{lllllllll}
\hline
Summary of computational transaction \tabularnewline
Raw Input & view raw input (R code)  \tabularnewline
Raw Output & view raw output of R engine  \tabularnewline
Computing time & 2 seconds \tabularnewline
R Server & 'Sir Ronald Aylmer Fisher' @ 193.190.124.24 \tabularnewline
\hline
\end{tabular}
%Source: https://freestatistics.org/blog/index.php?pk=31680&T=0

[TABLE]
[ROW][C]Summary of computational transaction[/C][/ROW]
[ROW][C]Raw Input[/C][C]view raw input (R code) [/C][/ROW]
[ROW][C]Raw Output[/C][C]view raw output of R engine [/C][/ROW]
[ROW][C]Computing time[/C][C]2 seconds[/C][/ROW]
[ROW][C]R Server[/C][C]'Sir Ronald Aylmer Fisher' @ 193.190.124.24[/C][/ROW]
[/TABLE]
Source: https://freestatistics.org/blog/index.php?pk=31680&T=0

Globally Unique Identifier (entire table): ba.freestatistics.org/blog/index.php?pk=31680&T=0

As an alternative you can also use a QR Code:  

The GUIDs for individual cells are displayed in the table below:

Summary of computational transaction
Raw Inputview raw input (R code)
Raw Outputview raw output of R engine
Computing time2 seconds
R Server'Sir Ronald Aylmer Fisher' @ 193.190.124.24


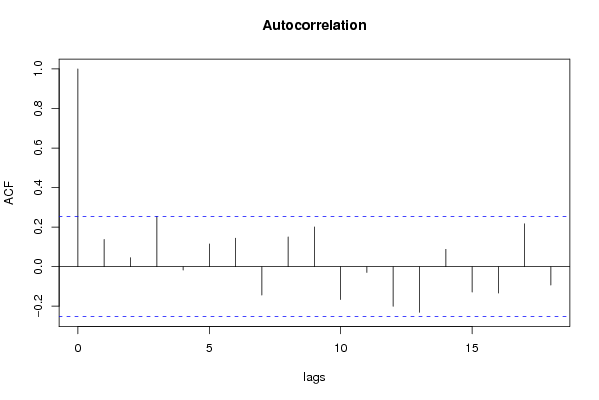
Autocorrelation Function
Time lag kACF(k)T-STATP-value
10.137611.06590.145365
20.0451840.350.363786
30.2545211.97150.026641
4-0.01693-0.13110.448052
50.1141610.88430.190037
60.1433621.11050.135612
7-0.143919-1.11480.134692
80.1501771.16330.124664
90.201111.55780.062271
10-0.166487-1.28960.101069
11-0.029221-0.22630.410852
12-0.200332-1.55180.062988
13-0.231195-1.79080.039183
140.0875160.67790.250222
15-0.128368-0.99430.162028
16-0.133917-1.03730.151876
170.2165211.67720.049356
18-0.09325-0.72230.236455

\begin{tabular}{lllllllll}
\hline
Autocorrelation Function \tabularnewline
Time lag k & ACF(k) & T-STAT & P-value \tabularnewline
1 & 0.13761 & 1.0659 & 0.145365 \tabularnewline
2 & 0.045184 & 0.35 & 0.363786 \tabularnewline
3 & 0.254521 & 1.9715 & 0.026641 \tabularnewline
4 & -0.01693 & -0.1311 & 0.448052 \tabularnewline
5 & 0.114161 & 0.8843 & 0.190037 \tabularnewline
6 & 0.143362 & 1.1105 & 0.135612 \tabularnewline
7 & -0.143919 & -1.1148 & 0.134692 \tabularnewline
8 & 0.150177 & 1.1633 & 0.124664 \tabularnewline
9 & 0.20111 & 1.5578 & 0.062271 \tabularnewline
10 & -0.166487 & -1.2896 & 0.101069 \tabularnewline
11 & -0.029221 & -0.2263 & 0.410852 \tabularnewline
12 & -0.200332 & -1.5518 & 0.062988 \tabularnewline
13 & -0.231195 & -1.7908 & 0.039183 \tabularnewline
14 & 0.087516 & 0.6779 & 0.250222 \tabularnewline
15 & -0.128368 & -0.9943 & 0.162028 \tabularnewline
16 & -0.133917 & -1.0373 & 0.151876 \tabularnewline
17 & 0.216521 & 1.6772 & 0.049356 \tabularnewline
18 & -0.09325 & -0.7223 & 0.236455 \tabularnewline
\hline
\end{tabular}
%Source: https://freestatistics.org/blog/index.php?pk=31680&T=1

[TABLE]
[ROW][C]Autocorrelation Function[/C][/ROW]
[ROW][C]Time lag k[/C][C]ACF(k)[/C][C]T-STAT[/C][C]P-value[/C][/ROW]
[ROW][C]1[/C][C]0.13761[/C][C]1.0659[/C][C]0.145365[/C][/ROW]
[ROW][C]2[/C][C]0.045184[/C][C]0.35[/C][C]0.363786[/C][/ROW]
[ROW][C]3[/C][C]0.254521[/C][C]1.9715[/C][C]0.026641[/C][/ROW]
[ROW][C]4[/C][C]-0.01693[/C][C]-0.1311[/C][C]0.448052[/C][/ROW]
[ROW][C]5[/C][C]0.114161[/C][C]0.8843[/C][C]0.190037[/C][/ROW]
[ROW][C]6[/C][C]0.143362[/C][C]1.1105[/C][C]0.135612[/C][/ROW]
[ROW][C]7[/C][C]-0.143919[/C][C]-1.1148[/C][C]0.134692[/C][/ROW]
[ROW][C]8[/C][C]0.150177[/C][C]1.1633[/C][C]0.124664[/C][/ROW]
[ROW][C]9[/C][C]0.20111[/C][C]1.5578[/C][C]0.062271[/C][/ROW]
[ROW][C]10[/C][C]-0.166487[/C][C]-1.2896[/C][C]0.101069[/C][/ROW]
[ROW][C]11[/C][C]-0.029221[/C][C]-0.2263[/C][C]0.410852[/C][/ROW]
[ROW][C]12[/C][C]-0.200332[/C][C]-1.5518[/C][C]0.062988[/C][/ROW]
[ROW][C]13[/C][C]-0.231195[/C][C]-1.7908[/C][C]0.039183[/C][/ROW]
[ROW][C]14[/C][C]0.087516[/C][C]0.6779[/C][C]0.250222[/C][/ROW]
[ROW][C]15[/C][C]-0.128368[/C][C]-0.9943[/C][C]0.162028[/C][/ROW]
[ROW][C]16[/C][C]-0.133917[/C][C]-1.0373[/C][C]0.151876[/C][/ROW]
[ROW][C]17[/C][C]0.216521[/C][C]1.6772[/C][C]0.049356[/C][/ROW]
[ROW][C]18[/C][C]-0.09325[/C][C]-0.7223[/C][C]0.236455[/C][/ROW]
[/TABLE]
Source: https://freestatistics.org/blog/index.php?pk=31680&T=1

Globally Unique Identifier (entire table): ba.freestatistics.org/blog/index.php?pk=31680&T=1

As an alternative you can also use a QR Code:  

The GUIDs for individual cells are displayed in the table below:

Autocorrelation Function
Time lag kACF(k)T-STATP-value
10.137611.06590.145365
20.0451840.350.363786
30.2545211.97150.026641
4-0.01693-0.13110.448052
50.1141610.88430.190037
60.1433621.11050.135612
7-0.143919-1.11480.134692
80.1501771.16330.124664
90.201111.55780.062271
10-0.166487-1.28960.101069
11-0.029221-0.22630.410852
12-0.200332-1.55180.062988
13-0.231195-1.79080.039183
140.0875160.67790.250222
15-0.128368-0.99430.162028
16-0.133917-1.03730.151876
170.2165211.67720.049356
18-0.09325-0.72230.236455


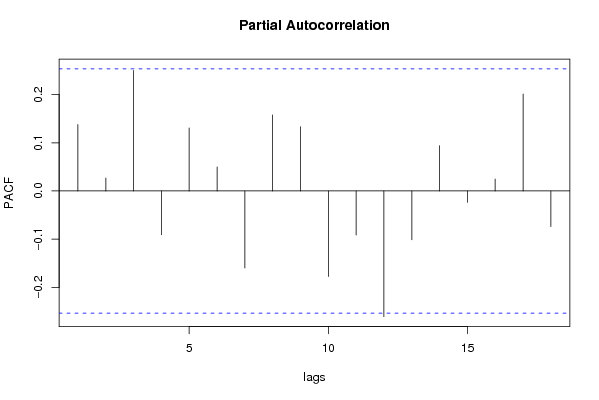
Partial Autocorrelation Function
Time lag kPACF(k)T-STATP-value
10.137611.06590.145365
20.0267540.20720.418265
30.2496911.93410.028911
4-0.0907-0.70260.242524
50.1307831.0130.157554
60.0496040.38420.351084
7-0.159612-1.23630.110574
80.15751.220.113622
90.1332991.03250.152985
10-0.177289-1.37330.087389
11-0.091276-0.7070.241146
12-0.260562-2.01830.024018
13-0.101089-0.7830.218343
140.0939890.7280.234713
15-0.023389-0.18120.428421
160.0246640.1910.424567
170.2009521.55660.062417
18-0.073652-0.57050.285232

\begin{tabular}{lllllllll}
\hline
Partial Autocorrelation Function \tabularnewline
Time lag k & PACF(k) & T-STAT & P-value \tabularnewline
1 & 0.13761 & 1.0659 & 0.145365 \tabularnewline
2 & 0.026754 & 0.2072 & 0.418265 \tabularnewline
3 & 0.249691 & 1.9341 & 0.028911 \tabularnewline
4 & -0.0907 & -0.7026 & 0.242524 \tabularnewline
5 & 0.130783 & 1.013 & 0.157554 \tabularnewline
6 & 0.049604 & 0.3842 & 0.351084 \tabularnewline
7 & -0.159612 & -1.2363 & 0.110574 \tabularnewline
8 & 0.1575 & 1.22 & 0.113622 \tabularnewline
9 & 0.133299 & 1.0325 & 0.152985 \tabularnewline
10 & -0.177289 & -1.3733 & 0.087389 \tabularnewline
11 & -0.091276 & -0.707 & 0.241146 \tabularnewline
12 & -0.260562 & -2.0183 & 0.024018 \tabularnewline
13 & -0.101089 & -0.783 & 0.218343 \tabularnewline
14 & 0.093989 & 0.728 & 0.234713 \tabularnewline
15 & -0.023389 & -0.1812 & 0.428421 \tabularnewline
16 & 0.024664 & 0.191 & 0.424567 \tabularnewline
17 & 0.200952 & 1.5566 & 0.062417 \tabularnewline
18 & -0.073652 & -0.5705 & 0.285232 \tabularnewline
\hline
\end{tabular}
%Source: https://freestatistics.org/blog/index.php?pk=31680&T=2

[TABLE]
[ROW][C]Partial Autocorrelation Function[/C][/ROW]
[ROW][C]Time lag k[/C][C]PACF(k)[/C][C]T-STAT[/C][C]P-value[/C][/ROW]
[ROW][C]1[/C][C]0.13761[/C][C]1.0659[/C][C]0.145365[/C][/ROW]
[ROW][C]2[/C][C]0.026754[/C][C]0.2072[/C][C]0.418265[/C][/ROW]
[ROW][C]3[/C][C]0.249691[/C][C]1.9341[/C][C]0.028911[/C][/ROW]
[ROW][C]4[/C][C]-0.0907[/C][C]-0.7026[/C][C]0.242524[/C][/ROW]
[ROW][C]5[/C][C]0.130783[/C][C]1.013[/C][C]0.157554[/C][/ROW]
[ROW][C]6[/C][C]0.049604[/C][C]0.3842[/C][C]0.351084[/C][/ROW]
[ROW][C]7[/C][C]-0.159612[/C][C]-1.2363[/C][C]0.110574[/C][/ROW]
[ROW][C]8[/C][C]0.1575[/C][C]1.22[/C][C]0.113622[/C][/ROW]
[ROW][C]9[/C][C]0.133299[/C][C]1.0325[/C][C]0.152985[/C][/ROW]
[ROW][C]10[/C][C]-0.177289[/C][C]-1.3733[/C][C]0.087389[/C][/ROW]
[ROW][C]11[/C][C]-0.091276[/C][C]-0.707[/C][C]0.241146[/C][/ROW]
[ROW][C]12[/C][C]-0.260562[/C][C]-2.0183[/C][C]0.024018[/C][/ROW]
[ROW][C]13[/C][C]-0.101089[/C][C]-0.783[/C][C]0.218343[/C][/ROW]
[ROW][C]14[/C][C]0.093989[/C][C]0.728[/C][C]0.234713[/C][/ROW]
[ROW][C]15[/C][C]-0.023389[/C][C]-0.1812[/C][C]0.428421[/C][/ROW]
[ROW][C]16[/C][C]0.024664[/C][C]0.191[/C][C]0.424567[/C][/ROW]
[ROW][C]17[/C][C]0.200952[/C][C]1.5566[/C][C]0.062417[/C][/ROW]
[ROW][C]18[/C][C]-0.073652[/C][C]-0.5705[/C][C]0.285232[/C][/ROW]
[/TABLE]
Source: https://freestatistics.org/blog/index.php?pk=31680&T=2

Globally Unique Identifier (entire table): ba.freestatistics.org/blog/index.php?pk=31680&T=2

As an alternative you can also use a QR Code:  

The GUIDs for individual cells are displayed in the table below:

Partial Autocorrelation Function
Time lag kPACF(k)T-STATP-value
10.137611.06590.145365
20.0267540.20720.418265
30.2496911.93410.028911
4-0.0907-0.70260.242524
50.1307831.0130.157554
60.0496040.38420.351084
7-0.159612-1.23630.110574
80.15751.220.113622
90.1332991.03250.152985
10-0.177289-1.37330.087389
11-0.091276-0.7070.241146
12-0.260562-2.01830.024018
13-0.101089-0.7830.218343
140.0939890.7280.234713
15-0.023389-0.18120.428421
160.0246640.1910.424567
170.2009521.55660.062417
18-0.073652-0.57050.285232


Parameters (Session):
par1 = Default ; par2 = -1.9 ; par3 = 0 ; par4 = 1 ; par5 = 12 ;
Parameters (R input):
par1 = Default ; par2 = -1.9 ; par3 = 0 ; par4 = 1 ; par5 = 12 ;
R code (references can be found in the software module):
if (par1 == 'Default') {
par1 = 10*log10(length(x))
} else {
par1 <- as.numeric(par1)
}
par2 <- as.numeric(par2)
par3 <- as.numeric(par3)
par4 <- as.numeric(par4)
par5 <- as.numeric(par5)
if (par2 == 0) {
x <- log(x)
} else {
x <- (x ^ par2 - 1) / par2
}
if (par3 > 0) x <- diff(x,lag=1,difference=par3)
if (par4 > 0) x <- diff(x,lag=par5,difference=par4)
bitmap(file='pic1.png')
racf <- acf(x,par1,main='Autocorrelation',xlab='lags',ylab='ACF')
dev.off()
bitmap(file='pic2.png')
rpacf <- pacf(x,par1,main='Partial Autocorrelation',xlab='lags',ylab='PACF')
dev.off()
(myacf <- c(racf$acf))
(mypacf <- c(rpacf$acf))
lengthx <- length(x)
sqrtn <- sqrt(lengthx)
load(file='createtable')
a<-table.start()
a<-table.row.start(a)
a<-table.element(a,'Autocorrelation Function',4,TRUE)
a<-table.row.end(a)
a<-table.row.start(a)
a<-table.element(a,'Time lag k',header=TRUE)
a<-table.element(a,hyperlink('basics.htm','ACF(k)','click here for more information about the Autocorrelation Function'),header=TRUE)
a<-table.element(a,'T-STAT',header=TRUE)
a<-table.element(a,'P-value',header=TRUE)
a<-table.row.end(a)
for (i in 2:(par1+1)) {
a<-table.row.start(a)
a<-table.element(a,i-1,header=TRUE)
a<-table.element(a,round(myacf[i],6))
mytstat <- myacf[i]*sqrtn
a<-table.element(a,round(mytstat,4))
a<-table.element(a,round(1-pt(abs(mytstat),lengthx),6))
a<-table.row.end(a)
}
a<-table.end(a)
table.save(a,file='mytable.tab')
a<-table.start()
a<-table.row.start(a)
a<-table.element(a,'Partial Autocorrelation Function',4,TRUE)
a<-table.row.end(a)
a<-table.row.start(a)
a<-table.element(a,'Time lag k',header=TRUE)
a<-table.element(a,hyperlink('basics.htm','PACF(k)','click here for more information about the Partial Autocorrelation Function'),header=TRUE)
a<-table.element(a,'T-STAT',header=TRUE)
a<-table.element(a,'P-value',header=TRUE)
a<-table.row.end(a)
for (i in 1:par1) {
a<-table.row.start(a)
a<-table.element(a,i,header=TRUE)
a<-table.element(a,round(mypacf[i],6))
mytstat <- mypacf[i]*sqrtn
a<-table.element(a,round(mytstat,4))
a<-table.element(a,round(1-pt(abs(mytstat),lengthx),6))
a<-table.row.end(a)
}
a<-table.end(a)
table.save(a,file='mytable1.tab')