Free Statistics

of Irreproducible Research!

Author's title

Author*The author of this computation has been verified*
R Software Modulerwasp_autocorrelation.wasp
Title produced by software(Partial) Autocorrelation Function
Date of computationTue, 09 Dec 2008 11:16:21 -0700
Cite this page as followsStatistical Computations at FreeStatistics.org, Office for Research Development and Education, URL https://freestatistics.org/blog/index.php?v=date/2008/Dec/09/t1228847590dm5qiep6wf303js.htm/, Retrieved Sun, 19 May 2024 09:23:08 +0000
Statistical Computations at FreeStatistics.org, Office for Research Development and Education, URL https://freestatistics.org/blog/index.php?pk=31673, Retrieved Sun, 19 May 2024 09:23:08 +0000
QR Codes:

Original text written by user:
IsPrivate?No (this computation is public)
User-defined keywordsjenske_cole@hotmail.com
Estimated Impact135
Family? (F = Feedback message, R = changed R code, M = changed R Module, P = changed Parameters, D = changed Data)
-     [Univariate Data Series] [data set] [2008-12-01 19:54:57] [b98453cac15ba1066b407e146608df68]
F RMPD    [(Partial) Autocorrelation Function] [eigen tijdreeks p...] [2008-12-09 18:16:21] [120dfa2440e51a0cfc0f5296bc5d7460] [Current]
Feedback Forum
2008-12-14 16:40:10 [Steven Vanhooreweghe] [reply
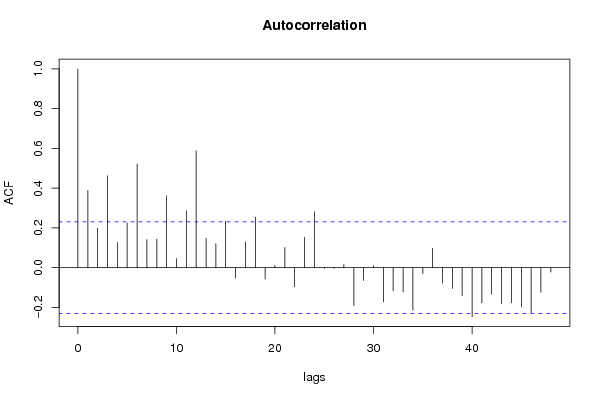
het klopt idnerdaad wat je zegt. Er is seizoenaliteit aanwezig en daarom is het nodig om seizoenaal te differentieren (D=1). Het komt ook overeen met de VRM

Post a new message
Dataseries X:
98.6
98
106.8
96.6
100.1
107.7
91.5
97.8
107.4
117.5
105.6
97.4
99.5
98
104.3
100.6
101.1
103.9
96.9
95.5
108.4
117
103.8
100.8
110.6
104
112.6
107.3
98.9
109.8
104.9
102.2
123.9
124.9
112.7
121.9
100.6
104.3
120.4
107.5
102.9
125.6
107.5
108.8
128.4
121.1
119.5
128.7
108.7
105.5
119.8
111.3
110.6
120.1
97.5
107.7
127.3
117.2
119.8
116.2
111
112.4
130.6
109.1
118.8
123.9
101.6
112.8
128
129.6
125.8
119.5


Summary of computational transaction
Raw Inputview raw input (R code)
Raw Outputview raw output of R engine
Computing time3 seconds
R Server'Herman Ole Andreas Wold' @ 193.190.124.10:1001

\begin{tabular}{lllllllll}
\hline
Summary of computational transaction \tabularnewline
Raw Input & view raw input (R code)  \tabularnewline
Raw Output & view raw output of R engine  \tabularnewline
Computing time & 3 seconds \tabularnewline
R Server & 'Herman Ole Andreas Wold' @ 193.190.124.10:1001 \tabularnewline
\hline
\end{tabular}
%Source: https://freestatistics.org/blog/index.php?pk=31673&T=0

[TABLE]
[ROW][C]Summary of computational transaction[/C][/ROW]
[ROW][C]Raw Input[/C][C]view raw input (R code) [/C][/ROW]
[ROW][C]Raw Output[/C][C]view raw output of R engine [/C][/ROW]
[ROW][C]Computing time[/C][C]3 seconds[/C][/ROW]
[ROW][C]R Server[/C][C]'Herman Ole Andreas Wold' @ 193.190.124.10:1001[/C][/ROW]
[/TABLE]
Source: https://freestatistics.org/blog/index.php?pk=31673&T=0

Globally Unique Identifier (entire table): ba.freestatistics.org/blog/index.php?pk=31673&T=0

As an alternative you can also use a QR Code:  

The GUIDs for individual cells are displayed in the table below:

Summary of computational transaction
Raw Inputview raw input (R code)
Raw Outputview raw output of R engine
Computing time3 seconds
R Server'Herman Ole Andreas Wold' @ 193.190.124.10:1001


Autocorrelation Function
Time lag kACF(k)T-STATP-value
10.3885153.29670.000761
20.198271.68240.048414
30.4628253.92729.7e-05
40.1270271.07790.142347
50.2253731.91240.029905
60.5223664.43241.6e-05
70.141551.20110.116826
80.1432771.21570.114026
90.3617153.06930.001512
100.0452710.38410.351005
110.2863362.42960.008805
120.5880114.98942e-06
130.1486931.26170.105564
140.1207931.0250.154405
150.2334761.98110.0257
16-0.051773-0.43930.330878
170.129891.10220.137032
180.2537112.15280.017343
19-0.057342-0.48660.314023
200.0111810.09490.462338
210.1023120.86810.194099
22-0.095845-0.81330.209373
230.1529491.29780.099246
240.2813962.38770.00979
25-0.003861-0.03280.486977
26-0.003143-0.02670.489399
270.0158280.13430.446768
28-0.190517-1.61660.05517
29-0.06384-0.54170.294849
300.0106420.09030.464151
31-0.172015-1.45960.074375
32-0.116354-0.98730.163402
33-0.122023-1.03540.151974
34-0.213525-1.81180.037092
35-0.028573-0.24250.404559
360.0984910.83570.203038
37-0.077614-0.65860.256135
38-0.104465-0.88640.189172
39-0.140167-1.18940.119103
40-0.246193-2.0890.020121
41-0.176833-1.50050.068932
42-0.132897-1.12770.131603
43-0.181822-1.54280.06363
44-0.176005-1.49350.069844
45-0.196992-1.67150.049479
46-0.226073-1.91830.02952
47-0.123368-1.04680.149344
48-0.022076-0.18730.425967

\begin{tabular}{lllllllll}
\hline
Autocorrelation Function \tabularnewline
Time lag k & ACF(k) & T-STAT & P-value \tabularnewline
1 & 0.388515 & 3.2967 & 0.000761 \tabularnewline
2 & 0.19827 & 1.6824 & 0.048414 \tabularnewline
3 & 0.462825 & 3.9272 & 9.7e-05 \tabularnewline
4 & 0.127027 & 1.0779 & 0.142347 \tabularnewline
5 & 0.225373 & 1.9124 & 0.029905 \tabularnewline
6 & 0.522366 & 4.4324 & 1.6e-05 \tabularnewline
7 & 0.14155 & 1.2011 & 0.116826 \tabularnewline
8 & 0.143277 & 1.2157 & 0.114026 \tabularnewline
9 & 0.361715 & 3.0693 & 0.001512 \tabularnewline
10 & 0.045271 & 0.3841 & 0.351005 \tabularnewline
11 & 0.286336 & 2.4296 & 0.008805 \tabularnewline
12 & 0.588011 & 4.9894 & 2e-06 \tabularnewline
13 & 0.148693 & 1.2617 & 0.105564 \tabularnewline
14 & 0.120793 & 1.025 & 0.154405 \tabularnewline
15 & 0.233476 & 1.9811 & 0.0257 \tabularnewline
16 & -0.051773 & -0.4393 & 0.330878 \tabularnewline
17 & 0.12989 & 1.1022 & 0.137032 \tabularnewline
18 & 0.253711 & 2.1528 & 0.017343 \tabularnewline
19 & -0.057342 & -0.4866 & 0.314023 \tabularnewline
20 & 0.011181 & 0.0949 & 0.462338 \tabularnewline
21 & 0.102312 & 0.8681 & 0.194099 \tabularnewline
22 & -0.095845 & -0.8133 & 0.209373 \tabularnewline
23 & 0.152949 & 1.2978 & 0.099246 \tabularnewline
24 & 0.281396 & 2.3877 & 0.00979 \tabularnewline
25 & -0.003861 & -0.0328 & 0.486977 \tabularnewline
26 & -0.003143 & -0.0267 & 0.489399 \tabularnewline
27 & 0.015828 & 0.1343 & 0.446768 \tabularnewline
28 & -0.190517 & -1.6166 & 0.05517 \tabularnewline
29 & -0.06384 & -0.5417 & 0.294849 \tabularnewline
30 & 0.010642 & 0.0903 & 0.464151 \tabularnewline
31 & -0.172015 & -1.4596 & 0.074375 \tabularnewline
32 & -0.116354 & -0.9873 & 0.163402 \tabularnewline
33 & -0.122023 & -1.0354 & 0.151974 \tabularnewline
34 & -0.213525 & -1.8118 & 0.037092 \tabularnewline
35 & -0.028573 & -0.2425 & 0.404559 \tabularnewline
36 & 0.098491 & 0.8357 & 0.203038 \tabularnewline
37 & -0.077614 & -0.6586 & 0.256135 \tabularnewline
38 & -0.104465 & -0.8864 & 0.189172 \tabularnewline
39 & -0.140167 & -1.1894 & 0.119103 \tabularnewline
40 & -0.246193 & -2.089 & 0.020121 \tabularnewline
41 & -0.176833 & -1.5005 & 0.068932 \tabularnewline
42 & -0.132897 & -1.1277 & 0.131603 \tabularnewline
43 & -0.181822 & -1.5428 & 0.06363 \tabularnewline
44 & -0.176005 & -1.4935 & 0.069844 \tabularnewline
45 & -0.196992 & -1.6715 & 0.049479 \tabularnewline
46 & -0.226073 & -1.9183 & 0.02952 \tabularnewline
47 & -0.123368 & -1.0468 & 0.149344 \tabularnewline
48 & -0.022076 & -0.1873 & 0.425967 \tabularnewline
\hline
\end{tabular}
%Source: https://freestatistics.org/blog/index.php?pk=31673&T=1

[TABLE]
[ROW][C]Autocorrelation Function[/C][/ROW]
[ROW][C]Time lag k[/C][C]ACF(k)[/C][C]T-STAT[/C][C]P-value[/C][/ROW]
[ROW][C]1[/C][C]0.388515[/C][C]3.2967[/C][C]0.000761[/C][/ROW]
[ROW][C]2[/C][C]0.19827[/C][C]1.6824[/C][C]0.048414[/C][/ROW]
[ROW][C]3[/C][C]0.462825[/C][C]3.9272[/C][C]9.7e-05[/C][/ROW]
[ROW][C]4[/C][C]0.127027[/C][C]1.0779[/C][C]0.142347[/C][/ROW]
[ROW][C]5[/C][C]0.225373[/C][C]1.9124[/C][C]0.029905[/C][/ROW]
[ROW][C]6[/C][C]0.522366[/C][C]4.4324[/C][C]1.6e-05[/C][/ROW]
[ROW][C]7[/C][C]0.14155[/C][C]1.2011[/C][C]0.116826[/C][/ROW]
[ROW][C]8[/C][C]0.143277[/C][C]1.2157[/C][C]0.114026[/C][/ROW]
[ROW][C]9[/C][C]0.361715[/C][C]3.0693[/C][C]0.001512[/C][/ROW]
[ROW][C]10[/C][C]0.045271[/C][C]0.3841[/C][C]0.351005[/C][/ROW]
[ROW][C]11[/C][C]0.286336[/C][C]2.4296[/C][C]0.008805[/C][/ROW]
[ROW][C]12[/C][C]0.588011[/C][C]4.9894[/C][C]2e-06[/C][/ROW]
[ROW][C]13[/C][C]0.148693[/C][C]1.2617[/C][C]0.105564[/C][/ROW]
[ROW][C]14[/C][C]0.120793[/C][C]1.025[/C][C]0.154405[/C][/ROW]
[ROW][C]15[/C][C]0.233476[/C][C]1.9811[/C][C]0.0257[/C][/ROW]
[ROW][C]16[/C][C]-0.051773[/C][C]-0.4393[/C][C]0.330878[/C][/ROW]
[ROW][C]17[/C][C]0.12989[/C][C]1.1022[/C][C]0.137032[/C][/ROW]
[ROW][C]18[/C][C]0.253711[/C][C]2.1528[/C][C]0.017343[/C][/ROW]
[ROW][C]19[/C][C]-0.057342[/C][C]-0.4866[/C][C]0.314023[/C][/ROW]
[ROW][C]20[/C][C]0.011181[/C][C]0.0949[/C][C]0.462338[/C][/ROW]
[ROW][C]21[/C][C]0.102312[/C][C]0.8681[/C][C]0.194099[/C][/ROW]
[ROW][C]22[/C][C]-0.095845[/C][C]-0.8133[/C][C]0.209373[/C][/ROW]
[ROW][C]23[/C][C]0.152949[/C][C]1.2978[/C][C]0.099246[/C][/ROW]
[ROW][C]24[/C][C]0.281396[/C][C]2.3877[/C][C]0.00979[/C][/ROW]
[ROW][C]25[/C][C]-0.003861[/C][C]-0.0328[/C][C]0.486977[/C][/ROW]
[ROW][C]26[/C][C]-0.003143[/C][C]-0.0267[/C][C]0.489399[/C][/ROW]
[ROW][C]27[/C][C]0.015828[/C][C]0.1343[/C][C]0.446768[/C][/ROW]
[ROW][C]28[/C][C]-0.190517[/C][C]-1.6166[/C][C]0.05517[/C][/ROW]
[ROW][C]29[/C][C]-0.06384[/C][C]-0.5417[/C][C]0.294849[/C][/ROW]
[ROW][C]30[/C][C]0.010642[/C][C]0.0903[/C][C]0.464151[/C][/ROW]
[ROW][C]31[/C][C]-0.172015[/C][C]-1.4596[/C][C]0.074375[/C][/ROW]
[ROW][C]32[/C][C]-0.116354[/C][C]-0.9873[/C][C]0.163402[/C][/ROW]
[ROW][C]33[/C][C]-0.122023[/C][C]-1.0354[/C][C]0.151974[/C][/ROW]
[ROW][C]34[/C][C]-0.213525[/C][C]-1.8118[/C][C]0.037092[/C][/ROW]
[ROW][C]35[/C][C]-0.028573[/C][C]-0.2425[/C][C]0.404559[/C][/ROW]
[ROW][C]36[/C][C]0.098491[/C][C]0.8357[/C][C]0.203038[/C][/ROW]
[ROW][C]37[/C][C]-0.077614[/C][C]-0.6586[/C][C]0.256135[/C][/ROW]
[ROW][C]38[/C][C]-0.104465[/C][C]-0.8864[/C][C]0.189172[/C][/ROW]
[ROW][C]39[/C][C]-0.140167[/C][C]-1.1894[/C][C]0.119103[/C][/ROW]
[ROW][C]40[/C][C]-0.246193[/C][C]-2.089[/C][C]0.020121[/C][/ROW]
[ROW][C]41[/C][C]-0.176833[/C][C]-1.5005[/C][C]0.068932[/C][/ROW]
[ROW][C]42[/C][C]-0.132897[/C][C]-1.1277[/C][C]0.131603[/C][/ROW]
[ROW][C]43[/C][C]-0.181822[/C][C]-1.5428[/C][C]0.06363[/C][/ROW]
[ROW][C]44[/C][C]-0.176005[/C][C]-1.4935[/C][C]0.069844[/C][/ROW]
[ROW][C]45[/C][C]-0.196992[/C][C]-1.6715[/C][C]0.049479[/C][/ROW]
[ROW][C]46[/C][C]-0.226073[/C][C]-1.9183[/C][C]0.02952[/C][/ROW]
[ROW][C]47[/C][C]-0.123368[/C][C]-1.0468[/C][C]0.149344[/C][/ROW]
[ROW][C]48[/C][C]-0.022076[/C][C]-0.1873[/C][C]0.425967[/C][/ROW]
[/TABLE]
Source: https://freestatistics.org/blog/index.php?pk=31673&T=1

Globally Unique Identifier (entire table): ba.freestatistics.org/blog/index.php?pk=31673&T=1

As an alternative you can also use a QR Code:  

The GUIDs for individual cells are displayed in the table below:

Autocorrelation Function
Time lag kACF(k)T-STATP-value
10.3885153.29670.000761
20.198271.68240.048414
30.4628253.92729.7e-05
40.1270271.07790.142347
50.2253731.91240.029905
60.5223664.43241.6e-05
70.141551.20110.116826
80.1432771.21570.114026
90.3617153.06930.001512
100.0452710.38410.351005
110.2863362.42960.008805
120.5880114.98942e-06
130.1486931.26170.105564
140.1207931.0250.154405
150.2334761.98110.0257
16-0.051773-0.43930.330878
170.129891.10220.137032
180.2537112.15280.017343
19-0.057342-0.48660.314023
200.0111810.09490.462338
210.1023120.86810.194099
22-0.095845-0.81330.209373
230.1529491.29780.099246
240.2813962.38770.00979
25-0.003861-0.03280.486977
26-0.003143-0.02670.489399
270.0158280.13430.446768
28-0.190517-1.61660.05517
29-0.06384-0.54170.294849
300.0106420.09030.464151
31-0.172015-1.45960.074375
32-0.116354-0.98730.163402
33-0.122023-1.03540.151974
34-0.213525-1.81180.037092
35-0.028573-0.24250.404559
360.0984910.83570.203038
37-0.077614-0.65860.256135
38-0.104465-0.88640.189172
39-0.140167-1.18940.119103
40-0.246193-2.0890.020121
41-0.176833-1.50050.068932
42-0.132897-1.12770.131603
43-0.181822-1.54280.06363
44-0.176005-1.49350.069844
45-0.196992-1.67150.049479
46-0.226073-1.91830.02952
47-0.123368-1.04680.149344
48-0.022076-0.18730.425967


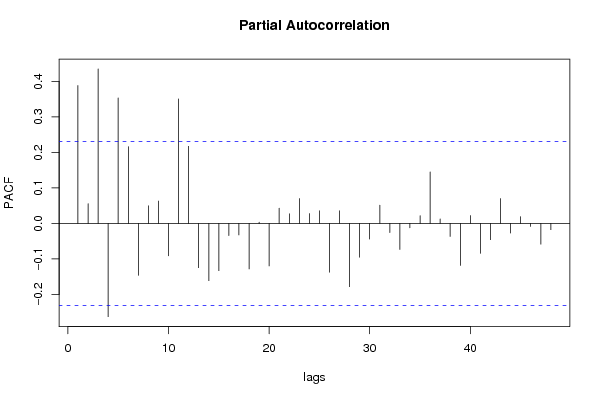
Partial Autocorrelation Function
Time lag kPACF(k)T-STATP-value
10.3885153.29670.000761
20.055740.4730.318834
30.4352843.69350.000214
4-0.262431-2.22680.014545
50.3536443.00080.001849
60.2162651.83510.035313
7-0.146054-1.23930.109628
80.0496650.42140.337352
90.063210.53640.296684
10-0.090932-0.77160.221444
110.350662.97550.00199
120.21731.84380.03466
13-0.124435-1.05590.147279
14-0.161261-1.36830.08773
15-0.132946-1.12810.131514
16-0.034076-0.28910.386652
17-0.032377-0.27470.392157
18-0.128215-1.08790.140126
190.0035610.03020.487988
20-0.119771-1.01630.156447
210.0431350.3660.357715
220.027420.23270.408339
230.0701010.59480.276913
240.0278380.23620.406968
250.0356610.30260.381537
26-0.137151-1.16380.124181
270.0355850.30190.381782
28-0.177967-1.51010.067697
29-0.095036-0.80640.211331
30-0.043923-0.37270.355233
310.0515650.43750.331513
32-0.025519-0.21650.41459
33-0.073142-0.62060.268402
34-0.012124-0.10290.459175
350.0218360.18530.426764
360.1451371.23150.111067
370.0128150.10870.456856
38-0.036477-0.30950.378911
39-0.118203-1.0030.159613
400.0223190.18940.425161
41-0.083985-0.71260.239186
42-0.045724-0.3880.349588
430.0701480.59520.276781
44-0.026834-0.22770.410265
450.0192990.16380.435192
46-0.008165-0.06930.47248
47-0.058382-0.49540.310918
48-0.017596-0.14930.440866

\begin{tabular}{lllllllll}
\hline
Partial Autocorrelation Function \tabularnewline
Time lag k & PACF(k) & T-STAT & P-value \tabularnewline
1 & 0.388515 & 3.2967 & 0.000761 \tabularnewline
2 & 0.05574 & 0.473 & 0.318834 \tabularnewline
3 & 0.435284 & 3.6935 & 0.000214 \tabularnewline
4 & -0.262431 & -2.2268 & 0.014545 \tabularnewline
5 & 0.353644 & 3.0008 & 0.001849 \tabularnewline
6 & 0.216265 & 1.8351 & 0.035313 \tabularnewline
7 & -0.146054 & -1.2393 & 0.109628 \tabularnewline
8 & 0.049665 & 0.4214 & 0.337352 \tabularnewline
9 & 0.06321 & 0.5364 & 0.296684 \tabularnewline
10 & -0.090932 & -0.7716 & 0.221444 \tabularnewline
11 & 0.35066 & 2.9755 & 0.00199 \tabularnewline
12 & 0.2173 & 1.8438 & 0.03466 \tabularnewline
13 & -0.124435 & -1.0559 & 0.147279 \tabularnewline
14 & -0.161261 & -1.3683 & 0.08773 \tabularnewline
15 & -0.132946 & -1.1281 & 0.131514 \tabularnewline
16 & -0.034076 & -0.2891 & 0.386652 \tabularnewline
17 & -0.032377 & -0.2747 & 0.392157 \tabularnewline
18 & -0.128215 & -1.0879 & 0.140126 \tabularnewline
19 & 0.003561 & 0.0302 & 0.487988 \tabularnewline
20 & -0.119771 & -1.0163 & 0.156447 \tabularnewline
21 & 0.043135 & 0.366 & 0.357715 \tabularnewline
22 & 0.02742 & 0.2327 & 0.408339 \tabularnewline
23 & 0.070101 & 0.5948 & 0.276913 \tabularnewline
24 & 0.027838 & 0.2362 & 0.406968 \tabularnewline
25 & 0.035661 & 0.3026 & 0.381537 \tabularnewline
26 & -0.137151 & -1.1638 & 0.124181 \tabularnewline
27 & 0.035585 & 0.3019 & 0.381782 \tabularnewline
28 & -0.177967 & -1.5101 & 0.067697 \tabularnewline
29 & -0.095036 & -0.8064 & 0.211331 \tabularnewline
30 & -0.043923 & -0.3727 & 0.355233 \tabularnewline
31 & 0.051565 & 0.4375 & 0.331513 \tabularnewline
32 & -0.025519 & -0.2165 & 0.41459 \tabularnewline
33 & -0.073142 & -0.6206 & 0.268402 \tabularnewline
34 & -0.012124 & -0.1029 & 0.459175 \tabularnewline
35 & 0.021836 & 0.1853 & 0.426764 \tabularnewline
36 & 0.145137 & 1.2315 & 0.111067 \tabularnewline
37 & 0.012815 & 0.1087 & 0.456856 \tabularnewline
38 & -0.036477 & -0.3095 & 0.378911 \tabularnewline
39 & -0.118203 & -1.003 & 0.159613 \tabularnewline
40 & 0.022319 & 0.1894 & 0.425161 \tabularnewline
41 & -0.083985 & -0.7126 & 0.239186 \tabularnewline
42 & -0.045724 & -0.388 & 0.349588 \tabularnewline
43 & 0.070148 & 0.5952 & 0.276781 \tabularnewline
44 & -0.026834 & -0.2277 & 0.410265 \tabularnewline
45 & 0.019299 & 0.1638 & 0.435192 \tabularnewline
46 & -0.008165 & -0.0693 & 0.47248 \tabularnewline
47 & -0.058382 & -0.4954 & 0.310918 \tabularnewline
48 & -0.017596 & -0.1493 & 0.440866 \tabularnewline
\hline
\end{tabular}
%Source: https://freestatistics.org/blog/index.php?pk=31673&T=2

[TABLE]
[ROW][C]Partial Autocorrelation Function[/C][/ROW]
[ROW][C]Time lag k[/C][C]PACF(k)[/C][C]T-STAT[/C][C]P-value[/C][/ROW]
[ROW][C]1[/C][C]0.388515[/C][C]3.2967[/C][C]0.000761[/C][/ROW]
[ROW][C]2[/C][C]0.05574[/C][C]0.473[/C][C]0.318834[/C][/ROW]
[ROW][C]3[/C][C]0.435284[/C][C]3.6935[/C][C]0.000214[/C][/ROW]
[ROW][C]4[/C][C]-0.262431[/C][C]-2.2268[/C][C]0.014545[/C][/ROW]
[ROW][C]5[/C][C]0.353644[/C][C]3.0008[/C][C]0.001849[/C][/ROW]
[ROW][C]6[/C][C]0.216265[/C][C]1.8351[/C][C]0.035313[/C][/ROW]
[ROW][C]7[/C][C]-0.146054[/C][C]-1.2393[/C][C]0.109628[/C][/ROW]
[ROW][C]8[/C][C]0.049665[/C][C]0.4214[/C][C]0.337352[/C][/ROW]
[ROW][C]9[/C][C]0.06321[/C][C]0.5364[/C][C]0.296684[/C][/ROW]
[ROW][C]10[/C][C]-0.090932[/C][C]-0.7716[/C][C]0.221444[/C][/ROW]
[ROW][C]11[/C][C]0.35066[/C][C]2.9755[/C][C]0.00199[/C][/ROW]
[ROW][C]12[/C][C]0.2173[/C][C]1.8438[/C][C]0.03466[/C][/ROW]
[ROW][C]13[/C][C]-0.124435[/C][C]-1.0559[/C][C]0.147279[/C][/ROW]
[ROW][C]14[/C][C]-0.161261[/C][C]-1.3683[/C][C]0.08773[/C][/ROW]
[ROW][C]15[/C][C]-0.132946[/C][C]-1.1281[/C][C]0.131514[/C][/ROW]
[ROW][C]16[/C][C]-0.034076[/C][C]-0.2891[/C][C]0.386652[/C][/ROW]
[ROW][C]17[/C][C]-0.032377[/C][C]-0.2747[/C][C]0.392157[/C][/ROW]
[ROW][C]18[/C][C]-0.128215[/C][C]-1.0879[/C][C]0.140126[/C][/ROW]
[ROW][C]19[/C][C]0.003561[/C][C]0.0302[/C][C]0.487988[/C][/ROW]
[ROW][C]20[/C][C]-0.119771[/C][C]-1.0163[/C][C]0.156447[/C][/ROW]
[ROW][C]21[/C][C]0.043135[/C][C]0.366[/C][C]0.357715[/C][/ROW]
[ROW][C]22[/C][C]0.02742[/C][C]0.2327[/C][C]0.408339[/C][/ROW]
[ROW][C]23[/C][C]0.070101[/C][C]0.5948[/C][C]0.276913[/C][/ROW]
[ROW][C]24[/C][C]0.027838[/C][C]0.2362[/C][C]0.406968[/C][/ROW]
[ROW][C]25[/C][C]0.035661[/C][C]0.3026[/C][C]0.381537[/C][/ROW]
[ROW][C]26[/C][C]-0.137151[/C][C]-1.1638[/C][C]0.124181[/C][/ROW]
[ROW][C]27[/C][C]0.035585[/C][C]0.3019[/C][C]0.381782[/C][/ROW]
[ROW][C]28[/C][C]-0.177967[/C][C]-1.5101[/C][C]0.067697[/C][/ROW]
[ROW][C]29[/C][C]-0.095036[/C][C]-0.8064[/C][C]0.211331[/C][/ROW]
[ROW][C]30[/C][C]-0.043923[/C][C]-0.3727[/C][C]0.355233[/C][/ROW]
[ROW][C]31[/C][C]0.051565[/C][C]0.4375[/C][C]0.331513[/C][/ROW]
[ROW][C]32[/C][C]-0.025519[/C][C]-0.2165[/C][C]0.41459[/C][/ROW]
[ROW][C]33[/C][C]-0.073142[/C][C]-0.6206[/C][C]0.268402[/C][/ROW]
[ROW][C]34[/C][C]-0.012124[/C][C]-0.1029[/C][C]0.459175[/C][/ROW]
[ROW][C]35[/C][C]0.021836[/C][C]0.1853[/C][C]0.426764[/C][/ROW]
[ROW][C]36[/C][C]0.145137[/C][C]1.2315[/C][C]0.111067[/C][/ROW]
[ROW][C]37[/C][C]0.012815[/C][C]0.1087[/C][C]0.456856[/C][/ROW]
[ROW][C]38[/C][C]-0.036477[/C][C]-0.3095[/C][C]0.378911[/C][/ROW]
[ROW][C]39[/C][C]-0.118203[/C][C]-1.003[/C][C]0.159613[/C][/ROW]
[ROW][C]40[/C][C]0.022319[/C][C]0.1894[/C][C]0.425161[/C][/ROW]
[ROW][C]41[/C][C]-0.083985[/C][C]-0.7126[/C][C]0.239186[/C][/ROW]
[ROW][C]42[/C][C]-0.045724[/C][C]-0.388[/C][C]0.349588[/C][/ROW]
[ROW][C]43[/C][C]0.070148[/C][C]0.5952[/C][C]0.276781[/C][/ROW]
[ROW][C]44[/C][C]-0.026834[/C][C]-0.2277[/C][C]0.410265[/C][/ROW]
[ROW][C]45[/C][C]0.019299[/C][C]0.1638[/C][C]0.435192[/C][/ROW]
[ROW][C]46[/C][C]-0.008165[/C][C]-0.0693[/C][C]0.47248[/C][/ROW]
[ROW][C]47[/C][C]-0.058382[/C][C]-0.4954[/C][C]0.310918[/C][/ROW]
[ROW][C]48[/C][C]-0.017596[/C][C]-0.1493[/C][C]0.440866[/C][/ROW]
[/TABLE]
Source: https://freestatistics.org/blog/index.php?pk=31673&T=2

Globally Unique Identifier (entire table): ba.freestatistics.org/blog/index.php?pk=31673&T=2

As an alternative you can also use a QR Code:  

The GUIDs for individual cells are displayed in the table below:

Partial Autocorrelation Function
Time lag kPACF(k)T-STATP-value
10.3885153.29670.000761
20.055740.4730.318834
30.4352843.69350.000214
4-0.262431-2.22680.014545
50.3536443.00080.001849
60.2162651.83510.035313
7-0.146054-1.23930.109628
80.0496650.42140.337352
90.063210.53640.296684
10-0.090932-0.77160.221444
110.350662.97550.00199
120.21731.84380.03466
13-0.124435-1.05590.147279
14-0.161261-1.36830.08773
15-0.132946-1.12810.131514
16-0.034076-0.28910.386652
17-0.032377-0.27470.392157
18-0.128215-1.08790.140126
190.0035610.03020.487988
20-0.119771-1.01630.156447
210.0431350.3660.357715
220.027420.23270.408339
230.0701010.59480.276913
240.0278380.23620.406968
250.0356610.30260.381537
26-0.137151-1.16380.124181
270.0355850.30190.381782
28-0.177967-1.51010.067697
29-0.095036-0.80640.211331
30-0.043923-0.37270.355233
310.0515650.43750.331513
32-0.025519-0.21650.41459
33-0.073142-0.62060.268402
34-0.012124-0.10290.459175
350.0218360.18530.426764
360.1451371.23150.111067
370.0128150.10870.456856
38-0.036477-0.30950.378911
39-0.118203-1.0030.159613
400.0223190.18940.425161
41-0.083985-0.71260.239186
42-0.045724-0.3880.349588
430.0701480.59520.276781
44-0.026834-0.22770.410265
450.0192990.16380.435192
46-0.008165-0.06930.47248
47-0.058382-0.49540.310918
48-0.017596-0.14930.440866


Parameters (Session):
par1 = 48 ; par2 = 1 ; par3 = 0 ; par4 = 0 ; par5 = 12 ;
Parameters (R input):
par1 = 48 ; par2 = 1 ; par3 = 0 ; par4 = 0 ; par5 = 12 ;
R code (references can be found in the software module):
if (par1 == 'Default') {
par1 = 10*log10(length(x))
} else {
par1 <- as.numeric(par1)
}
par2 <- as.numeric(par2)
par3 <- as.numeric(par3)
par4 <- as.numeric(par4)
par5 <- as.numeric(par5)
if (par2 == 0) {
x <- log(x)
} else {
x <- (x ^ par2 - 1) / par2
}
if (par3 > 0) x <- diff(x,lag=1,difference=par3)
if (par4 > 0) x <- diff(x,lag=par5,difference=par4)
bitmap(file='pic1.png')
racf <- acf(x,par1,main='Autocorrelation',xlab='lags',ylab='ACF')
dev.off()
bitmap(file='pic2.png')
rpacf <- pacf(x,par1,main='Partial Autocorrelation',xlab='lags',ylab='PACF')
dev.off()
(myacf <- c(racf$acf))
(mypacf <- c(rpacf$acf))
lengthx <- length(x)
sqrtn <- sqrt(lengthx)
load(file='createtable')
a<-table.start()
a<-table.row.start(a)
a<-table.element(a,'Autocorrelation Function',4,TRUE)
a<-table.row.end(a)
a<-table.row.start(a)
a<-table.element(a,'Time lag k',header=TRUE)
a<-table.element(a,hyperlink('basics.htm','ACF(k)','click here for more information about the Autocorrelation Function'),header=TRUE)
a<-table.element(a,'T-STAT',header=TRUE)
a<-table.element(a,'P-value',header=TRUE)
a<-table.row.end(a)
for (i in 2:(par1+1)) {
a<-table.row.start(a)
a<-table.element(a,i-1,header=TRUE)
a<-table.element(a,round(myacf[i],6))
mytstat <- myacf[i]*sqrtn
a<-table.element(a,round(mytstat,4))
a<-table.element(a,round(1-pt(abs(mytstat),lengthx),6))
a<-table.row.end(a)
}
a<-table.end(a)
table.save(a,file='mytable.tab')
a<-table.start()
a<-table.row.start(a)
a<-table.element(a,'Partial Autocorrelation Function',4,TRUE)
a<-table.row.end(a)
a<-table.row.start(a)
a<-table.element(a,'Time lag k',header=TRUE)
a<-table.element(a,hyperlink('basics.htm','PACF(k)','click here for more information about the Partial Autocorrelation Function'),header=TRUE)
a<-table.element(a,'T-STAT',header=TRUE)
a<-table.element(a,'P-value',header=TRUE)
a<-table.row.end(a)
for (i in 1:par1) {
a<-table.row.start(a)
a<-table.element(a,i,header=TRUE)
a<-table.element(a,round(mypacf[i],6))
mytstat <- mypacf[i]*sqrtn
a<-table.element(a,round(mytstat,4))
a<-table.element(a,round(1-pt(abs(mytstat),lengthx),6))
a<-table.row.end(a)
}
a<-table.end(a)
table.save(a,file='mytable1.tab')