Free Statistics

of Irreproducible Research!

Author's title

Author*Unverified author*
R Software Modulerwasp_arimabackwardselection.wasp
Title produced by softwareARIMA Backward Selection
Date of computationTue, 09 Dec 2008 11:26:36 -0700
Cite this page as followsStatistical Computations at FreeStatistics.org, Office for Research Development and Education, URL https://freestatistics.org/blog/index.php?v=date/2008/Dec/09/t1228847241vt27a2z3yfwiknz.htm/, Retrieved Sun, 19 May 2024 08:52:31 +0000
Statistical Computations at FreeStatistics.org, Office for Research Development and Education, URL https://freestatistics.org/blog/index.php?pk=31667, Retrieved Sun, 19 May 2024 08:52:31 +0000
QR Codes:

Original text written by user:
IsPrivate?No (this computation is public)
User-defined keywords
Estimated Impact256
Family? (F = Feedback message, R = changed R code, M = changed R Module, P = changed Parameters, D = changed Data)
F     [(Partial) Autocorrelation Function] [paper bel20 autoc...] [2008-12-03 13:05:59] [f58cc3b532da25682c394745f1a82535]
-   PD  [(Partial) Autocorrelation Function] [paper variance re...] [2008-12-03 14:08:24] [f58cc3b532da25682c394745f1a82535]
- RM      [Spectral Analysis] [paper spectral an...] [2008-12-03 14:40:03] [f58cc3b532da25682c394745f1a82535]
-   P       [Spectral Analysis] [] [2008-12-07 15:17:33] [74be16979710d4c4e7c6647856088456]
F RMP           [ARIMA Backward Selection] [] [2008-12-09 18:26:36] [441cddd6b019c6452f1399cb0038dc92] [Current]
-   P             [ARIMA Backward Selection] [] [2008-12-13 14:37:56] [74be16979710d4c4e7c6647856088456]
-   P             [ARIMA Backward Selection] [] [2008-12-14 15:26:26] [74be16979710d4c4e7c6647856088456]
-   P               [ARIMA Backward Selection] [] [2008-12-15 18:05:04] [74be16979710d4c4e7c6647856088456]
-   P                 [ARIMA Backward Selection] [] [2008-12-16 16:31:14] [74be16979710d4c4e7c6647856088456]
F RMP                   [ARIMA Forecasting] [] [2008-12-16 17:13:10] [74be16979710d4c4e7c6647856088456]
Feedback Forum
2008-12-13 14:42:05 [Ken Wright] [reply
correct, er is enkel een AR1 proces aanwezig volgens de computer, hier is een link waar alle waarden van de parameters op max staan, nog steeds komt er nog alleen een AR1 proces naar de voorgrond:http://www.freestatistics.org/blog/index.php?v=date/2008/Dec/13/t12291791341xhk2jnfzkjgfkc.htm

Post a new message
Dataseries X:
2659.81
2638.53
2720.25
2745.88
2735.7
2811.7
2799.43
2555.28
2304.98
2214.95
2065.81
1940.49
2042
1995.37
1946.81
1765.9
1635.25
1833.42
1910.43
1959.67
1969.6
2061.41
2093.48
2120.88
2174.56
2196.72
2350.44
2440.25
2408.64
2472.81
2407.6
2454.62
2448.05
2497.84
2645.64
2756.76
2849.27
2921.44
2981.85
3080.58
3106.22
3119.31
3061.26
3097.31
3161.69
3257.16
3277.01
3295.32
3363.99
3494.17
3667.03
3813.06
3917.96
3895.51
3801.06
3570.12
3701.61
3862.27
3970.1
4138.52
4199.75
4290.89
4443.91
4502.64
4356.98
4591.27
4696.96
4621.4
4562.84
4202.52
4296.49
4435.23
4105.18
4116.68
3844.49
3720.98
3674.4
3857.62
3801.06
3504.37
3032.6
3047.03


Summary of computational transaction
Raw Inputview raw input (R code)
Raw Outputview raw output of R engine
Computing time5 seconds
R Server'Herman Ole Andreas Wold' @ 193.190.124.10:1001

\begin{tabular}{lllllllll}
\hline
Summary of computational transaction \tabularnewline
Raw Input & view raw input (R code)  \tabularnewline
Raw Output & view raw output of R engine  \tabularnewline
Computing time & 5 seconds \tabularnewline
R Server & 'Herman Ole Andreas Wold' @ 193.190.124.10:1001 \tabularnewline
\hline
\end{tabular}
%Source: https://freestatistics.org/blog/index.php?pk=31667&T=0

[TABLE]
[ROW][C]Summary of computational transaction[/C][/ROW]
[ROW][C]Raw Input[/C][C]view raw input (R code) [/C][/ROW]
[ROW][C]Raw Output[/C][C]view raw output of R engine [/C][/ROW]
[ROW][C]Computing time[/C][C]5 seconds[/C][/ROW]
[ROW][C]R Server[/C][C]'Herman Ole Andreas Wold' @ 193.190.124.10:1001[/C][/ROW]
[/TABLE]
Source: https://freestatistics.org/blog/index.php?pk=31667&T=0

Globally Unique Identifier (entire table): ba.freestatistics.org/blog/index.php?pk=31667&T=0

As an alternative you can also use a QR Code:  

The GUIDs for individual cells are displayed in the table below:

Summary of computational transaction
Raw Inputview raw input (R code)
Raw Outputview raw output of R engine
Computing time5 seconds
R Server'Herman Ole Andreas Wold' @ 193.190.124.10:1001


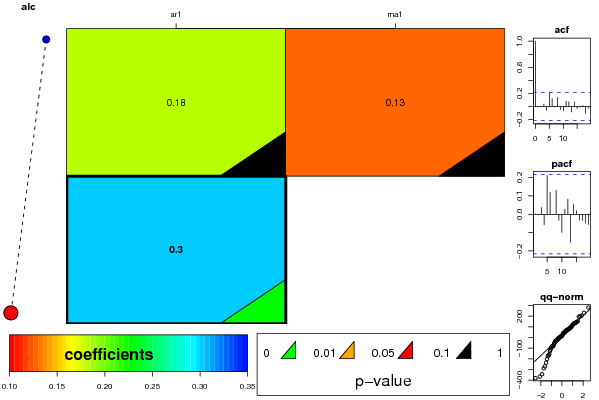
ARIMA Parameter Estimation and Backward Selection
Iterationar1ma1
Estimates ( 1 )0.18240.13
(p-val)(0.6998 )(0.7916 )
Estimates ( 2 )0.30060
(p-val)(0.0054 )(NA )
Estimates ( 3 )NANA
(p-val)(NA )(NA )

\begin{tabular}{lllllllll}
\hline
ARIMA Parameter Estimation and Backward Selection \tabularnewline
Iteration & ar1 & ma1 \tabularnewline
Estimates ( 1 ) & 0.1824 & 0.13 \tabularnewline
(p-val) & (0.6998 ) & (0.7916 ) \tabularnewline
Estimates ( 2 ) & 0.3006 & 0 \tabularnewline
(p-val) & (0.0054 ) & (NA ) \tabularnewline
Estimates ( 3 ) & NA & NA \tabularnewline
(p-val) & (NA ) & (NA ) \tabularnewline
\hline
\end{tabular}
%Source: https://freestatistics.org/blog/index.php?pk=31667&T=1

[TABLE]
[ROW][C]ARIMA Parameter Estimation and Backward Selection[/C][/ROW]
[ROW][C]Iteration[/C][C]ar1[/C][C]ma1[/C][/ROW]
[ROW][C]Estimates ( 1 )[/C][C]0.1824[/C][C]0.13[/C][/ROW]
[ROW][C](p-val)[/C][C](0.6998 )[/C][C](0.7916 )[/C][/ROW]
[ROW][C]Estimates ( 2 )[/C][C]0.3006[/C][C]0[/C][/ROW]
[ROW][C](p-val)[/C][C](0.0054 )[/C][C](NA )[/C][/ROW]
[ROW][C]Estimates ( 3 )[/C][C]NA[/C][C]NA[/C][/ROW]
[ROW][C](p-val)[/C][C](NA )[/C][C](NA )[/C][/ROW]
[/TABLE]
Source: https://freestatistics.org/blog/index.php?pk=31667&T=1

Globally Unique Identifier (entire table): ba.freestatistics.org/blog/index.php?pk=31667&T=1

As an alternative you can also use a QR Code:  

The GUIDs for individual cells are displayed in the table below:

ARIMA Parameter Estimation and Backward Selection
Iterationar1ma1
Estimates ( 1 )0.18240.13
(p-val)(0.6998 )(0.7916 )
Estimates ( 2 )0.30060
(p-val)(0.0054 )(NA )
Estimates ( 3 )NANA
(p-val)(NA )(NA )


Estimated ARIMA Residuals
Value
2.65980853580896
-20.2815369212043
88.046758838902
-0.715609698288622
-14.7628012264261
79.776317248954
-36.5058123535342
-237.165863001461
-174.92741932049
-21.6262553810379
-129.903951556145
-81.2243841466861
134.931792253052
-82.6898016858452
-29.3035835841722
-168.241535319762
-75.7746234177457
231.855722227683
10.7161218481524
33.7975517167256
-3.44672381915643
90.4464762191255
3.56278745978670
21.0861307787673
45.9401225229103
6.39476222713438
148.845921429580
42.4164270966294
-53.5085743439481
76.8927555941341
-86.912741848982
70.2150441530666
-24.2758842376425
54.1443976969872
131.677905742524
67.0382392868619
63.5229541257668
47.0350618484208
41.1291847154521
82.3623769640176
-3.0787591549456
8.81257491761062
-61.5836941569546
54.6461011311285
50.6993541288552
77.1340125431648
-7.59434618294517
15.6758915664445
63.2917796058018
109.424384167435
134.885651702575
96.9593996295575
65.6544554119614
-50.122407106734
-83.8385485343679
-202.810168212871
199.986463018606
110.673854217410
64.1325799859583
140.410895270746
12.2511491618052
78.3768401109182
126.204037017475
14.4075112233668
-158.24739109063
281.435303753527
26.361338263966
-98.2685406053724
-32.0005241842837
-345.476582545778
204.616229771577
94.9969905473545
-367.71047988513
119.514238959297
-289.824515150813
-36.1764470673984
-19.3445172526226
194.232592103960
-115.235565059079
-271.391141275415
-382.363054039120
150.203837457617

\begin{tabular}{lllllllll}
\hline
Estimated ARIMA Residuals \tabularnewline
Value \tabularnewline
2.65980853580896 \tabularnewline
-20.2815369212043 \tabularnewline
88.046758838902 \tabularnewline
-0.715609698288622 \tabularnewline
-14.7628012264261 \tabularnewline
79.776317248954 \tabularnewline
-36.5058123535342 \tabularnewline
-237.165863001461 \tabularnewline
-174.92741932049 \tabularnewline
-21.6262553810379 \tabularnewline
-129.903951556145 \tabularnewline
-81.2243841466861 \tabularnewline
134.931792253052 \tabularnewline
-82.6898016858452 \tabularnewline
-29.3035835841722 \tabularnewline
-168.241535319762 \tabularnewline
-75.7746234177457 \tabularnewline
231.855722227683 \tabularnewline
10.7161218481524 \tabularnewline
33.7975517167256 \tabularnewline
-3.44672381915643 \tabularnewline
90.4464762191255 \tabularnewline
3.56278745978670 \tabularnewline
21.0861307787673 \tabularnewline
45.9401225229103 \tabularnewline
6.39476222713438 \tabularnewline
148.845921429580 \tabularnewline
42.4164270966294 \tabularnewline
-53.5085743439481 \tabularnewline
76.8927555941341 \tabularnewline
-86.912741848982 \tabularnewline
70.2150441530666 \tabularnewline
-24.2758842376425 \tabularnewline
54.1443976969872 \tabularnewline
131.677905742524 \tabularnewline
67.0382392868619 \tabularnewline
63.5229541257668 \tabularnewline
47.0350618484208 \tabularnewline
41.1291847154521 \tabularnewline
82.3623769640176 \tabularnewline
-3.0787591549456 \tabularnewline
8.81257491761062 \tabularnewline
-61.5836941569546 \tabularnewline
54.6461011311285 \tabularnewline
50.6993541288552 \tabularnewline
77.1340125431648 \tabularnewline
-7.59434618294517 \tabularnewline
15.6758915664445 \tabularnewline
63.2917796058018 \tabularnewline
109.424384167435 \tabularnewline
134.885651702575 \tabularnewline
96.9593996295575 \tabularnewline
65.6544554119614 \tabularnewline
-50.122407106734 \tabularnewline
-83.8385485343679 \tabularnewline
-202.810168212871 \tabularnewline
199.986463018606 \tabularnewline
110.673854217410 \tabularnewline
64.1325799859583 \tabularnewline
140.410895270746 \tabularnewline
12.2511491618052 \tabularnewline
78.3768401109182 \tabularnewline
126.204037017475 \tabularnewline
14.4075112233668 \tabularnewline
-158.24739109063 \tabularnewline
281.435303753527 \tabularnewline
26.361338263966 \tabularnewline
-98.2685406053724 \tabularnewline
-32.0005241842837 \tabularnewline
-345.476582545778 \tabularnewline
204.616229771577 \tabularnewline
94.9969905473545 \tabularnewline
-367.71047988513 \tabularnewline
119.514238959297 \tabularnewline
-289.824515150813 \tabularnewline
-36.1764470673984 \tabularnewline
-19.3445172526226 \tabularnewline
194.232592103960 \tabularnewline
-115.235565059079 \tabularnewline
-271.391141275415 \tabularnewline
-382.363054039120 \tabularnewline
150.203837457617 \tabularnewline
\hline
\end{tabular}
%Source: https://freestatistics.org/blog/index.php?pk=31667&T=2

[TABLE]
[ROW][C]Estimated ARIMA Residuals[/C][/ROW]
[ROW][C]Value[/C][/ROW]
[ROW][C]2.65980853580896[/C][/ROW]
[ROW][C]-20.2815369212043[/C][/ROW]
[ROW][C]88.046758838902[/C][/ROW]
[ROW][C]-0.715609698288622[/C][/ROW]
[ROW][C]-14.7628012264261[/C][/ROW]
[ROW][C]79.776317248954[/C][/ROW]
[ROW][C]-36.5058123535342[/C][/ROW]
[ROW][C]-237.165863001461[/C][/ROW]
[ROW][C]-174.92741932049[/C][/ROW]
[ROW][C]-21.6262553810379[/C][/ROW]
[ROW][C]-129.903951556145[/C][/ROW]
[ROW][C]-81.2243841466861[/C][/ROW]
[ROW][C]134.931792253052[/C][/ROW]
[ROW][C]-82.6898016858452[/C][/ROW]
[ROW][C]-29.3035835841722[/C][/ROW]
[ROW][C]-168.241535319762[/C][/ROW]
[ROW][C]-75.7746234177457[/C][/ROW]
[ROW][C]231.855722227683[/C][/ROW]
[ROW][C]10.7161218481524[/C][/ROW]
[ROW][C]33.7975517167256[/C][/ROW]
[ROW][C]-3.44672381915643[/C][/ROW]
[ROW][C]90.4464762191255[/C][/ROW]
[ROW][C]3.56278745978670[/C][/ROW]
[ROW][C]21.0861307787673[/C][/ROW]
[ROW][C]45.9401225229103[/C][/ROW]
[ROW][C]6.39476222713438[/C][/ROW]
[ROW][C]148.845921429580[/C][/ROW]
[ROW][C]42.4164270966294[/C][/ROW]
[ROW][C]-53.5085743439481[/C][/ROW]
[ROW][C]76.8927555941341[/C][/ROW]
[ROW][C]-86.912741848982[/C][/ROW]
[ROW][C]70.2150441530666[/C][/ROW]
[ROW][C]-24.2758842376425[/C][/ROW]
[ROW][C]54.1443976969872[/C][/ROW]
[ROW][C]131.677905742524[/C][/ROW]
[ROW][C]67.0382392868619[/C][/ROW]
[ROW][C]63.5229541257668[/C][/ROW]
[ROW][C]47.0350618484208[/C][/ROW]
[ROW][C]41.1291847154521[/C][/ROW]
[ROW][C]82.3623769640176[/C][/ROW]
[ROW][C]-3.0787591549456[/C][/ROW]
[ROW][C]8.81257491761062[/C][/ROW]
[ROW][C]-61.5836941569546[/C][/ROW]
[ROW][C]54.6461011311285[/C][/ROW]
[ROW][C]50.6993541288552[/C][/ROW]
[ROW][C]77.1340125431648[/C][/ROW]
[ROW][C]-7.59434618294517[/C][/ROW]
[ROW][C]15.6758915664445[/C][/ROW]
[ROW][C]63.2917796058018[/C][/ROW]
[ROW][C]109.424384167435[/C][/ROW]
[ROW][C]134.885651702575[/C][/ROW]
[ROW][C]96.9593996295575[/C][/ROW]
[ROW][C]65.6544554119614[/C][/ROW]
[ROW][C]-50.122407106734[/C][/ROW]
[ROW][C]-83.8385485343679[/C][/ROW]
[ROW][C]-202.810168212871[/C][/ROW]
[ROW][C]199.986463018606[/C][/ROW]
[ROW][C]110.673854217410[/C][/ROW]
[ROW][C]64.1325799859583[/C][/ROW]
[ROW][C]140.410895270746[/C][/ROW]
[ROW][C]12.2511491618052[/C][/ROW]
[ROW][C]78.3768401109182[/C][/ROW]
[ROW][C]126.204037017475[/C][/ROW]
[ROW][C]14.4075112233668[/C][/ROW]
[ROW][C]-158.24739109063[/C][/ROW]
[ROW][C]281.435303753527[/C][/ROW]
[ROW][C]26.361338263966[/C][/ROW]
[ROW][C]-98.2685406053724[/C][/ROW]
[ROW][C]-32.0005241842837[/C][/ROW]
[ROW][C]-345.476582545778[/C][/ROW]
[ROW][C]204.616229771577[/C][/ROW]
[ROW][C]94.9969905473545[/C][/ROW]
[ROW][C]-367.71047988513[/C][/ROW]
[ROW][C]119.514238959297[/C][/ROW]
[ROW][C]-289.824515150813[/C][/ROW]
[ROW][C]-36.1764470673984[/C][/ROW]
[ROW][C]-19.3445172526226[/C][/ROW]
[ROW][C]194.232592103960[/C][/ROW]
[ROW][C]-115.235565059079[/C][/ROW]
[ROW][C]-271.391141275415[/C][/ROW]
[ROW][C]-382.363054039120[/C][/ROW]
[ROW][C]150.203837457617[/C][/ROW]
[/TABLE]
Source: https://freestatistics.org/blog/index.php?pk=31667&T=2

Globally Unique Identifier (entire table): ba.freestatistics.org/blog/index.php?pk=31667&T=2

As an alternative you can also use a QR Code:  

The GUIDs for individual cells are displayed in the table below:

Estimated ARIMA Residuals
Value
2.65980853580896
-20.2815369212043
88.046758838902
-0.715609698288622
-14.7628012264261
79.776317248954
-36.5058123535342
-237.165863001461
-174.92741932049
-21.6262553810379
-129.903951556145
-81.2243841466861
134.931792253052
-82.6898016858452
-29.3035835841722
-168.241535319762
-75.7746234177457
231.855722227683
10.7161218481524
33.7975517167256
-3.44672381915643
90.4464762191255
3.56278745978670
21.0861307787673
45.9401225229103
6.39476222713438
148.845921429580
42.4164270966294
-53.5085743439481
76.8927555941341
-86.912741848982
70.2150441530666
-24.2758842376425
54.1443976969872
131.677905742524
67.0382392868619
63.5229541257668
47.0350618484208
41.1291847154521
82.3623769640176
-3.0787591549456
8.81257491761062
-61.5836941569546
54.6461011311285
50.6993541288552
77.1340125431648
-7.59434618294517
15.6758915664445
63.2917796058018
109.424384167435
134.885651702575
96.9593996295575
65.6544554119614
-50.122407106734
-83.8385485343679
-202.810168212871
199.986463018606
110.673854217410
64.1325799859583
140.410895270746
12.2511491618052
78.3768401109182
126.204037017475
14.4075112233668
-158.24739109063
281.435303753527
26.361338263966
-98.2685406053724
-32.0005241842837
-345.476582545778
204.616229771577
94.9969905473545
-367.71047988513
119.514238959297
-289.824515150813
-36.1764470673984
-19.3445172526226
194.232592103960
-115.235565059079
-271.391141275415
-382.363054039120
150.203837457617


Parameters (Session):
par1 = 36 ; par2 = 1 ; par3 = 1 ; par4 = 0 ; par5 = 12 ;
Parameters (R input):
par1 = FALSE ; par2 = 1 ; par3 = 1 ; par4 = 0 ; par5 = 12 ; par6 = 1 ; par7 = 1 ; par8 = 0 ; par9 = 0 ;
R code (references can be found in the software module):
library(lattice)
if (par1 == 'TRUE') par1 <- TRUE
if (par1 == 'FALSE') par1 <- FALSE
par2 <- as.numeric(par2) #Box-Cox lambda transformation parameter
par3 <- as.numeric(par3) #degree of non-seasonal differencing
par4 <- as.numeric(par4) #degree of seasonal differencing
par5 <- as.numeric(par5) #seasonal period
par6 <- as.numeric(par6) #degree (p) of the non-seasonal AR(p) polynomial
par7 <- as.numeric(par7) #degree (q) of the non-seasonal MA(q) polynomial
par8 <- as.numeric(par8) #degree (P) of the seasonal AR(P) polynomial
par9 <- as.numeric(par9) #degree (Q) of the seasonal MA(Q) polynomial
armaGR <- function(arima.out, names, n){
try1 <- arima.out$coef
try2 <- sqrt(diag(arima.out$var.coef))
try.data.frame <- data.frame(matrix(NA,ncol=4,nrow=length(names)))
dimnames(try.data.frame) <- list(names,c('coef','std','tstat','pv'))
try.data.frame[,1] <- try1
for(i in 1:length(try2)) try.data.frame[which(rownames(try.data.frame)==names(try2)[i]),2] <- try2[i]
try.data.frame[,3] <- try.data.frame[,1] / try.data.frame[,2]
try.data.frame[,4] <- round((1-pt(abs(try.data.frame[,3]),df=n-(length(try2)+1)))*2,5)
vector <- rep(NA,length(names))
vector[is.na(try.data.frame[,4])] <- 0
maxi <- which.max(try.data.frame[,4])
continue <- max(try.data.frame[,4],na.rm=TRUE) > .05
vector[maxi] <- 0
list(summary=try.data.frame,next.vector=vector,continue=continue)
}
arimaSelect <- function(series, order=c(13,0,0), seasonal=list(order=c(2,0,0),period=12), include.mean=F){
nrc <- order[1]+order[3]+seasonal$order[1]+seasonal$order[3]
coeff <- matrix(NA, nrow=nrc*2, ncol=nrc)
pval <- matrix(NA, nrow=nrc*2, ncol=nrc)
mylist <- rep(list(NULL), nrc)
names <- NULL
if(order[1] > 0) names <- paste('ar',1:order[1],sep='')
if(order[3] > 0) names <- c( names , paste('ma',1:order[3],sep='') )
if(seasonal$order[1] > 0) names <- c(names, paste('sar',1:seasonal$order[1],sep=''))
if(seasonal$order[3] > 0) names <- c(names, paste('sma',1:seasonal$order[3],sep=''))
arima.out <- arima(series, order=order, seasonal=seasonal, include.mean=include.mean, method='ML')
mylist[[1]] <- arima.out
last.arma <- armaGR(arima.out, names, length(series))
mystop <- FALSE
i <- 1
coeff[i,] <- last.arma[[1]][,1]
pval [i,] <- last.arma[[1]][,4]
i <- 2
aic <- arima.out$aic
while(!mystop){
mylist[[i]] <- arima.out
arima.out <- arima(series, order=order, seasonal=seasonal, include.mean=include.mean, method='ML', fixed=last.arma$next.vector)
aic <- c(aic, arima.out$aic)
last.arma <- armaGR(arima.out, names, length(series))
mystop <- !last.arma$continue
coeff[i,] <- last.arma[[1]][,1]
pval [i,] <- last.arma[[1]][,4]
i <- i+1
}
list(coeff, pval, mylist, aic=aic)
}
arimaSelectplot <- function(arimaSelect.out,noms,choix){
noms <- names(arimaSelect.out[[3]][[1]]$coef)
coeff <- arimaSelect.out[[1]]
k <- min(which(is.na(coeff[,1])))-1
coeff <- coeff[1:k,]
pval <- arimaSelect.out[[2]][1:k,]
aic <- arimaSelect.out$aic[1:k]
coeff[coeff==0] <- NA
n <- ncol(coeff)
if(missing(choix)) choix <- k
layout(matrix(c(1,1,1,2,
3,3,3,2,
3,3,3,4,
5,6,7,7),nr=4),
widths=c(10,35,45,15),
heights=c(30,30,15,15))
couleurs <- rainbow(75)[1:50]#(50)
ticks <- pretty(coeff)
par(mar=c(1,1,3,1))
plot(aic,k:1-.5,type='o',pch=21,bg='blue',cex=2,axes=F,lty=2,xpd=NA)
points(aic[choix],k-choix+.5,pch=21,cex=4,bg=2,xpd=NA)
title('aic',line=2)
par(mar=c(3,0,0,0))
plot(0,axes=F,xlab='',ylab='',xlim=range(ticks),ylim=c(.1,1))
rect(xleft = min(ticks) + (0:49)/50*(max(ticks)-min(ticks)),
xright = min(ticks) + (1:50)/50*(max(ticks)-min(ticks)),
ytop = rep(1,50),
ybottom= rep(0,50),col=couleurs,border=NA)
axis(1,ticks)
rect(xleft=min(ticks),xright=max(ticks),ytop=1,ybottom=0)
text(mean(coeff,na.rm=T),.5,'coefficients',cex=2,font=2)
par(mar=c(1,1,3,1))
image(1:n,1:k,t(coeff[k:1,]),axes=F,col=couleurs,zlim=range(ticks))
for(i in 1:n) for(j in 1:k) if(!is.na(coeff[j,i])) {
if(pval[j,i]<.01) symb = 'green'
else if( (pval[j,i]<.05) & (pval[j,i]>=.01)) symb = 'orange'
else if( (pval[j,i]<.1) & (pval[j,i]>=.05)) symb = 'red'
else symb = 'black'
polygon(c(i+.5 ,i+.2 ,i+.5 ,i+.5),
c(k-j+0.5,k-j+0.5,k-j+0.8,k-j+0.5),
col=symb)
if(j==choix) {
rect(xleft=i-.5,
xright=i+.5,
ybottom=k-j+1.5,
ytop=k-j+.5,
lwd=4)
text(i,
k-j+1,
round(coeff[j,i],2),
cex=1.2,
font=2)
}
else{
rect(xleft=i-.5,xright=i+.5,ybottom=k-j+1.5,ytop=k-j+.5)
text(i,k-j+1,round(coeff[j,i],2),cex=1.2,font=1)
}
}
axis(3,1:n,noms)
par(mar=c(0.5,0,0,0.5))
plot(0,axes=F,xlab='',ylab='',type='n',xlim=c(0,8),ylim=c(-.2,.8))
cols <- c('green','orange','red','black')
niv <- c('0','0.01','0.05','0.1')
for(i in 0:3){
polygon(c(1+2*i ,1+2*i ,1+2*i-.5 ,1+2*i),
c(.4 ,.7 , .4 , .4),
col=cols[i+1])
text(2*i,0.5,niv[i+1],cex=1.5)
}
text(8,.5,1,cex=1.5)
text(4,0,'p-value',cex=2)
box()
residus <- arimaSelect.out[[3]][[choix]]$res
par(mar=c(1,2,4,1))
acf(residus,main='')
title('acf',line=.5)
par(mar=c(1,2,4,1))
pacf(residus,main='')
title('pacf',line=.5)
par(mar=c(2,2,4,1))
qqnorm(residus,main='')
title('qq-norm',line=.5)
qqline(residus)
residus
}
if (par2 == 0) x <- log(x)
if (par2 != 0) x <- x^par2
(selection <- arimaSelect(x, order=c(par6,par3,par7), seasonal=list(order=c(par8,par4,par9), period=par5)))
bitmap(file='test1.png')
resid <- arimaSelectplot(selection)
dev.off()
resid
bitmap(file='test2.png')
acf(resid,length(resid)/2, main='Residual Autocorrelation Function')
dev.off()
bitmap(file='test3.png')
pacf(resid,length(resid)/2, main='Residual Partial Autocorrelation Function')
dev.off()
bitmap(file='test4.png')
cpgram(resid, main='Residual Cumulative Periodogram')
dev.off()
bitmap(file='test5.png')
hist(resid, main='Residual Histogram', xlab='values of Residuals')
dev.off()
bitmap(file='test6.png')
densityplot(~resid,col='black',main='Residual Density Plot', xlab='values of Residuals')
dev.off()
bitmap(file='test7.png')
qqnorm(resid, main='Residual Normal Q-Q Plot')
qqline(resid)
dev.off()
ncols <- length(selection[[1]][1,])
nrows <- length(selection[[2]][,1])-1
load(file='createtable')
a<-table.start()
a<-table.row.start(a)
a<-table.element(a,'ARIMA Parameter Estimation and Backward Selection', ncols+1,TRUE)
a<-table.row.end(a)
a<-table.row.start(a)
a<-table.element(a,'Iteration', header=TRUE)
for (i in 1:ncols) {
a<-table.element(a,names(selection[[3]][[1]]$coef)[i],header=TRUE)
}
a<-table.row.end(a)
for (j in 1:nrows) {
a<-table.row.start(a)
mydum <- 'Estimates ('
mydum <- paste(mydum,j)
mydum <- paste(mydum,')')
a<-table.element(a,mydum, header=TRUE)
for (i in 1:ncols) {
a<-table.element(a,round(selection[[1]][j,i],4))
}
a<-table.row.end(a)
a<-table.row.start(a)
a<-table.element(a,'(p-val)', header=TRUE)
for (i in 1:ncols) {
mydum <- '('
mydum <- paste(mydum,round(selection[[2]][j,i],4),sep='')
mydum <- paste(mydum,')')
a<-table.element(a,mydum)
}
a<-table.row.end(a)
}
a<-table.end(a)
table.save(a,file='mytable.tab')
a<-table.start()
a<-table.row.start(a)
a<-table.element(a,'Estimated ARIMA Residuals', 1,TRUE)
a<-table.row.end(a)
a<-table.row.start(a)
a<-table.element(a,'Value', 1,TRUE)
a<-table.row.end(a)
for (i in (par4*par5+par3):length(resid)) {
a<-table.row.start(a)
a<-table.element(a,resid[i])
a<-table.row.end(a)
}
a<-table.end(a)
table.save(a,file='mytable1.tab')