Free Statistics

of Irreproducible Research!

Author's title

Author*Unverified author*
R Software Modulerwasp_autocorrelation.wasp
Title produced by software(Partial) Autocorrelation Function
Date of computationTue, 09 Dec 2008 11:11:21 -0700
Cite this page as followsStatistical Computations at FreeStatistics.org, Office for Research Development and Education, URL https://freestatistics.org/blog/index.php?v=date/2008/Dec/09/t1228846343kqxk0p21jon8gpr.htm/, Retrieved Sun, 19 May 2024 11:38:59 +0000
Statistical Computations at FreeStatistics.org, Office for Research Development and Education, URL https://freestatistics.org/blog/index.php?pk=31657, Retrieved Sun, 19 May 2024 11:38:59 +0000
QR Codes:

Original text written by user:
IsPrivate?No (this computation is public)
User-defined keywords
Estimated Impact162
Family? (F = Feedback message, R = changed R code, M = changed R Module, P = changed Parameters, D = changed Data)
-     [Univariate Data Series] [data set] [2008-12-01 19:54:57] [b98453cac15ba1066b407e146608df68]
- RMP   [(Partial) Autocorrelation Function] [Gilliam Schoorel] [2008-12-07 20:50:54] [a9b974cca921a7a5a84c6ce01f3dc8c2]
- R PD      [(Partial) Autocorrelation Function] [] [2008-12-09 18:11:21] [d41d8cd98f00b204e9800998ecf8427e] [Current]
Feedback Forum

Post a new message
Dataseries X:
106.7
110.2
125.9
100.1
106.4
114.8
81.3
87
104.2
108
105
94.5
92
95.9
108.8
103.4
102.1
110.1
83.2
82.7
106.8
113.7
102.5
96.6
92.1
95.6
102.3
98.6
98.2
104.5
84
73.8
103.9
106
97.2
102.6
89
93.8
116.7
106.8
98.5
118.7
90
91.9
113.3
113.1
104.1
108.7
96.7
101
116.9
105.8
99
129.4
83
88.9
115.9
104.2
113.4
112.2
100.8
107.3
126.6
102.9
117.9
128.8
87.5
93.8
122.7
126.2
124.6
116.7
115.2
111.1
129.9
113.3
118.5
137.9
103.6
101.7
127.4
137.5
128.3
118.2
117.1
124.2
126
132.1


Summary of computational transaction
Raw Inputview raw input (R code)
Raw Outputview raw output of R engine
Computing time3 seconds
R Server'Herman Ole Andreas Wold' @ 193.190.124.10:1001

\begin{tabular}{lllllllll}
\hline
Summary of computational transaction \tabularnewline
Raw Input & view raw input (R code)  \tabularnewline
Raw Output & view raw output of R engine  \tabularnewline
Computing time & 3 seconds \tabularnewline
R Server & 'Herman Ole Andreas Wold' @ 193.190.124.10:1001 \tabularnewline
\hline
\end{tabular}
%Source: https://freestatistics.org/blog/index.php?pk=31657&T=0

[TABLE]
[ROW][C]Summary of computational transaction[/C][/ROW]
[ROW][C]Raw Input[/C][C]view raw input (R code) [/C][/ROW]
[ROW][C]Raw Output[/C][C]view raw output of R engine [/C][/ROW]
[ROW][C]Computing time[/C][C]3 seconds[/C][/ROW]
[ROW][C]R Server[/C][C]'Herman Ole Andreas Wold' @ 193.190.124.10:1001[/C][/ROW]
[/TABLE]
Source: https://freestatistics.org/blog/index.php?pk=31657&T=0

Globally Unique Identifier (entire table): ba.freestatistics.org/blog/index.php?pk=31657&T=0

As an alternative you can also use a QR Code:  

The GUIDs for individual cells are displayed in the table below:

Summary of computational transaction
Raw Inputview raw input (R code)
Raw Outputview raw output of R engine
Computing time3 seconds
R Server'Herman Ole Andreas Wold' @ 193.190.124.10:1001


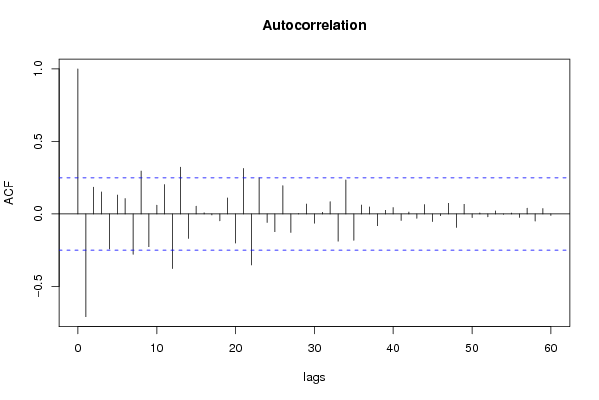
Autocorrelation Function
Time lag kACF(k)T-STATP-value
1-0.708206-5.57640
20.1843291.45140.075853
30.1517541.19490.118336
4-0.241318-1.90010.031034
50.1301321.02470.154753
60.1060640.83510.203421
7-0.278237-2.19080.016116
80.2959052.330.01154
9-0.225622-1.77650.040274
100.0605830.4770.317508
110.2024361.5940.058013
12-0.376328-2.96320.002157
130.3221312.53650.006865
14-0.168847-1.32950.094277
150.0535630.42180.33733
160.0078060.06150.475593
17-0.006858-0.0540.478554
18-0.047073-0.37070.35608
190.1105240.87030.193755
20-0.2007-1.58030.059562
210.313972.47220.008093
22-0.351283-2.7660.003734
230.2494641.96430.026992
24-0.058274-0.45890.323972
25-0.122101-0.96140.170037
260.1952371.53730.064655
27-0.127306-1.00240.160021
280.001920.01510.493992
290.0681730.53680.296666
30-0.064067-0.50450.307861
310.01160.09130.463759
320.0842640.66350.254737
33-0.187619-1.47730.072327
340.234241.84440.034951
35-0.1819-1.43230.078543
360.0614560.48390.31508
370.0482790.38020.352566
38-0.08091-0.63710.263207
390.0248750.19590.422679
400.0440450.34680.364953
41-0.044749-0.35240.362885
420.0131280.10340.459003
43-0.030049-0.23660.406871
440.0648750.51080.305645
45-0.0527-0.4150.339803
46-0.011646-0.09170.463616
470.0736530.57990.282028
48-0.093259-0.73430.232759
490.0669420.52710.300003
50-0.025071-0.19740.422078
510.0070630.05560.477913
52-0.019692-0.15510.438639
530.0204390.16090.436333
54-0.002576-0.02030.491941
550.0065710.05170.47945
56-0.024363-0.19180.424249
570.0401680.31630.376425
58-0.049231-0.38760.349803
590.037410.29460.384653
60-0.010523-0.08290.467116

\begin{tabular}{lllllllll}
\hline
Autocorrelation Function \tabularnewline
Time lag k & ACF(k) & T-STAT & P-value \tabularnewline
1 & -0.708206 & -5.5764 & 0 \tabularnewline
2 & 0.184329 & 1.4514 & 0.075853 \tabularnewline
3 & 0.151754 & 1.1949 & 0.118336 \tabularnewline
4 & -0.241318 & -1.9001 & 0.031034 \tabularnewline
5 & 0.130132 & 1.0247 & 0.154753 \tabularnewline
6 & 0.106064 & 0.8351 & 0.203421 \tabularnewline
7 & -0.278237 & -2.1908 & 0.016116 \tabularnewline
8 & 0.295905 & 2.33 & 0.01154 \tabularnewline
9 & -0.225622 & -1.7765 & 0.040274 \tabularnewline
10 & 0.060583 & 0.477 & 0.317508 \tabularnewline
11 & 0.202436 & 1.594 & 0.058013 \tabularnewline
12 & -0.376328 & -2.9632 & 0.002157 \tabularnewline
13 & 0.322131 & 2.5365 & 0.006865 \tabularnewline
14 & -0.168847 & -1.3295 & 0.094277 \tabularnewline
15 & 0.053563 & 0.4218 & 0.33733 \tabularnewline
16 & 0.007806 & 0.0615 & 0.475593 \tabularnewline
17 & -0.006858 & -0.054 & 0.478554 \tabularnewline
18 & -0.047073 & -0.3707 & 0.35608 \tabularnewline
19 & 0.110524 & 0.8703 & 0.193755 \tabularnewline
20 & -0.2007 & -1.5803 & 0.059562 \tabularnewline
21 & 0.31397 & 2.4722 & 0.008093 \tabularnewline
22 & -0.351283 & -2.766 & 0.003734 \tabularnewline
23 & 0.249464 & 1.9643 & 0.026992 \tabularnewline
24 & -0.058274 & -0.4589 & 0.323972 \tabularnewline
25 & -0.122101 & -0.9614 & 0.170037 \tabularnewline
26 & 0.195237 & 1.5373 & 0.064655 \tabularnewline
27 & -0.127306 & -1.0024 & 0.160021 \tabularnewline
28 & 0.00192 & 0.0151 & 0.493992 \tabularnewline
29 & 0.068173 & 0.5368 & 0.296666 \tabularnewline
30 & -0.064067 & -0.5045 & 0.307861 \tabularnewline
31 & 0.0116 & 0.0913 & 0.463759 \tabularnewline
32 & 0.084264 & 0.6635 & 0.254737 \tabularnewline
33 & -0.187619 & -1.4773 & 0.072327 \tabularnewline
34 & 0.23424 & 1.8444 & 0.034951 \tabularnewline
35 & -0.1819 & -1.4323 & 0.078543 \tabularnewline
36 & 0.061456 & 0.4839 & 0.31508 \tabularnewline
37 & 0.048279 & 0.3802 & 0.352566 \tabularnewline
38 & -0.08091 & -0.6371 & 0.263207 \tabularnewline
39 & 0.024875 & 0.1959 & 0.422679 \tabularnewline
40 & 0.044045 & 0.3468 & 0.364953 \tabularnewline
41 & -0.044749 & -0.3524 & 0.362885 \tabularnewline
42 & 0.013128 & 0.1034 & 0.459003 \tabularnewline
43 & -0.030049 & -0.2366 & 0.406871 \tabularnewline
44 & 0.064875 & 0.5108 & 0.305645 \tabularnewline
45 & -0.0527 & -0.415 & 0.339803 \tabularnewline
46 & -0.011646 & -0.0917 & 0.463616 \tabularnewline
47 & 0.073653 & 0.5799 & 0.282028 \tabularnewline
48 & -0.093259 & -0.7343 & 0.232759 \tabularnewline
49 & 0.066942 & 0.5271 & 0.300003 \tabularnewline
50 & -0.025071 & -0.1974 & 0.422078 \tabularnewline
51 & 0.007063 & 0.0556 & 0.477913 \tabularnewline
52 & -0.019692 & -0.1551 & 0.438639 \tabularnewline
53 & 0.020439 & 0.1609 & 0.436333 \tabularnewline
54 & -0.002576 & -0.0203 & 0.491941 \tabularnewline
55 & 0.006571 & 0.0517 & 0.47945 \tabularnewline
56 & -0.024363 & -0.1918 & 0.424249 \tabularnewline
57 & 0.040168 & 0.3163 & 0.376425 \tabularnewline
58 & -0.049231 & -0.3876 & 0.349803 \tabularnewline
59 & 0.03741 & 0.2946 & 0.384653 \tabularnewline
60 & -0.010523 & -0.0829 & 0.467116 \tabularnewline
\hline
\end{tabular}
%Source: https://freestatistics.org/blog/index.php?pk=31657&T=1

[TABLE]
[ROW][C]Autocorrelation Function[/C][/ROW]
[ROW][C]Time lag k[/C][C]ACF(k)[/C][C]T-STAT[/C][C]P-value[/C][/ROW]
[ROW][C]1[/C][C]-0.708206[/C][C]-5.5764[/C][C]0[/C][/ROW]
[ROW][C]2[/C][C]0.184329[/C][C]1.4514[/C][C]0.075853[/C][/ROW]
[ROW][C]3[/C][C]0.151754[/C][C]1.1949[/C][C]0.118336[/C][/ROW]
[ROW][C]4[/C][C]-0.241318[/C][C]-1.9001[/C][C]0.031034[/C][/ROW]
[ROW][C]5[/C][C]0.130132[/C][C]1.0247[/C][C]0.154753[/C][/ROW]
[ROW][C]6[/C][C]0.106064[/C][C]0.8351[/C][C]0.203421[/C][/ROW]
[ROW][C]7[/C][C]-0.278237[/C][C]-2.1908[/C][C]0.016116[/C][/ROW]
[ROW][C]8[/C][C]0.295905[/C][C]2.33[/C][C]0.01154[/C][/ROW]
[ROW][C]9[/C][C]-0.225622[/C][C]-1.7765[/C][C]0.040274[/C][/ROW]
[ROW][C]10[/C][C]0.060583[/C][C]0.477[/C][C]0.317508[/C][/ROW]
[ROW][C]11[/C][C]0.202436[/C][C]1.594[/C][C]0.058013[/C][/ROW]
[ROW][C]12[/C][C]-0.376328[/C][C]-2.9632[/C][C]0.002157[/C][/ROW]
[ROW][C]13[/C][C]0.322131[/C][C]2.5365[/C][C]0.006865[/C][/ROW]
[ROW][C]14[/C][C]-0.168847[/C][C]-1.3295[/C][C]0.094277[/C][/ROW]
[ROW][C]15[/C][C]0.053563[/C][C]0.4218[/C][C]0.33733[/C][/ROW]
[ROW][C]16[/C][C]0.007806[/C][C]0.0615[/C][C]0.475593[/C][/ROW]
[ROW][C]17[/C][C]-0.006858[/C][C]-0.054[/C][C]0.478554[/C][/ROW]
[ROW][C]18[/C][C]-0.047073[/C][C]-0.3707[/C][C]0.35608[/C][/ROW]
[ROW][C]19[/C][C]0.110524[/C][C]0.8703[/C][C]0.193755[/C][/ROW]
[ROW][C]20[/C][C]-0.2007[/C][C]-1.5803[/C][C]0.059562[/C][/ROW]
[ROW][C]21[/C][C]0.31397[/C][C]2.4722[/C][C]0.008093[/C][/ROW]
[ROW][C]22[/C][C]-0.351283[/C][C]-2.766[/C][C]0.003734[/C][/ROW]
[ROW][C]23[/C][C]0.249464[/C][C]1.9643[/C][C]0.026992[/C][/ROW]
[ROW][C]24[/C][C]-0.058274[/C][C]-0.4589[/C][C]0.323972[/C][/ROW]
[ROW][C]25[/C][C]-0.122101[/C][C]-0.9614[/C][C]0.170037[/C][/ROW]
[ROW][C]26[/C][C]0.195237[/C][C]1.5373[/C][C]0.064655[/C][/ROW]
[ROW][C]27[/C][C]-0.127306[/C][C]-1.0024[/C][C]0.160021[/C][/ROW]
[ROW][C]28[/C][C]0.00192[/C][C]0.0151[/C][C]0.493992[/C][/ROW]
[ROW][C]29[/C][C]0.068173[/C][C]0.5368[/C][C]0.296666[/C][/ROW]
[ROW][C]30[/C][C]-0.064067[/C][C]-0.5045[/C][C]0.307861[/C][/ROW]
[ROW][C]31[/C][C]0.0116[/C][C]0.0913[/C][C]0.463759[/C][/ROW]
[ROW][C]32[/C][C]0.084264[/C][C]0.6635[/C][C]0.254737[/C][/ROW]
[ROW][C]33[/C][C]-0.187619[/C][C]-1.4773[/C][C]0.072327[/C][/ROW]
[ROW][C]34[/C][C]0.23424[/C][C]1.8444[/C][C]0.034951[/C][/ROW]
[ROW][C]35[/C][C]-0.1819[/C][C]-1.4323[/C][C]0.078543[/C][/ROW]
[ROW][C]36[/C][C]0.061456[/C][C]0.4839[/C][C]0.31508[/C][/ROW]
[ROW][C]37[/C][C]0.048279[/C][C]0.3802[/C][C]0.352566[/C][/ROW]
[ROW][C]38[/C][C]-0.08091[/C][C]-0.6371[/C][C]0.263207[/C][/ROW]
[ROW][C]39[/C][C]0.024875[/C][C]0.1959[/C][C]0.422679[/C][/ROW]
[ROW][C]40[/C][C]0.044045[/C][C]0.3468[/C][C]0.364953[/C][/ROW]
[ROW][C]41[/C][C]-0.044749[/C][C]-0.3524[/C][C]0.362885[/C][/ROW]
[ROW][C]42[/C][C]0.013128[/C][C]0.1034[/C][C]0.459003[/C][/ROW]
[ROW][C]43[/C][C]-0.030049[/C][C]-0.2366[/C][C]0.406871[/C][/ROW]
[ROW][C]44[/C][C]0.064875[/C][C]0.5108[/C][C]0.305645[/C][/ROW]
[ROW][C]45[/C][C]-0.0527[/C][C]-0.415[/C][C]0.339803[/C][/ROW]
[ROW][C]46[/C][C]-0.011646[/C][C]-0.0917[/C][C]0.463616[/C][/ROW]
[ROW][C]47[/C][C]0.073653[/C][C]0.5799[/C][C]0.282028[/C][/ROW]
[ROW][C]48[/C][C]-0.093259[/C][C]-0.7343[/C][C]0.232759[/C][/ROW]
[ROW][C]49[/C][C]0.066942[/C][C]0.5271[/C][C]0.300003[/C][/ROW]
[ROW][C]50[/C][C]-0.025071[/C][C]-0.1974[/C][C]0.422078[/C][/ROW]
[ROW][C]51[/C][C]0.007063[/C][C]0.0556[/C][C]0.477913[/C][/ROW]
[ROW][C]52[/C][C]-0.019692[/C][C]-0.1551[/C][C]0.438639[/C][/ROW]
[ROW][C]53[/C][C]0.020439[/C][C]0.1609[/C][C]0.436333[/C][/ROW]
[ROW][C]54[/C][C]-0.002576[/C][C]-0.0203[/C][C]0.491941[/C][/ROW]
[ROW][C]55[/C][C]0.006571[/C][C]0.0517[/C][C]0.47945[/C][/ROW]
[ROW][C]56[/C][C]-0.024363[/C][C]-0.1918[/C][C]0.424249[/C][/ROW]
[ROW][C]57[/C][C]0.040168[/C][C]0.3163[/C][C]0.376425[/C][/ROW]
[ROW][C]58[/C][C]-0.049231[/C][C]-0.3876[/C][C]0.349803[/C][/ROW]
[ROW][C]59[/C][C]0.03741[/C][C]0.2946[/C][C]0.384653[/C][/ROW]
[ROW][C]60[/C][C]-0.010523[/C][C]-0.0829[/C][C]0.467116[/C][/ROW]
[/TABLE]
Source: https://freestatistics.org/blog/index.php?pk=31657&T=1

Globally Unique Identifier (entire table): ba.freestatistics.org/blog/index.php?pk=31657&T=1

As an alternative you can also use a QR Code:  

The GUIDs for individual cells are displayed in the table below:

Autocorrelation Function
Time lag kACF(k)T-STATP-value
1-0.708206-5.57640
20.1843291.45140.075853
30.1517541.19490.118336
4-0.241318-1.90010.031034
50.1301321.02470.154753
60.1060640.83510.203421
7-0.278237-2.19080.016116
80.2959052.330.01154
9-0.225622-1.77650.040274
100.0605830.4770.317508
110.2024361.5940.058013
12-0.376328-2.96320.002157
130.3221312.53650.006865
14-0.168847-1.32950.094277
150.0535630.42180.33733
160.0078060.06150.475593
17-0.006858-0.0540.478554
18-0.047073-0.37070.35608
190.1105240.87030.193755
20-0.2007-1.58030.059562
210.313972.47220.008093
22-0.351283-2.7660.003734
230.2494641.96430.026992
24-0.058274-0.45890.323972
25-0.122101-0.96140.170037
260.1952371.53730.064655
27-0.127306-1.00240.160021
280.001920.01510.493992
290.0681730.53680.296666
30-0.064067-0.50450.307861
310.01160.09130.463759
320.0842640.66350.254737
33-0.187619-1.47730.072327
340.234241.84440.034951
35-0.1819-1.43230.078543
360.0614560.48390.31508
370.0482790.38020.352566
38-0.08091-0.63710.263207
390.0248750.19590.422679
400.0440450.34680.364953
41-0.044749-0.35240.362885
420.0131280.10340.459003
43-0.030049-0.23660.406871
440.0648750.51080.305645
45-0.0527-0.4150.339803
46-0.011646-0.09170.463616
470.0736530.57990.282028
48-0.093259-0.73430.232759
490.0669420.52710.300003
50-0.025071-0.19740.422078
510.0070630.05560.477913
52-0.019692-0.15510.438639
530.0204390.16090.436333
54-0.002576-0.02030.491941
550.0065710.05170.47945
56-0.024363-0.19180.424249
570.0401680.31630.376425
58-0.049231-0.38760.349803
590.037410.29460.384653
60-0.010523-0.08290.467116


Partial Autocorrelation Function
Time lag kPACF(k)T-STATP-value
1-0.708206-5.57640
2-0.636431-5.01132e-06
3-0.287791-2.26610.013474
4-0.230425-1.81440.03723
5-0.31747-2.49980.007544
60.0573290.45140.326635
70.0179130.14110.444144
80.1622261.27740.103117
9-0.019356-0.15240.439681
10-0.250773-1.97460.026387
110.1644171.29460.100125
120.0140910.1110.456005
130.0414350.32630.372664
14-0.196833-1.54990.063132
150.030690.24170.404923
16-0.046492-0.36610.357776
17-0.067381-0.53060.29881
180.0073010.05750.47717
190.092230.72620.235218
20-0.147223-1.15920.125402
210.052210.41110.341208
22-0.140846-1.1090.135851
230.0402810.31720.37609
240.100350.79020.216224
25-0.034915-0.27490.392146
26-0.038308-0.30160.381969
27-0.020769-0.16350.435315
280.0803560.63270.264619
29-0.095014-0.74810.228602
30-0.00166-0.01310.494805
310.0178590.14060.444313
32-0.004982-0.03920.484417
33-0.004899-0.03860.484676
34-0.054089-0.42590.335829
350.1546361.21760.113994
360.0449940.35430.362165
370.0102080.08040.468096
38-0.056684-0.44630.328458
39-0.013079-0.1030.459155
40-0.078318-0.61670.269853
410.0564160.44420.329216
420.0569850.44870.327606
43-0.05232-0.4120.340891
44-0.048379-0.38090.352277
45-0.065963-0.51940.302669
46-0.053044-0.41770.338818
47-0.083855-0.66030.255761
480.0063660.05010.48009
49-0.005158-0.04060.483867
50-0.024516-0.1930.42378
51-0.015788-0.12430.450733
52-0.062599-0.49290.311912
53-0.038231-0.3010.382198
540.0263040.20710.4183
55-0.034466-0.27140.393497
560.0069570.05480.478246
570.1245110.98040.16535
58-0.020407-0.16070.436431
590.0152020.11970.452552
60-0.043548-0.34290.366419

\begin{tabular}{lllllllll}
\hline
Partial Autocorrelation Function \tabularnewline
Time lag k & PACF(k) & T-STAT & P-value \tabularnewline
1 & -0.708206 & -5.5764 & 0 \tabularnewline
2 & -0.636431 & -5.0113 & 2e-06 \tabularnewline
3 & -0.287791 & -2.2661 & 0.013474 \tabularnewline
4 & -0.230425 & -1.8144 & 0.03723 \tabularnewline
5 & -0.31747 & -2.4998 & 0.007544 \tabularnewline
6 & 0.057329 & 0.4514 & 0.326635 \tabularnewline
7 & 0.017913 & 0.1411 & 0.444144 \tabularnewline
8 & 0.162226 & 1.2774 & 0.103117 \tabularnewline
9 & -0.019356 & -0.1524 & 0.439681 \tabularnewline
10 & -0.250773 & -1.9746 & 0.026387 \tabularnewline
11 & 0.164417 & 1.2946 & 0.100125 \tabularnewline
12 & 0.014091 & 0.111 & 0.456005 \tabularnewline
13 & 0.041435 & 0.3263 & 0.372664 \tabularnewline
14 & -0.196833 & -1.5499 & 0.063132 \tabularnewline
15 & 0.03069 & 0.2417 & 0.404923 \tabularnewline
16 & -0.046492 & -0.3661 & 0.357776 \tabularnewline
17 & -0.067381 & -0.5306 & 0.29881 \tabularnewline
18 & 0.007301 & 0.0575 & 0.47717 \tabularnewline
19 & 0.09223 & 0.7262 & 0.235218 \tabularnewline
20 & -0.147223 & -1.1592 & 0.125402 \tabularnewline
21 & 0.05221 & 0.4111 & 0.341208 \tabularnewline
22 & -0.140846 & -1.109 & 0.135851 \tabularnewline
23 & 0.040281 & 0.3172 & 0.37609 \tabularnewline
24 & 0.10035 & 0.7902 & 0.216224 \tabularnewline
25 & -0.034915 & -0.2749 & 0.392146 \tabularnewline
26 & -0.038308 & -0.3016 & 0.381969 \tabularnewline
27 & -0.020769 & -0.1635 & 0.435315 \tabularnewline
28 & 0.080356 & 0.6327 & 0.264619 \tabularnewline
29 & -0.095014 & -0.7481 & 0.228602 \tabularnewline
30 & -0.00166 & -0.0131 & 0.494805 \tabularnewline
31 & 0.017859 & 0.1406 & 0.444313 \tabularnewline
32 & -0.004982 & -0.0392 & 0.484417 \tabularnewline
33 & -0.004899 & -0.0386 & 0.484676 \tabularnewline
34 & -0.054089 & -0.4259 & 0.335829 \tabularnewline
35 & 0.154636 & 1.2176 & 0.113994 \tabularnewline
36 & 0.044994 & 0.3543 & 0.362165 \tabularnewline
37 & 0.010208 & 0.0804 & 0.468096 \tabularnewline
38 & -0.056684 & -0.4463 & 0.328458 \tabularnewline
39 & -0.013079 & -0.103 & 0.459155 \tabularnewline
40 & -0.078318 & -0.6167 & 0.269853 \tabularnewline
41 & 0.056416 & 0.4442 & 0.329216 \tabularnewline
42 & 0.056985 & 0.4487 & 0.327606 \tabularnewline
43 & -0.05232 & -0.412 & 0.340891 \tabularnewline
44 & -0.048379 & -0.3809 & 0.352277 \tabularnewline
45 & -0.065963 & -0.5194 & 0.302669 \tabularnewline
46 & -0.053044 & -0.4177 & 0.338818 \tabularnewline
47 & -0.083855 & -0.6603 & 0.255761 \tabularnewline
48 & 0.006366 & 0.0501 & 0.48009 \tabularnewline
49 & -0.005158 & -0.0406 & 0.483867 \tabularnewline
50 & -0.024516 & -0.193 & 0.42378 \tabularnewline
51 & -0.015788 & -0.1243 & 0.450733 \tabularnewline
52 & -0.062599 & -0.4929 & 0.311912 \tabularnewline
53 & -0.038231 & -0.301 & 0.382198 \tabularnewline
54 & 0.026304 & 0.2071 & 0.4183 \tabularnewline
55 & -0.034466 & -0.2714 & 0.393497 \tabularnewline
56 & 0.006957 & 0.0548 & 0.478246 \tabularnewline
57 & 0.124511 & 0.9804 & 0.16535 \tabularnewline
58 & -0.020407 & -0.1607 & 0.436431 \tabularnewline
59 & 0.015202 & 0.1197 & 0.452552 \tabularnewline
60 & -0.043548 & -0.3429 & 0.366419 \tabularnewline
\hline
\end{tabular}
%Source: https://freestatistics.org/blog/index.php?pk=31657&T=2

[TABLE]
[ROW][C]Partial Autocorrelation Function[/C][/ROW]
[ROW][C]Time lag k[/C][C]PACF(k)[/C][C]T-STAT[/C][C]P-value[/C][/ROW]
[ROW][C]1[/C][C]-0.708206[/C][C]-5.5764[/C][C]0[/C][/ROW]
[ROW][C]2[/C][C]-0.636431[/C][C]-5.0113[/C][C]2e-06[/C][/ROW]
[ROW][C]3[/C][C]-0.287791[/C][C]-2.2661[/C][C]0.013474[/C][/ROW]
[ROW][C]4[/C][C]-0.230425[/C][C]-1.8144[/C][C]0.03723[/C][/ROW]
[ROW][C]5[/C][C]-0.31747[/C][C]-2.4998[/C][C]0.007544[/C][/ROW]
[ROW][C]6[/C][C]0.057329[/C][C]0.4514[/C][C]0.326635[/C][/ROW]
[ROW][C]7[/C][C]0.017913[/C][C]0.1411[/C][C]0.444144[/C][/ROW]
[ROW][C]8[/C][C]0.162226[/C][C]1.2774[/C][C]0.103117[/C][/ROW]
[ROW][C]9[/C][C]-0.019356[/C][C]-0.1524[/C][C]0.439681[/C][/ROW]
[ROW][C]10[/C][C]-0.250773[/C][C]-1.9746[/C][C]0.026387[/C][/ROW]
[ROW][C]11[/C][C]0.164417[/C][C]1.2946[/C][C]0.100125[/C][/ROW]
[ROW][C]12[/C][C]0.014091[/C][C]0.111[/C][C]0.456005[/C][/ROW]
[ROW][C]13[/C][C]0.041435[/C][C]0.3263[/C][C]0.372664[/C][/ROW]
[ROW][C]14[/C][C]-0.196833[/C][C]-1.5499[/C][C]0.063132[/C][/ROW]
[ROW][C]15[/C][C]0.03069[/C][C]0.2417[/C][C]0.404923[/C][/ROW]
[ROW][C]16[/C][C]-0.046492[/C][C]-0.3661[/C][C]0.357776[/C][/ROW]
[ROW][C]17[/C][C]-0.067381[/C][C]-0.5306[/C][C]0.29881[/C][/ROW]
[ROW][C]18[/C][C]0.007301[/C][C]0.0575[/C][C]0.47717[/C][/ROW]
[ROW][C]19[/C][C]0.09223[/C][C]0.7262[/C][C]0.235218[/C][/ROW]
[ROW][C]20[/C][C]-0.147223[/C][C]-1.1592[/C][C]0.125402[/C][/ROW]
[ROW][C]21[/C][C]0.05221[/C][C]0.4111[/C][C]0.341208[/C][/ROW]
[ROW][C]22[/C][C]-0.140846[/C][C]-1.109[/C][C]0.135851[/C][/ROW]
[ROW][C]23[/C][C]0.040281[/C][C]0.3172[/C][C]0.37609[/C][/ROW]
[ROW][C]24[/C][C]0.10035[/C][C]0.7902[/C][C]0.216224[/C][/ROW]
[ROW][C]25[/C][C]-0.034915[/C][C]-0.2749[/C][C]0.392146[/C][/ROW]
[ROW][C]26[/C][C]-0.038308[/C][C]-0.3016[/C][C]0.381969[/C][/ROW]
[ROW][C]27[/C][C]-0.020769[/C][C]-0.1635[/C][C]0.435315[/C][/ROW]
[ROW][C]28[/C][C]0.080356[/C][C]0.6327[/C][C]0.264619[/C][/ROW]
[ROW][C]29[/C][C]-0.095014[/C][C]-0.7481[/C][C]0.228602[/C][/ROW]
[ROW][C]30[/C][C]-0.00166[/C][C]-0.0131[/C][C]0.494805[/C][/ROW]
[ROW][C]31[/C][C]0.017859[/C][C]0.1406[/C][C]0.444313[/C][/ROW]
[ROW][C]32[/C][C]-0.004982[/C][C]-0.0392[/C][C]0.484417[/C][/ROW]
[ROW][C]33[/C][C]-0.004899[/C][C]-0.0386[/C][C]0.484676[/C][/ROW]
[ROW][C]34[/C][C]-0.054089[/C][C]-0.4259[/C][C]0.335829[/C][/ROW]
[ROW][C]35[/C][C]0.154636[/C][C]1.2176[/C][C]0.113994[/C][/ROW]
[ROW][C]36[/C][C]0.044994[/C][C]0.3543[/C][C]0.362165[/C][/ROW]
[ROW][C]37[/C][C]0.010208[/C][C]0.0804[/C][C]0.468096[/C][/ROW]
[ROW][C]38[/C][C]-0.056684[/C][C]-0.4463[/C][C]0.328458[/C][/ROW]
[ROW][C]39[/C][C]-0.013079[/C][C]-0.103[/C][C]0.459155[/C][/ROW]
[ROW][C]40[/C][C]-0.078318[/C][C]-0.6167[/C][C]0.269853[/C][/ROW]
[ROW][C]41[/C][C]0.056416[/C][C]0.4442[/C][C]0.329216[/C][/ROW]
[ROW][C]42[/C][C]0.056985[/C][C]0.4487[/C][C]0.327606[/C][/ROW]
[ROW][C]43[/C][C]-0.05232[/C][C]-0.412[/C][C]0.340891[/C][/ROW]
[ROW][C]44[/C][C]-0.048379[/C][C]-0.3809[/C][C]0.352277[/C][/ROW]
[ROW][C]45[/C][C]-0.065963[/C][C]-0.5194[/C][C]0.302669[/C][/ROW]
[ROW][C]46[/C][C]-0.053044[/C][C]-0.4177[/C][C]0.338818[/C][/ROW]
[ROW][C]47[/C][C]-0.083855[/C][C]-0.6603[/C][C]0.255761[/C][/ROW]
[ROW][C]48[/C][C]0.006366[/C][C]0.0501[/C][C]0.48009[/C][/ROW]
[ROW][C]49[/C][C]-0.005158[/C][C]-0.0406[/C][C]0.483867[/C][/ROW]
[ROW][C]50[/C][C]-0.024516[/C][C]-0.193[/C][C]0.42378[/C][/ROW]
[ROW][C]51[/C][C]-0.015788[/C][C]-0.1243[/C][C]0.450733[/C][/ROW]
[ROW][C]52[/C][C]-0.062599[/C][C]-0.4929[/C][C]0.311912[/C][/ROW]
[ROW][C]53[/C][C]-0.038231[/C][C]-0.301[/C][C]0.382198[/C][/ROW]
[ROW][C]54[/C][C]0.026304[/C][C]0.2071[/C][C]0.4183[/C][/ROW]
[ROW][C]55[/C][C]-0.034466[/C][C]-0.2714[/C][C]0.393497[/C][/ROW]
[ROW][C]56[/C][C]0.006957[/C][C]0.0548[/C][C]0.478246[/C][/ROW]
[ROW][C]57[/C][C]0.124511[/C][C]0.9804[/C][C]0.16535[/C][/ROW]
[ROW][C]58[/C][C]-0.020407[/C][C]-0.1607[/C][C]0.436431[/C][/ROW]
[ROW][C]59[/C][C]0.015202[/C][C]0.1197[/C][C]0.452552[/C][/ROW]
[ROW][C]60[/C][C]-0.043548[/C][C]-0.3429[/C][C]0.366419[/C][/ROW]
[/TABLE]
Source: https://freestatistics.org/blog/index.php?pk=31657&T=2

Globally Unique Identifier (entire table): ba.freestatistics.org/blog/index.php?pk=31657&T=2

As an alternative you can also use a QR Code:  

The GUIDs for individual cells are displayed in the table below:

Partial Autocorrelation Function
Time lag kPACF(k)T-STATP-value
1-0.708206-5.57640
2-0.636431-5.01132e-06
3-0.287791-2.26610.013474
4-0.230425-1.81440.03723
5-0.31747-2.49980.007544
60.0573290.45140.326635
70.0179130.14110.444144
80.1622261.27740.103117
9-0.019356-0.15240.439681
10-0.250773-1.97460.026387
110.1644171.29460.100125
120.0140910.1110.456005
130.0414350.32630.372664
14-0.196833-1.54990.063132
150.030690.24170.404923
16-0.046492-0.36610.357776
17-0.067381-0.53060.29881
180.0073010.05750.47717
190.092230.72620.235218
20-0.147223-1.15920.125402
210.052210.41110.341208
22-0.140846-1.1090.135851
230.0402810.31720.37609
240.100350.79020.216224
25-0.034915-0.27490.392146
26-0.038308-0.30160.381969
27-0.020769-0.16350.435315
280.0803560.63270.264619
29-0.095014-0.74810.228602
30-0.00166-0.01310.494805
310.0178590.14060.444313
32-0.004982-0.03920.484417
33-0.004899-0.03860.484676
34-0.054089-0.42590.335829
350.1546361.21760.113994
360.0449940.35430.362165
370.0102080.08040.468096
38-0.056684-0.44630.328458
39-0.013079-0.1030.459155
40-0.078318-0.61670.269853
410.0564160.44420.329216
420.0569850.44870.327606
43-0.05232-0.4120.340891
44-0.048379-0.38090.352277
45-0.065963-0.51940.302669
46-0.053044-0.41770.338818
47-0.083855-0.66030.255761
480.0063660.05010.48009
49-0.005158-0.04060.483867
50-0.024516-0.1930.42378
51-0.015788-0.12430.450733
52-0.062599-0.49290.311912
53-0.038231-0.3010.382198
540.0263040.20710.4183
55-0.034466-0.27140.393497
560.0069570.05480.478246
570.1245110.98040.16535
58-0.020407-0.16070.436431
590.0152020.11970.452552
60-0.043548-0.34290.366419


Parameters (Session):
par1 = 60 ; par2 = 1 ; par3 = 2 ; par4 = 2 ; par5 = 12 ;
Parameters (R input):
par1 = 60 ; par2 = 1 ; par3 = 2 ; par4 = 2 ; par5 = 12 ;
R code (references can be found in the software module):
if (par1 == 'Default') {
par1 = 10*log10(length(x))
} else {
par1 <- as.numeric(par1)
}
par2 <- as.numeric(par2)
par3 <- as.numeric(par3)
par4 <- as.numeric(par4)
par5 <- as.numeric(par5)
if (par2 == 0) {
x <- log(x)
} else {
x <- (x ^ par2 - 1) / par2
}
if (par3 > 0) x <- diff(x,lag=1,difference=par3)
if (par4 > 0) x <- diff(x,lag=par5,difference=par4)
bitmap(file='pic1.png')
racf <- acf(x,par1,main='Autocorrelation',xlab='lags',ylab='ACF')
dev.off()
bitmap(file='pic2.png')
rpacf <- pacf(x,par1,main='Partial Autocorrelation',xlab='lags',ylab='PACF')
dev.off()
(myacf <- c(racf$acf))
(mypacf <- c(rpacf$acf))
lengthx <- length(x)
sqrtn <- sqrt(lengthx)
load(file='createtable')
a<-table.start()
a<-table.row.start(a)
a<-table.element(a,'Autocorrelation Function',4,TRUE)
a<-table.row.end(a)
a<-table.row.start(a)
a<-table.element(a,'Time lag k',header=TRUE)
a<-table.element(a,hyperlink('basics.htm','ACF(k)','click here for more information about the Autocorrelation Function'),header=TRUE)
a<-table.element(a,'T-STAT',header=TRUE)
a<-table.element(a,'P-value',header=TRUE)
a<-table.row.end(a)
for (i in 2:(par1+1)) {
a<-table.row.start(a)
a<-table.element(a,i-1,header=TRUE)
a<-table.element(a,round(myacf[i],6))
mytstat <- myacf[i]*sqrtn
a<-table.element(a,round(mytstat,4))
a<-table.element(a,round(1-pt(abs(mytstat),lengthx),6))
a<-table.row.end(a)
}
a<-table.end(a)
table.save(a,file='mytable.tab')
a<-table.start()
a<-table.row.start(a)
a<-table.element(a,'Partial Autocorrelation Function',4,TRUE)
a<-table.row.end(a)
a<-table.row.start(a)
a<-table.element(a,'Time lag k',header=TRUE)
a<-table.element(a,hyperlink('basics.htm','PACF(k)','click here for more information about the Partial Autocorrelation Function'),header=TRUE)
a<-table.element(a,'T-STAT',header=TRUE)
a<-table.element(a,'P-value',header=TRUE)
a<-table.row.end(a)
for (i in 1:par1) {
a<-table.row.start(a)
a<-table.element(a,i,header=TRUE)
a<-table.element(a,round(mypacf[i],6))
mytstat <- mypacf[i]*sqrtn
a<-table.element(a,round(mytstat,4))
a<-table.element(a,round(1-pt(abs(mytstat),lengthx),6))
a<-table.row.end(a)
}
a<-table.end(a)
table.save(a,file='mytable1.tab')