Free Statistics

of Irreproducible Research!

Author's title

Author*Unverified author*
R Software Modulerwasp_autocorrelation.wasp
Title produced by software(Partial) Autocorrelation Function
Date of computationTue, 09 Dec 2008 11:08:11 -0700
Cite this page as followsStatistical Computations at FreeStatistics.org, Office for Research Development and Education, URL https://freestatistics.org/blog/index.php?v=date/2008/Dec/09/t1228846132ogkz5ftviu9boka.htm/, Retrieved Sun, 19 May 2024 12:18:45 +0000
Statistical Computations at FreeStatistics.org, Office for Research Development and Education, URL https://freestatistics.org/blog/index.php?pk=31654, Retrieved Sun, 19 May 2024 12:18:45 +0000
QR Codes:

Original text written by user:
IsPrivate?No (this computation is public)
User-defined keywords
Estimated Impact205
Family? (F = Feedback message, R = changed R code, M = changed R Module, P = changed Parameters, D = changed Data)
-     [Univariate Data Series] [data set] [2008-12-01 19:54:57] [b98453cac15ba1066b407e146608df68]
F RMPD  [Standard Deviation-Mean Plot] [Identification an...] [2008-12-09 12:57:00] [8ac58ef7b35dc5a117bc162cf16850e9]
F RM D    [Variance Reduction Matrix] [Identification an...] [2008-12-09 13:00:44] [8ac58ef7b35dc5a117bc162cf16850e9]
F RM        [(Partial) Autocorrelation Function] [Identification an...] [2008-12-09 13:03:20] [8ac58ef7b35dc5a117bc162cf16850e9]
F RM          [Spectral Analysis] [Identification an...] [2008-12-09 13:05:46] [8ac58ef7b35dc5a117bc162cf16850e9]
F RM            [(Partial) Autocorrelation Function] [Identification an...] [2008-12-09 13:10:48] [8ac58ef7b35dc5a117bc162cf16850e9]
F   P               [(Partial) Autocorrelation Function] [step 4 ip] [2008-12-09 18:08:11] [d41d8cd98f00b204e9800998ecf8427e] [Current]
Feedback Forum
2008-12-15 21:59:40 [Jonas Janssens] [reply
Goede uitleg.
2008-12-16 19:46:33 [Kevin Vermeiren] [reply
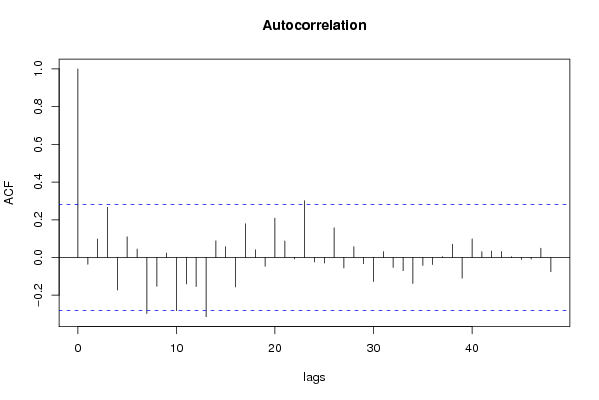
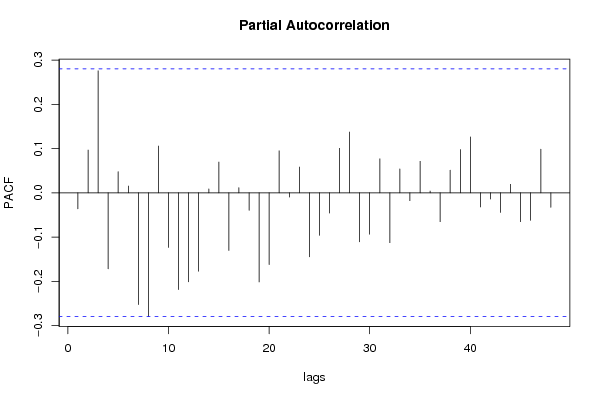
Het antwoord van de student is correct. De student vergeet wel te vermelden dat de gevonden waarden uit step 3 ingevuld moeten worden. De student vermeldt terecht en correct hoe we opzoek moeten gaan naar de AR processen. Eerst dient de autocorrelation function vergeleken te worden met de theoretische patronen voor AR (p) processen. Om vervolgens de orde ervan te bepalen wordt inderdaad gekeken naar de partiële correlatie functie. Het klopt dat er geen Ar proces aanwezig is. De waarde voor p is dus 0. Vervolgens legt de student de werking voor het zoeken van MA (q) processen volledig juist uit. We kijken dus eerst naar de partiële correlatie functie en zien hier geen gelijkenis met een theoretisch patroon voor MA processen. We besluiten dus dat er geen MA proces aanwezig is. Nu wordt de aanwezigheid van seizoenale ARMA processen nagegaan. Het klopt dat er nu naar de seizoenale (partiële) autocorrelatie coëfficiënten gekeken moet worden. Voor de SAR (P) processen zien we geen enkele gelijkenis met de theoretische patronen (kijken naar autocorrelation function). Er is dus geen SAR patroon waarneembaar. Ten slotte gaan we opzoek naar SMA (Q) processen. Ook hier legt de student de werking voor het onderzoek volledig uit. We zien geen enkele correspondentie met de theoretische patronen. We kunnen dus besluiten dat er ook geen SMA proces aanwezig is. Ten slotte is de conclusie van de student geheel juist.

Post a new message
Dataseries X:
110.40
96.40
101.90
106.20
81.00
94.70
101.00
109.40
102.30
90.70
96.20
96.10
106.00
103.10
102.00
104.70
86.00
92.10
106.90
112.60
101.70
92.00
97.40
97.00
105.40
102.70
98.10
104.50
87.40
89.90
109.80
111.70
98.60
96.90
95.10
97.00
112.70
102.90
97.40
111.40
87.40
96.80
114.10
110.30
103.90
101.60
94.60
95.90
104.70
102.80
98.10
113.90
80.90
95.70
113.20
105.90
108.80
102.30
99.00
100.70
115.50


Summary of computational transaction
Raw Inputview raw input (R code)
Raw Outputview raw output of R engine
Computing time1 seconds
R Server'George Udny Yule' @ 72.249.76.132

\begin{tabular}{lllllllll}
\hline
Summary of computational transaction \tabularnewline
Raw Input & view raw input (R code)  \tabularnewline
Raw Output & view raw output of R engine  \tabularnewline
Computing time & 1 seconds \tabularnewline
R Server & 'George Udny Yule' @ 72.249.76.132 \tabularnewline
\hline
\end{tabular}
%Source: https://freestatistics.org/blog/index.php?pk=31654&T=0

[TABLE]
[ROW][C]Summary of computational transaction[/C][/ROW]
[ROW][C]Raw Input[/C][C]view raw input (R code) [/C][/ROW]
[ROW][C]Raw Output[/C][C]view raw output of R engine [/C][/ROW]
[ROW][C]Computing time[/C][C]1 seconds[/C][/ROW]
[ROW][C]R Server[/C][C]'George Udny Yule' @ 72.249.76.132[/C][/ROW]
[/TABLE]
Source: https://freestatistics.org/blog/index.php?pk=31654&T=0

Globally Unique Identifier (entire table): ba.freestatistics.org/blog/index.php?pk=31654&T=0

As an alternative you can also use a QR Code:  

The GUIDs for individual cells are displayed in the table below:

Summary of computational transaction
Raw Inputview raw input (R code)
Raw Outputview raw output of R engine
Computing time1 seconds
R Server'George Udny Yule' @ 72.249.76.132


Autocorrelation Function
Time lag kACF(k)T-STATP-value
1-0.036298-0.25410.400245
20.0977530.68430.248513
30.2662371.86370.034184
4-0.172635-1.20840.116338
50.1095490.76680.223427
60.044690.31280.377868
7-0.29752-2.08260.021263
8-0.152662-1.06860.145236
90.0232440.16270.435708
10-0.282113-1.97480.02697
11-0.140453-0.98320.165176
12-0.154458-1.08120.142449
13-0.313797-2.19660.016406
140.0883190.61820.269642
150.0571180.39980.345511
16-0.15635-1.09450.139554
170.178621.25030.108556
180.0404820.28340.389042
19-0.04687-0.32810.37212
200.2082491.45770.075646
210.0879110.61540.270577
22-0.00789-0.05520.478089
230.3012532.10880.02005
24-0.023656-0.16560.434579
25-0.029675-0.20770.418152
260.1572231.10060.138232
27-0.05572-0.390.349099
280.0572760.40090.345105
29-0.033047-0.23130.409012
30-0.127668-0.89370.187932
310.0312920.2190.413762
32-0.05263-0.36840.357077
33-0.07032-0.49220.312374
34-0.137685-0.96380.16994
35-0.04232-0.29620.384149
36-0.037384-0.26170.39733
370.0046320.03240.487133
380.0707180.4950.311397
39-0.109488-0.76640.223552
400.0986350.69040.246587
410.0310350.21720.414459
420.0342990.24010.405629
430.0321880.22530.411335
440.004560.03190.487332
45-0.010396-0.07280.471142
46-0.008534-0.05970.476304
470.0495040.34650.365215
48-0.075219-0.52650.300447
49NANANA
50NANANA
51NANANA
52NANANA
53NANANA
54NANANA
55NANANA
56NANANA
57NANANA
58NANANA
59NANANA
60NANANA

\begin{tabular}{lllllllll}
\hline
Autocorrelation Function \tabularnewline
Time lag k & ACF(k) & T-STAT & P-value \tabularnewline
1 & -0.036298 & -0.2541 & 0.400245 \tabularnewline
2 & 0.097753 & 0.6843 & 0.248513 \tabularnewline
3 & 0.266237 & 1.8637 & 0.034184 \tabularnewline
4 & -0.172635 & -1.2084 & 0.116338 \tabularnewline
5 & 0.109549 & 0.7668 & 0.223427 \tabularnewline
6 & 0.04469 & 0.3128 & 0.377868 \tabularnewline
7 & -0.29752 & -2.0826 & 0.021263 \tabularnewline
8 & -0.152662 & -1.0686 & 0.145236 \tabularnewline
9 & 0.023244 & 0.1627 & 0.435708 \tabularnewline
10 & -0.282113 & -1.9748 & 0.02697 \tabularnewline
11 & -0.140453 & -0.9832 & 0.165176 \tabularnewline
12 & -0.154458 & -1.0812 & 0.142449 \tabularnewline
13 & -0.313797 & -2.1966 & 0.016406 \tabularnewline
14 & 0.088319 & 0.6182 & 0.269642 \tabularnewline
15 & 0.057118 & 0.3998 & 0.345511 \tabularnewline
16 & -0.15635 & -1.0945 & 0.139554 \tabularnewline
17 & 0.17862 & 1.2503 & 0.108556 \tabularnewline
18 & 0.040482 & 0.2834 & 0.389042 \tabularnewline
19 & -0.04687 & -0.3281 & 0.37212 \tabularnewline
20 & 0.208249 & 1.4577 & 0.075646 \tabularnewline
21 & 0.087911 & 0.6154 & 0.270577 \tabularnewline
22 & -0.00789 & -0.0552 & 0.478089 \tabularnewline
23 & 0.301253 & 2.1088 & 0.02005 \tabularnewline
24 & -0.023656 & -0.1656 & 0.434579 \tabularnewline
25 & -0.029675 & -0.2077 & 0.418152 \tabularnewline
26 & 0.157223 & 1.1006 & 0.138232 \tabularnewline
27 & -0.05572 & -0.39 & 0.349099 \tabularnewline
28 & 0.057276 & 0.4009 & 0.345105 \tabularnewline
29 & -0.033047 & -0.2313 & 0.409012 \tabularnewline
30 & -0.127668 & -0.8937 & 0.187932 \tabularnewline
31 & 0.031292 & 0.219 & 0.413762 \tabularnewline
32 & -0.05263 & -0.3684 & 0.357077 \tabularnewline
33 & -0.07032 & -0.4922 & 0.312374 \tabularnewline
34 & -0.137685 & -0.9638 & 0.16994 \tabularnewline
35 & -0.04232 & -0.2962 & 0.384149 \tabularnewline
36 & -0.037384 & -0.2617 & 0.39733 \tabularnewline
37 & 0.004632 & 0.0324 & 0.487133 \tabularnewline
38 & 0.070718 & 0.495 & 0.311397 \tabularnewline
39 & -0.109488 & -0.7664 & 0.223552 \tabularnewline
40 & 0.098635 & 0.6904 & 0.246587 \tabularnewline
41 & 0.031035 & 0.2172 & 0.414459 \tabularnewline
42 & 0.034299 & 0.2401 & 0.405629 \tabularnewline
43 & 0.032188 & 0.2253 & 0.411335 \tabularnewline
44 & 0.00456 & 0.0319 & 0.487332 \tabularnewline
45 & -0.010396 & -0.0728 & 0.471142 \tabularnewline
46 & -0.008534 & -0.0597 & 0.476304 \tabularnewline
47 & 0.049504 & 0.3465 & 0.365215 \tabularnewline
48 & -0.075219 & -0.5265 & 0.300447 \tabularnewline
49 & NA & NA & NA \tabularnewline
50 & NA & NA & NA \tabularnewline
51 & NA & NA & NA \tabularnewline
52 & NA & NA & NA \tabularnewline
53 & NA & NA & NA \tabularnewline
54 & NA & NA & NA \tabularnewline
55 & NA & NA & NA \tabularnewline
56 & NA & NA & NA \tabularnewline
57 & NA & NA & NA \tabularnewline
58 & NA & NA & NA \tabularnewline
59 & NA & NA & NA \tabularnewline
60 & NA & NA & NA \tabularnewline
\hline
\end{tabular}
%Source: https://freestatistics.org/blog/index.php?pk=31654&T=1

[TABLE]
[ROW][C]Autocorrelation Function[/C][/ROW]
[ROW][C]Time lag k[/C][C]ACF(k)[/C][C]T-STAT[/C][C]P-value[/C][/ROW]
[ROW][C]1[/C][C]-0.036298[/C][C]-0.2541[/C][C]0.400245[/C][/ROW]
[ROW][C]2[/C][C]0.097753[/C][C]0.6843[/C][C]0.248513[/C][/ROW]
[ROW][C]3[/C][C]0.266237[/C][C]1.8637[/C][C]0.034184[/C][/ROW]
[ROW][C]4[/C][C]-0.172635[/C][C]-1.2084[/C][C]0.116338[/C][/ROW]
[ROW][C]5[/C][C]0.109549[/C][C]0.7668[/C][C]0.223427[/C][/ROW]
[ROW][C]6[/C][C]0.04469[/C][C]0.3128[/C][C]0.377868[/C][/ROW]
[ROW][C]7[/C][C]-0.29752[/C][C]-2.0826[/C][C]0.021263[/C][/ROW]
[ROW][C]8[/C][C]-0.152662[/C][C]-1.0686[/C][C]0.145236[/C][/ROW]
[ROW][C]9[/C][C]0.023244[/C][C]0.1627[/C][C]0.435708[/C][/ROW]
[ROW][C]10[/C][C]-0.282113[/C][C]-1.9748[/C][C]0.02697[/C][/ROW]
[ROW][C]11[/C][C]-0.140453[/C][C]-0.9832[/C][C]0.165176[/C][/ROW]
[ROW][C]12[/C][C]-0.154458[/C][C]-1.0812[/C][C]0.142449[/C][/ROW]
[ROW][C]13[/C][C]-0.313797[/C][C]-2.1966[/C][C]0.016406[/C][/ROW]
[ROW][C]14[/C][C]0.088319[/C][C]0.6182[/C][C]0.269642[/C][/ROW]
[ROW][C]15[/C][C]0.057118[/C][C]0.3998[/C][C]0.345511[/C][/ROW]
[ROW][C]16[/C][C]-0.15635[/C][C]-1.0945[/C][C]0.139554[/C][/ROW]
[ROW][C]17[/C][C]0.17862[/C][C]1.2503[/C][C]0.108556[/C][/ROW]
[ROW][C]18[/C][C]0.040482[/C][C]0.2834[/C][C]0.389042[/C][/ROW]
[ROW][C]19[/C][C]-0.04687[/C][C]-0.3281[/C][C]0.37212[/C][/ROW]
[ROW][C]20[/C][C]0.208249[/C][C]1.4577[/C][C]0.075646[/C][/ROW]
[ROW][C]21[/C][C]0.087911[/C][C]0.6154[/C][C]0.270577[/C][/ROW]
[ROW][C]22[/C][C]-0.00789[/C][C]-0.0552[/C][C]0.478089[/C][/ROW]
[ROW][C]23[/C][C]0.301253[/C][C]2.1088[/C][C]0.02005[/C][/ROW]
[ROW][C]24[/C][C]-0.023656[/C][C]-0.1656[/C][C]0.434579[/C][/ROW]
[ROW][C]25[/C][C]-0.029675[/C][C]-0.2077[/C][C]0.418152[/C][/ROW]
[ROW][C]26[/C][C]0.157223[/C][C]1.1006[/C][C]0.138232[/C][/ROW]
[ROW][C]27[/C][C]-0.05572[/C][C]-0.39[/C][C]0.349099[/C][/ROW]
[ROW][C]28[/C][C]0.057276[/C][C]0.4009[/C][C]0.345105[/C][/ROW]
[ROW][C]29[/C][C]-0.033047[/C][C]-0.2313[/C][C]0.409012[/C][/ROW]
[ROW][C]30[/C][C]-0.127668[/C][C]-0.8937[/C][C]0.187932[/C][/ROW]
[ROW][C]31[/C][C]0.031292[/C][C]0.219[/C][C]0.413762[/C][/ROW]
[ROW][C]32[/C][C]-0.05263[/C][C]-0.3684[/C][C]0.357077[/C][/ROW]
[ROW][C]33[/C][C]-0.07032[/C][C]-0.4922[/C][C]0.312374[/C][/ROW]
[ROW][C]34[/C][C]-0.137685[/C][C]-0.9638[/C][C]0.16994[/C][/ROW]
[ROW][C]35[/C][C]-0.04232[/C][C]-0.2962[/C][C]0.384149[/C][/ROW]
[ROW][C]36[/C][C]-0.037384[/C][C]-0.2617[/C][C]0.39733[/C][/ROW]
[ROW][C]37[/C][C]0.004632[/C][C]0.0324[/C][C]0.487133[/C][/ROW]
[ROW][C]38[/C][C]0.070718[/C][C]0.495[/C][C]0.311397[/C][/ROW]
[ROW][C]39[/C][C]-0.109488[/C][C]-0.7664[/C][C]0.223552[/C][/ROW]
[ROW][C]40[/C][C]0.098635[/C][C]0.6904[/C][C]0.246587[/C][/ROW]
[ROW][C]41[/C][C]0.031035[/C][C]0.2172[/C][C]0.414459[/C][/ROW]
[ROW][C]42[/C][C]0.034299[/C][C]0.2401[/C][C]0.405629[/C][/ROW]
[ROW][C]43[/C][C]0.032188[/C][C]0.2253[/C][C]0.411335[/C][/ROW]
[ROW][C]44[/C][C]0.00456[/C][C]0.0319[/C][C]0.487332[/C][/ROW]
[ROW][C]45[/C][C]-0.010396[/C][C]-0.0728[/C][C]0.471142[/C][/ROW]
[ROW][C]46[/C][C]-0.008534[/C][C]-0.0597[/C][C]0.476304[/C][/ROW]
[ROW][C]47[/C][C]0.049504[/C][C]0.3465[/C][C]0.365215[/C][/ROW]
[ROW][C]48[/C][C]-0.075219[/C][C]-0.5265[/C][C]0.300447[/C][/ROW]
[ROW][C]49[/C][C]NA[/C][C]NA[/C][C]NA[/C][/ROW]
[ROW][C]50[/C][C]NA[/C][C]NA[/C][C]NA[/C][/ROW]
[ROW][C]51[/C][C]NA[/C][C]NA[/C][C]NA[/C][/ROW]
[ROW][C]52[/C][C]NA[/C][C]NA[/C][C]NA[/C][/ROW]
[ROW][C]53[/C][C]NA[/C][C]NA[/C][C]NA[/C][/ROW]
[ROW][C]54[/C][C]NA[/C][C]NA[/C][C]NA[/C][/ROW]
[ROW][C]55[/C][C]NA[/C][C]NA[/C][C]NA[/C][/ROW]
[ROW][C]56[/C][C]NA[/C][C]NA[/C][C]NA[/C][/ROW]
[ROW][C]57[/C][C]NA[/C][C]NA[/C][C]NA[/C][/ROW]
[ROW][C]58[/C][C]NA[/C][C]NA[/C][C]NA[/C][/ROW]
[ROW][C]59[/C][C]NA[/C][C]NA[/C][C]NA[/C][/ROW]
[ROW][C]60[/C][C]NA[/C][C]NA[/C][C]NA[/C][/ROW]
[/TABLE]
Source: https://freestatistics.org/blog/index.php?pk=31654&T=1

Globally Unique Identifier (entire table): ba.freestatistics.org/blog/index.php?pk=31654&T=1

As an alternative you can also use a QR Code:  

The GUIDs for individual cells are displayed in the table below:

Autocorrelation Function
Time lag kACF(k)T-STATP-value
1-0.036298-0.25410.400245
20.0977530.68430.248513
30.2662371.86370.034184
4-0.172635-1.20840.116338
50.1095490.76680.223427
60.044690.31280.377868
7-0.29752-2.08260.021263
8-0.152662-1.06860.145236
90.0232440.16270.435708
10-0.282113-1.97480.02697
11-0.140453-0.98320.165176
12-0.154458-1.08120.142449
13-0.313797-2.19660.016406
140.0883190.61820.269642
150.0571180.39980.345511
16-0.15635-1.09450.139554
170.178621.25030.108556
180.0404820.28340.389042
19-0.04687-0.32810.37212
200.2082491.45770.075646
210.0879110.61540.270577
22-0.00789-0.05520.478089
230.3012532.10880.02005
24-0.023656-0.16560.434579
25-0.029675-0.20770.418152
260.1572231.10060.138232
27-0.05572-0.390.349099
280.0572760.40090.345105
29-0.033047-0.23130.409012
30-0.127668-0.89370.187932
310.0312920.2190.413762
32-0.05263-0.36840.357077
33-0.07032-0.49220.312374
34-0.137685-0.96380.16994
35-0.04232-0.29620.384149
36-0.037384-0.26170.39733
370.0046320.03240.487133
380.0707180.4950.311397
39-0.109488-0.76640.223552
400.0986350.69040.246587
410.0310350.21720.414459
420.0342990.24010.405629
430.0321880.22530.411335
440.004560.03190.487332
45-0.010396-0.07280.471142
46-0.008534-0.05970.476304
470.0495040.34650.365215
48-0.075219-0.52650.300447
49NANANA
50NANANA
51NANANA
52NANANA
53NANANA
54NANANA
55NANANA
56NANANA
57NANANA
58NANANA
59NANANA
60NANANA


Partial Autocorrelation Function
Time lag kPACF(k)T-STATP-value
1-0.036298-0.25410.400245
20.0965630.67590.251128
30.275881.93120.029629
4-0.171892-1.20320.117332
50.0477040.33390.36993
60.0153740.10760.457369
7-0.252777-1.76940.041522
8-0.279311-1.95520.028139
90.1055570.73890.231747
10-0.123598-0.86520.195576
11-0.218733-1.53110.066084
12-0.201145-1.4080.08272
13-0.177118-1.23980.110472
140.0086640.06060.475943
150.0694680.48630.314469
16-0.130399-0.91280.182911
170.0116150.08130.467767
18-0.039604-0.27720.391385
19-0.201566-1.4110.082287
20-0.162243-1.13570.130803
210.0950590.66540.254452
22-0.009701-0.06790.473067
230.0582660.40790.342577
24-0.14462-1.01230.158175
25-0.09605-0.67240.252259
26-0.045749-0.32020.375072
270.100540.70380.242451
280.1374430.96210.170362
29-0.110789-0.77550.220879
30-0.093478-0.65430.257974
310.0768430.53790.29654
32-0.112776-0.78940.216831
330.0539040.37730.35378
34-0.017867-0.12510.45049
350.0711740.49820.310281
360.0039090.02740.489139
37-0.065372-0.45760.32463
380.051090.35760.361078
390.0978340.68480.248336
400.1263830.88470.190325
41-0.031857-0.2230.412233
42-0.014198-0.09940.460618
43-0.04444-0.31110.37853
440.0192780.13490.446603
45-0.065315-0.45720.324773
46-0.062176-0.43520.332653
470.0987120.6910.246418
48-0.032829-0.22980.409601
49NANANA
50NANANA
51NANANA
52NANANA
53NANANA
54NANANA
55NANANA
56NANANA
57NANANA
58NANANA
59NANANA
60NANANA

\begin{tabular}{lllllllll}
\hline
Partial Autocorrelation Function \tabularnewline
Time lag k & PACF(k) & T-STAT & P-value \tabularnewline
1 & -0.036298 & -0.2541 & 0.400245 \tabularnewline
2 & 0.096563 & 0.6759 & 0.251128 \tabularnewline
3 & 0.27588 & 1.9312 & 0.029629 \tabularnewline
4 & -0.171892 & -1.2032 & 0.117332 \tabularnewline
5 & 0.047704 & 0.3339 & 0.36993 \tabularnewline
6 & 0.015374 & 0.1076 & 0.457369 \tabularnewline
7 & -0.252777 & -1.7694 & 0.041522 \tabularnewline
8 & -0.279311 & -1.9552 & 0.028139 \tabularnewline
9 & 0.105557 & 0.7389 & 0.231747 \tabularnewline
10 & -0.123598 & -0.8652 & 0.195576 \tabularnewline
11 & -0.218733 & -1.5311 & 0.066084 \tabularnewline
12 & -0.201145 & -1.408 & 0.08272 \tabularnewline
13 & -0.177118 & -1.2398 & 0.110472 \tabularnewline
14 & 0.008664 & 0.0606 & 0.475943 \tabularnewline
15 & 0.069468 & 0.4863 & 0.314469 \tabularnewline
16 & -0.130399 & -0.9128 & 0.182911 \tabularnewline
17 & 0.011615 & 0.0813 & 0.467767 \tabularnewline
18 & -0.039604 & -0.2772 & 0.391385 \tabularnewline
19 & -0.201566 & -1.411 & 0.082287 \tabularnewline
20 & -0.162243 & -1.1357 & 0.130803 \tabularnewline
21 & 0.095059 & 0.6654 & 0.254452 \tabularnewline
22 & -0.009701 & -0.0679 & 0.473067 \tabularnewline
23 & 0.058266 & 0.4079 & 0.342577 \tabularnewline
24 & -0.14462 & -1.0123 & 0.158175 \tabularnewline
25 & -0.09605 & -0.6724 & 0.252259 \tabularnewline
26 & -0.045749 & -0.3202 & 0.375072 \tabularnewline
27 & 0.10054 & 0.7038 & 0.242451 \tabularnewline
28 & 0.137443 & 0.9621 & 0.170362 \tabularnewline
29 & -0.110789 & -0.7755 & 0.220879 \tabularnewline
30 & -0.093478 & -0.6543 & 0.257974 \tabularnewline
31 & 0.076843 & 0.5379 & 0.29654 \tabularnewline
32 & -0.112776 & -0.7894 & 0.216831 \tabularnewline
33 & 0.053904 & 0.3773 & 0.35378 \tabularnewline
34 & -0.017867 & -0.1251 & 0.45049 \tabularnewline
35 & 0.071174 & 0.4982 & 0.310281 \tabularnewline
36 & 0.003909 & 0.0274 & 0.489139 \tabularnewline
37 & -0.065372 & -0.4576 & 0.32463 \tabularnewline
38 & 0.05109 & 0.3576 & 0.361078 \tabularnewline
39 & 0.097834 & 0.6848 & 0.248336 \tabularnewline
40 & 0.126383 & 0.8847 & 0.190325 \tabularnewline
41 & -0.031857 & -0.223 & 0.412233 \tabularnewline
42 & -0.014198 & -0.0994 & 0.460618 \tabularnewline
43 & -0.04444 & -0.3111 & 0.37853 \tabularnewline
44 & 0.019278 & 0.1349 & 0.446603 \tabularnewline
45 & -0.065315 & -0.4572 & 0.324773 \tabularnewline
46 & -0.062176 & -0.4352 & 0.332653 \tabularnewline
47 & 0.098712 & 0.691 & 0.246418 \tabularnewline
48 & -0.032829 & -0.2298 & 0.409601 \tabularnewline
49 & NA & NA & NA \tabularnewline
50 & NA & NA & NA \tabularnewline
51 & NA & NA & NA \tabularnewline
52 & NA & NA & NA \tabularnewline
53 & NA & NA & NA \tabularnewline
54 & NA & NA & NA \tabularnewline
55 & NA & NA & NA \tabularnewline
56 & NA & NA & NA \tabularnewline
57 & NA & NA & NA \tabularnewline
58 & NA & NA & NA \tabularnewline
59 & NA & NA & NA \tabularnewline
60 & NA & NA & NA \tabularnewline
\hline
\end{tabular}
%Source: https://freestatistics.org/blog/index.php?pk=31654&T=2

[TABLE]
[ROW][C]Partial Autocorrelation Function[/C][/ROW]
[ROW][C]Time lag k[/C][C]PACF(k)[/C][C]T-STAT[/C][C]P-value[/C][/ROW]
[ROW][C]1[/C][C]-0.036298[/C][C]-0.2541[/C][C]0.400245[/C][/ROW]
[ROW][C]2[/C][C]0.096563[/C][C]0.6759[/C][C]0.251128[/C][/ROW]
[ROW][C]3[/C][C]0.27588[/C][C]1.9312[/C][C]0.029629[/C][/ROW]
[ROW][C]4[/C][C]-0.171892[/C][C]-1.2032[/C][C]0.117332[/C][/ROW]
[ROW][C]5[/C][C]0.047704[/C][C]0.3339[/C][C]0.36993[/C][/ROW]
[ROW][C]6[/C][C]0.015374[/C][C]0.1076[/C][C]0.457369[/C][/ROW]
[ROW][C]7[/C][C]-0.252777[/C][C]-1.7694[/C][C]0.041522[/C][/ROW]
[ROW][C]8[/C][C]-0.279311[/C][C]-1.9552[/C][C]0.028139[/C][/ROW]
[ROW][C]9[/C][C]0.105557[/C][C]0.7389[/C][C]0.231747[/C][/ROW]
[ROW][C]10[/C][C]-0.123598[/C][C]-0.8652[/C][C]0.195576[/C][/ROW]
[ROW][C]11[/C][C]-0.218733[/C][C]-1.5311[/C][C]0.066084[/C][/ROW]
[ROW][C]12[/C][C]-0.201145[/C][C]-1.408[/C][C]0.08272[/C][/ROW]
[ROW][C]13[/C][C]-0.177118[/C][C]-1.2398[/C][C]0.110472[/C][/ROW]
[ROW][C]14[/C][C]0.008664[/C][C]0.0606[/C][C]0.475943[/C][/ROW]
[ROW][C]15[/C][C]0.069468[/C][C]0.4863[/C][C]0.314469[/C][/ROW]
[ROW][C]16[/C][C]-0.130399[/C][C]-0.9128[/C][C]0.182911[/C][/ROW]
[ROW][C]17[/C][C]0.011615[/C][C]0.0813[/C][C]0.467767[/C][/ROW]
[ROW][C]18[/C][C]-0.039604[/C][C]-0.2772[/C][C]0.391385[/C][/ROW]
[ROW][C]19[/C][C]-0.201566[/C][C]-1.411[/C][C]0.082287[/C][/ROW]
[ROW][C]20[/C][C]-0.162243[/C][C]-1.1357[/C][C]0.130803[/C][/ROW]
[ROW][C]21[/C][C]0.095059[/C][C]0.6654[/C][C]0.254452[/C][/ROW]
[ROW][C]22[/C][C]-0.009701[/C][C]-0.0679[/C][C]0.473067[/C][/ROW]
[ROW][C]23[/C][C]0.058266[/C][C]0.4079[/C][C]0.342577[/C][/ROW]
[ROW][C]24[/C][C]-0.14462[/C][C]-1.0123[/C][C]0.158175[/C][/ROW]
[ROW][C]25[/C][C]-0.09605[/C][C]-0.6724[/C][C]0.252259[/C][/ROW]
[ROW][C]26[/C][C]-0.045749[/C][C]-0.3202[/C][C]0.375072[/C][/ROW]
[ROW][C]27[/C][C]0.10054[/C][C]0.7038[/C][C]0.242451[/C][/ROW]
[ROW][C]28[/C][C]0.137443[/C][C]0.9621[/C][C]0.170362[/C][/ROW]
[ROW][C]29[/C][C]-0.110789[/C][C]-0.7755[/C][C]0.220879[/C][/ROW]
[ROW][C]30[/C][C]-0.093478[/C][C]-0.6543[/C][C]0.257974[/C][/ROW]
[ROW][C]31[/C][C]0.076843[/C][C]0.5379[/C][C]0.29654[/C][/ROW]
[ROW][C]32[/C][C]-0.112776[/C][C]-0.7894[/C][C]0.216831[/C][/ROW]
[ROW][C]33[/C][C]0.053904[/C][C]0.3773[/C][C]0.35378[/C][/ROW]
[ROW][C]34[/C][C]-0.017867[/C][C]-0.1251[/C][C]0.45049[/C][/ROW]
[ROW][C]35[/C][C]0.071174[/C][C]0.4982[/C][C]0.310281[/C][/ROW]
[ROW][C]36[/C][C]0.003909[/C][C]0.0274[/C][C]0.489139[/C][/ROW]
[ROW][C]37[/C][C]-0.065372[/C][C]-0.4576[/C][C]0.32463[/C][/ROW]
[ROW][C]38[/C][C]0.05109[/C][C]0.3576[/C][C]0.361078[/C][/ROW]
[ROW][C]39[/C][C]0.097834[/C][C]0.6848[/C][C]0.248336[/C][/ROW]
[ROW][C]40[/C][C]0.126383[/C][C]0.8847[/C][C]0.190325[/C][/ROW]
[ROW][C]41[/C][C]-0.031857[/C][C]-0.223[/C][C]0.412233[/C][/ROW]
[ROW][C]42[/C][C]-0.014198[/C][C]-0.0994[/C][C]0.460618[/C][/ROW]
[ROW][C]43[/C][C]-0.04444[/C][C]-0.3111[/C][C]0.37853[/C][/ROW]
[ROW][C]44[/C][C]0.019278[/C][C]0.1349[/C][C]0.446603[/C][/ROW]
[ROW][C]45[/C][C]-0.065315[/C][C]-0.4572[/C][C]0.324773[/C][/ROW]
[ROW][C]46[/C][C]-0.062176[/C][C]-0.4352[/C][C]0.332653[/C][/ROW]
[ROW][C]47[/C][C]0.098712[/C][C]0.691[/C][C]0.246418[/C][/ROW]
[ROW][C]48[/C][C]-0.032829[/C][C]-0.2298[/C][C]0.409601[/C][/ROW]
[ROW][C]49[/C][C]NA[/C][C]NA[/C][C]NA[/C][/ROW]
[ROW][C]50[/C][C]NA[/C][C]NA[/C][C]NA[/C][/ROW]
[ROW][C]51[/C][C]NA[/C][C]NA[/C][C]NA[/C][/ROW]
[ROW][C]52[/C][C]NA[/C][C]NA[/C][C]NA[/C][/ROW]
[ROW][C]53[/C][C]NA[/C][C]NA[/C][C]NA[/C][/ROW]
[ROW][C]54[/C][C]NA[/C][C]NA[/C][C]NA[/C][/ROW]
[ROW][C]55[/C][C]NA[/C][C]NA[/C][C]NA[/C][/ROW]
[ROW][C]56[/C][C]NA[/C][C]NA[/C][C]NA[/C][/ROW]
[ROW][C]57[/C][C]NA[/C][C]NA[/C][C]NA[/C][/ROW]
[ROW][C]58[/C][C]NA[/C][C]NA[/C][C]NA[/C][/ROW]
[ROW][C]59[/C][C]NA[/C][C]NA[/C][C]NA[/C][/ROW]
[ROW][C]60[/C][C]NA[/C][C]NA[/C][C]NA[/C][/ROW]
[/TABLE]
Source: https://freestatistics.org/blog/index.php?pk=31654&T=2

Globally Unique Identifier (entire table): ba.freestatistics.org/blog/index.php?pk=31654&T=2

As an alternative you can also use a QR Code:  

The GUIDs for individual cells are displayed in the table below:

Partial Autocorrelation Function
Time lag kPACF(k)T-STATP-value
1-0.036298-0.25410.400245
20.0965630.67590.251128
30.275881.93120.029629
4-0.171892-1.20320.117332
50.0477040.33390.36993
60.0153740.10760.457369
7-0.252777-1.76940.041522
8-0.279311-1.95520.028139
90.1055570.73890.231747
10-0.123598-0.86520.195576
11-0.218733-1.53110.066084
12-0.201145-1.4080.08272
13-0.177118-1.23980.110472
140.0086640.06060.475943
150.0694680.48630.314469
16-0.130399-0.91280.182911
170.0116150.08130.467767
18-0.039604-0.27720.391385
19-0.201566-1.4110.082287
20-0.162243-1.13570.130803
210.0950590.66540.254452
22-0.009701-0.06790.473067
230.0582660.40790.342577
24-0.14462-1.01230.158175
25-0.09605-0.67240.252259
26-0.045749-0.32020.375072
270.100540.70380.242451
280.1374430.96210.170362
29-0.110789-0.77550.220879
30-0.093478-0.65430.257974
310.0768430.53790.29654
32-0.112776-0.78940.216831
330.0539040.37730.35378
34-0.017867-0.12510.45049
350.0711740.49820.310281
360.0039090.02740.489139
37-0.065372-0.45760.32463
380.051090.35760.361078
390.0978340.68480.248336
400.1263830.88470.190325
41-0.031857-0.2230.412233
42-0.014198-0.09940.460618
43-0.04444-0.31110.37853
440.0192780.13490.446603
45-0.065315-0.45720.324773
46-0.062176-0.43520.332653
470.0987120.6910.246418
48-0.032829-0.22980.409601
49NANANA
50NANANA
51NANANA
52NANANA
53NANANA
54NANANA
55NANANA
56NANANA
57NANANA
58NANANA
59NANANA
60NANANA


Parameters (Session):
par1 = 60 ; par2 = 1 ; par3 = 0 ; par4 = 1 ; par5 = 12 ;
Parameters (R input):
par1 = 60 ; par2 = 1 ; par3 = 0 ; par4 = 1 ; par5 = 12 ;
R code (references can be found in the software module):
if (par1 == 'Default') {
par1 = 10*log10(length(x))
} else {
par1 <- as.numeric(par1)
}
par2 <- as.numeric(par2)
par3 <- as.numeric(par3)
par4 <- as.numeric(par4)
par5 <- as.numeric(par5)
if (par2 == 0) {
x <- log(x)
} else {
x <- (x ^ par2 - 1) / par2
}
if (par3 > 0) x <- diff(x,lag=1,difference=par3)
if (par4 > 0) x <- diff(x,lag=par5,difference=par4)
bitmap(file='pic1.png')
racf <- acf(x,par1,main='Autocorrelation',xlab='lags',ylab='ACF')
dev.off()
bitmap(file='pic2.png')
rpacf <- pacf(x,par1,main='Partial Autocorrelation',xlab='lags',ylab='PACF')
dev.off()
(myacf <- c(racf$acf))
(mypacf <- c(rpacf$acf))
lengthx <- length(x)
sqrtn <- sqrt(lengthx)
load(file='createtable')
a<-table.start()
a<-table.row.start(a)
a<-table.element(a,'Autocorrelation Function',4,TRUE)
a<-table.row.end(a)
a<-table.row.start(a)
a<-table.element(a,'Time lag k',header=TRUE)
a<-table.element(a,hyperlink('basics.htm','ACF(k)','click here for more information about the Autocorrelation Function'),header=TRUE)
a<-table.element(a,'T-STAT',header=TRUE)
a<-table.element(a,'P-value',header=TRUE)
a<-table.row.end(a)
for (i in 2:(par1+1)) {
a<-table.row.start(a)
a<-table.element(a,i-1,header=TRUE)
a<-table.element(a,round(myacf[i],6))
mytstat <- myacf[i]*sqrtn
a<-table.element(a,round(mytstat,4))
a<-table.element(a,round(1-pt(abs(mytstat),lengthx),6))
a<-table.row.end(a)
}
a<-table.end(a)
table.save(a,file='mytable.tab')
a<-table.start()
a<-table.row.start(a)
a<-table.element(a,'Partial Autocorrelation Function',4,TRUE)
a<-table.row.end(a)
a<-table.row.start(a)
a<-table.element(a,'Time lag k',header=TRUE)
a<-table.element(a,hyperlink('basics.htm','PACF(k)','click here for more information about the Partial Autocorrelation Function'),header=TRUE)
a<-table.element(a,'T-STAT',header=TRUE)
a<-table.element(a,'P-value',header=TRUE)
a<-table.row.end(a)
for (i in 1:par1) {
a<-table.row.start(a)
a<-table.element(a,i,header=TRUE)
a<-table.element(a,round(mypacf[i],6))
mytstat <- mypacf[i]*sqrtn
a<-table.element(a,round(mytstat,4))
a<-table.element(a,round(1-pt(abs(mytstat),lengthx),6))
a<-table.row.end(a)
}
a<-table.end(a)
table.save(a,file='mytable1.tab')