Free Statistics

of Irreproducible Research!

Author's title

Author*Unverified author*
R Software Modulerwasp_spectrum.wasp
Title produced by softwareSpectral Analysis
Date of computationTue, 09 Dec 2008 10:36:18 -0700
Cite this page as followsStatistical Computations at FreeStatistics.org, Office for Research Development and Education, URL https://freestatistics.org/blog/index.php?v=date/2008/Dec/09/t1228844218yynzgxde35usd86.htm/, Retrieved Sun, 19 May 2024 10:08:42 +0000
Statistical Computations at FreeStatistics.org, Office for Research Development and Education, URL https://freestatistics.org/blog/index.php?pk=31618, Retrieved Sun, 19 May 2024 10:08:42 +0000
QR Codes:

Original text written by user:
IsPrivate?No (this computation is public)
User-defined keywords
Estimated Impact131
Family? (F = Feedback message, R = changed R code, M = changed R Module, P = changed Parameters, D = changed Data)
F       [Spectral Analysis] [Toon Wouters] [2008-12-09 17:36:18] [14e94996a4178d938cb12bed20a4a373] [Current]
Feedback Forum
2008-12-15 18:51:16 [Steven Vercammen] [reply
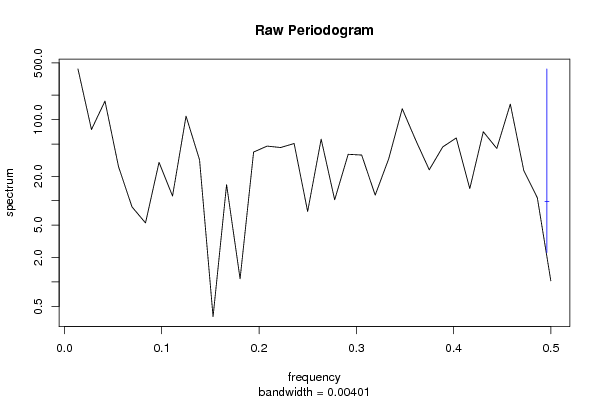
Dit is correct. Spectraalanalyse wordt gebruikt om willekeurige tijdreeksen te ontbinden in regelmatige golfbewegingen. Een lange termijntrend betekent dat er sprake is van een lange periode en een trage frequentie. Het spectrum geeft de intensiteit van een golfperiode aan, maw hoe belangrijk is deze golfbeweging. We zien hier dat de waarden allemaal zeer laag zijn. Wanneer er nog een lange termijn trend in de reeks aanwezig zou zijn dan zouden we zeer hoge waarde zien bij de lange periodes, dit is echter niet het geval. Er zijn ook geen hoge waarden te vinden bij periodes 6,12, 24,… wat er op wijst dat er ook geen seizonaliteit aanwezig is in de tijdreeks.
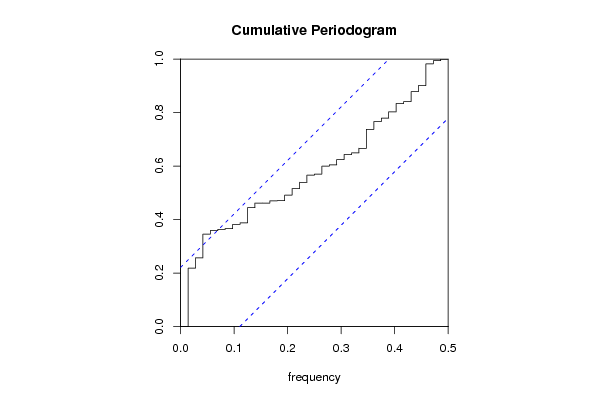
Op het raw en cumulative periodogram zien we ook geen aanwijzingen meer dat de tijdreeks niet stationair zou zijn. Er zijn maw geen indicaties voor een lange termijn trend of seizonaliteit.


Post a new message
Dataseries X:
94
118.6
135
132.7
110.1
111
159.4
129.9
124.8
140.5
120.6
121.6
107.3
130.7
134.9
128.3
99.8
96.7
134.1
131.6
118
133.2
109.3
111.9
98.3
116.3
113.6
121.3
93.7
92.3
132
114.3
123.1
117.3
106
107.5
104.3
112.6
113.9
132.8
88.8
97.7
131.2
116.1
124.7
128.2
105
102.3
98.4
111.1
125.3
123.6
86.7
100.6
123.3
112.2
120.8
114.8
107.3
107.5
93.1
112.4
127.9
120.7
91
98.5
118.9
113.8
113.8
118.7
105.1
101.4
84.1
107.2
119.9
105.4
88.6
90.5
108.5
104.7
100
113.1
96.7
98.5


Summary of computational transaction
Raw Inputview raw input (R code)
Raw Outputview raw output of R engine
Computing time2 seconds
R Server'Sir Ronald Aylmer Fisher' @ 193.190.124.24

\begin{tabular}{lllllllll}
\hline
Summary of computational transaction \tabularnewline
Raw Input & view raw input (R code)  \tabularnewline
Raw Output & view raw output of R engine  \tabularnewline
Computing time & 2 seconds \tabularnewline
R Server & 'Sir Ronald Aylmer Fisher' @ 193.190.124.24 \tabularnewline
\hline
\end{tabular}
%Source: https://freestatistics.org/blog/index.php?pk=31618&T=0

[TABLE]
[ROW][C]Summary of computational transaction[/C][/ROW]
[ROW][C]Raw Input[/C][C]view raw input (R code) [/C][/ROW]
[ROW][C]Raw Output[/C][C]view raw output of R engine [/C][/ROW]
[ROW][C]Computing time[/C][C]2 seconds[/C][/ROW]
[ROW][C]R Server[/C][C]'Sir Ronald Aylmer Fisher' @ 193.190.124.24[/C][/ROW]
[/TABLE]
Source: https://freestatistics.org/blog/index.php?pk=31618&T=0

Globally Unique Identifier (entire table): ba.freestatistics.org/blog/index.php?pk=31618&T=0

As an alternative you can also use a QR Code:  

The GUIDs for individual cells are displayed in the table below:

Summary of computational transaction
Raw Inputview raw input (R code)
Raw Outputview raw output of R engine
Computing time2 seconds
R Server'Sir Ronald Aylmer Fisher' @ 193.190.124.24


Raw Periodogram
ParameterValue
Box-Cox transformation parameter (lambda)1
Degree of non-seasonal differencing (d)0
Degree of seasonal differencing (D)1
Seasonal Period (s)12
Frequency (Period)Spectrum
0.0139 (72)420.978254
0.0278 (36)75.454533
0.0417 (24)169.173479
0.0556 (18)26.381099
0.0694 (14.4)8.394154
0.0833 (12)5.325382
0.0972 (10.2857)29.730698
0.1111 (9)11.429221
0.125 (8)110.328652
0.1389 (7.2)31.847757
0.1528 (6.5455)0.372536
0.1667 (6)15.780973
0.1806 (5.5385)1.090437
0.1944 (5.1429)39.786665
0.2083 (4.8)47.132746
0.2222 (4.5)45.263777
0.2361 (4.2353)50.712896
0.25 (4)7.364523
0.2639 (3.7895)57.43044
0.2778 (3.6)10.271468
0.2917 (3.4286)37.358939
0.3056 (3.2727)36.5454
0.3194 (3.1304)11.717553
0.3333 (3)32.909787
0.3472 (2.88)136.031926
0.3611 (2.7692)55.753292
0.375 (2.6667)24.056349
0.3889 (2.5714)46.091732
0.4028 (2.4828)59.348735
0.4167 (2.4)14.081638
0.4306 (2.3226)70.834586
0.4444 (2.25)44.078405
0.4583 (2.1818)155.465307
0.4722 (2.1176)23.452672
0.4861 (2.0571)10.877267
0.5 (2)1.02736

\begin{tabular}{lllllllll}
\hline
Raw Periodogram \tabularnewline
Parameter & Value \tabularnewline
Box-Cox transformation parameter (lambda) & 1 \tabularnewline
Degree of non-seasonal differencing (d) & 0 \tabularnewline
Degree of seasonal differencing (D) & 1 \tabularnewline
Seasonal Period (s) & 12 \tabularnewline
Frequency (Period) & Spectrum \tabularnewline
0.0139 (72) & 420.978254 \tabularnewline
0.0278 (36) & 75.454533 \tabularnewline
0.0417 (24) & 169.173479 \tabularnewline
0.0556 (18) & 26.381099 \tabularnewline
0.0694 (14.4) & 8.394154 \tabularnewline
0.0833 (12) & 5.325382 \tabularnewline
0.0972 (10.2857) & 29.730698 \tabularnewline
0.1111 (9) & 11.429221 \tabularnewline
0.125 (8) & 110.328652 \tabularnewline
0.1389 (7.2) & 31.847757 \tabularnewline
0.1528 (6.5455) & 0.372536 \tabularnewline
0.1667 (6) & 15.780973 \tabularnewline
0.1806 (5.5385) & 1.090437 \tabularnewline
0.1944 (5.1429) & 39.786665 \tabularnewline
0.2083 (4.8) & 47.132746 \tabularnewline
0.2222 (4.5) & 45.263777 \tabularnewline
0.2361 (4.2353) & 50.712896 \tabularnewline
0.25 (4) & 7.364523 \tabularnewline
0.2639 (3.7895) & 57.43044 \tabularnewline
0.2778 (3.6) & 10.271468 \tabularnewline
0.2917 (3.4286) & 37.358939 \tabularnewline
0.3056 (3.2727) & 36.5454 \tabularnewline
0.3194 (3.1304) & 11.717553 \tabularnewline
0.3333 (3) & 32.909787 \tabularnewline
0.3472 (2.88) & 136.031926 \tabularnewline
0.3611 (2.7692) & 55.753292 \tabularnewline
0.375 (2.6667) & 24.056349 \tabularnewline
0.3889 (2.5714) & 46.091732 \tabularnewline
0.4028 (2.4828) & 59.348735 \tabularnewline
0.4167 (2.4) & 14.081638 \tabularnewline
0.4306 (2.3226) & 70.834586 \tabularnewline
0.4444 (2.25) & 44.078405 \tabularnewline
0.4583 (2.1818) & 155.465307 \tabularnewline
0.4722 (2.1176) & 23.452672 \tabularnewline
0.4861 (2.0571) & 10.877267 \tabularnewline
0.5 (2) & 1.02736 \tabularnewline
\hline
\end{tabular}
%Source: https://freestatistics.org/blog/index.php?pk=31618&T=1

[TABLE]
[ROW][C]Raw Periodogram[/C][/ROW]
[ROW][C]Parameter[/C][C]Value[/C][/ROW]
[ROW][C]Box-Cox transformation parameter (lambda)[/C][C]1[/C][/ROW]
[ROW][C]Degree of non-seasonal differencing (d)[/C][C]0[/C][/ROW]
[ROW][C]Degree of seasonal differencing (D)[/C][C]1[/C][/ROW]
[ROW][C]Seasonal Period (s)[/C][C]12[/C][/ROW]
[ROW][C]Frequency (Period)[/C][C]Spectrum[/C][/ROW]
[ROW][C]0.0139 (72)[/C][C]420.978254[/C][/ROW]
[ROW][C]0.0278 (36)[/C][C]75.454533[/C][/ROW]
[ROW][C]0.0417 (24)[/C][C]169.173479[/C][/ROW]
[ROW][C]0.0556 (18)[/C][C]26.381099[/C][/ROW]
[ROW][C]0.0694 (14.4)[/C][C]8.394154[/C][/ROW]
[ROW][C]0.0833 (12)[/C][C]5.325382[/C][/ROW]
[ROW][C]0.0972 (10.2857)[/C][C]29.730698[/C][/ROW]
[ROW][C]0.1111 (9)[/C][C]11.429221[/C][/ROW]
[ROW][C]0.125 (8)[/C][C]110.328652[/C][/ROW]
[ROW][C]0.1389 (7.2)[/C][C]31.847757[/C][/ROW]
[ROW][C]0.1528 (6.5455)[/C][C]0.372536[/C][/ROW]
[ROW][C]0.1667 (6)[/C][C]15.780973[/C][/ROW]
[ROW][C]0.1806 (5.5385)[/C][C]1.090437[/C][/ROW]
[ROW][C]0.1944 (5.1429)[/C][C]39.786665[/C][/ROW]
[ROW][C]0.2083 (4.8)[/C][C]47.132746[/C][/ROW]
[ROW][C]0.2222 (4.5)[/C][C]45.263777[/C][/ROW]
[ROW][C]0.2361 (4.2353)[/C][C]50.712896[/C][/ROW]
[ROW][C]0.25 (4)[/C][C]7.364523[/C][/ROW]
[ROW][C]0.2639 (3.7895)[/C][C]57.43044[/C][/ROW]
[ROW][C]0.2778 (3.6)[/C][C]10.271468[/C][/ROW]
[ROW][C]0.2917 (3.4286)[/C][C]37.358939[/C][/ROW]
[ROW][C]0.3056 (3.2727)[/C][C]36.5454[/C][/ROW]
[ROW][C]0.3194 (3.1304)[/C][C]11.717553[/C][/ROW]
[ROW][C]0.3333 (3)[/C][C]32.909787[/C][/ROW]
[ROW][C]0.3472 (2.88)[/C][C]136.031926[/C][/ROW]
[ROW][C]0.3611 (2.7692)[/C][C]55.753292[/C][/ROW]
[ROW][C]0.375 (2.6667)[/C][C]24.056349[/C][/ROW]
[ROW][C]0.3889 (2.5714)[/C][C]46.091732[/C][/ROW]
[ROW][C]0.4028 (2.4828)[/C][C]59.348735[/C][/ROW]
[ROW][C]0.4167 (2.4)[/C][C]14.081638[/C][/ROW]
[ROW][C]0.4306 (2.3226)[/C][C]70.834586[/C][/ROW]
[ROW][C]0.4444 (2.25)[/C][C]44.078405[/C][/ROW]
[ROW][C]0.4583 (2.1818)[/C][C]155.465307[/C][/ROW]
[ROW][C]0.4722 (2.1176)[/C][C]23.452672[/C][/ROW]
[ROW][C]0.4861 (2.0571)[/C][C]10.877267[/C][/ROW]
[ROW][C]0.5 (2)[/C][C]1.02736[/C][/ROW]
[/TABLE]
Source: https://freestatistics.org/blog/index.php?pk=31618&T=1

Globally Unique Identifier (entire table): ba.freestatistics.org/blog/index.php?pk=31618&T=1

As an alternative you can also use a QR Code:  

The GUIDs for individual cells are displayed in the table below:

Raw Periodogram
ParameterValue
Box-Cox transformation parameter (lambda)1
Degree of non-seasonal differencing (d)0
Degree of seasonal differencing (D)1
Seasonal Period (s)12
Frequency (Period)Spectrum
0.0139 (72)420.978254
0.0278 (36)75.454533
0.0417 (24)169.173479
0.0556 (18)26.381099
0.0694 (14.4)8.394154
0.0833 (12)5.325382
0.0972 (10.2857)29.730698
0.1111 (9)11.429221
0.125 (8)110.328652
0.1389 (7.2)31.847757
0.1528 (6.5455)0.372536
0.1667 (6)15.780973
0.1806 (5.5385)1.090437
0.1944 (5.1429)39.786665
0.2083 (4.8)47.132746
0.2222 (4.5)45.263777
0.2361 (4.2353)50.712896
0.25 (4)7.364523
0.2639 (3.7895)57.43044
0.2778 (3.6)10.271468
0.2917 (3.4286)37.358939
0.3056 (3.2727)36.5454
0.3194 (3.1304)11.717553
0.3333 (3)32.909787
0.3472 (2.88)136.031926
0.3611 (2.7692)55.753292
0.375 (2.6667)24.056349
0.3889 (2.5714)46.091732
0.4028 (2.4828)59.348735
0.4167 (2.4)14.081638
0.4306 (2.3226)70.834586
0.4444 (2.25)44.078405
0.4583 (2.1818)155.465307
0.4722 (2.1176)23.452672
0.4861 (2.0571)10.877267
0.5 (2)1.02736


Parameters (Session):
par1 = 1 ; par2 = 0 ; par3 = 1 ; par4 = 12 ;
Parameters (R input):
par1 = 1 ; par2 = 0 ; par3 = 1 ; par4 = 12 ;
R code (references can be found in the software module):
par1 <- as.numeric(par1)
par2 <- as.numeric(par2)
par3 <- as.numeric(par3)
par4 <- as.numeric(par4)
if (par1 == 0) {
x <- log(x)
} else {
x <- (x ^ par1 - 1) / par1
}
if (par2 > 0) x <- diff(x,lag=1,difference=par2)
if (par3 > 0) x <- diff(x,lag=par4,difference=par3)
bitmap(file='test1.png')
r <- spectrum(x,main='Raw Periodogram')
dev.off()
bitmap(file='test2.png')
cpgram(x,main='Cumulative Periodogram')
dev.off()
load(file='createtable')
a<-table.start()
a<-table.row.start(a)
a<-table.element(a,'Raw Periodogram',2,TRUE)
a<-table.row.end(a)
a<-table.row.start(a)
a<-table.element(a,'Parameter',header=TRUE)
a<-table.element(a,'Value',header=TRUE)
a<-table.row.end(a)
a<-table.row.start(a)
a<-table.element(a,'Box-Cox transformation parameter (lambda)',header=TRUE)
a<-table.element(a,par1)
a<-table.row.end(a)
a<-table.row.start(a)
a<-table.element(a,'Degree of non-seasonal differencing (d)',header=TRUE)
a<-table.element(a,par2)
a<-table.row.end(a)
a<-table.row.start(a)
a<-table.element(a,'Degree of seasonal differencing (D)',header=TRUE)
a<-table.element(a,par3)
a<-table.row.end(a)
a<-table.row.start(a)
a<-table.element(a,'Seasonal Period (s)',header=TRUE)
a<-table.element(a,par4)
a<-table.row.end(a)
a<-table.row.start(a)
a<-table.element(a,'Frequency (Period)',header=TRUE)
a<-table.element(a,'Spectrum',header=TRUE)
a<-table.row.end(a)
for (i in 1:length(r$freq)) {
a<-table.row.start(a)
mylab <- round(r$freq[i],4)
mylab <- paste(mylab,' (',sep='')
mylab <- paste(mylab,round(1/r$freq[i],4),sep='')
mylab <- paste(mylab,')',sep='')
a<-table.element(a,mylab,header=TRUE)
a<-table.element(a,round(r$spec[i],6))
a<-table.row.end(a)
}
a<-table.end(a)
table.save(a,file='mytable.tab')