Free Statistics

of Irreproducible Research!

Author's title

Author*Unverified author*
R Software Modulerwasp_autocorrelation.wasp
Title produced by software(Partial) Autocorrelation Function
Date of computationTue, 09 Dec 2008 10:32:59 -0700
Cite this page as followsStatistical Computations at FreeStatistics.org, Office for Research Development and Education, URL https://freestatistics.org/blog/index.php?v=date/2008/Dec/09/t1228844017gxiw6ud1r0lx9vv.htm/, Retrieved Sun, 19 May 2024 10:48:20 +0000
Statistical Computations at FreeStatistics.org, Office for Research Development and Education, URL https://freestatistics.org/blog/index.php?pk=31614, Retrieved Sun, 19 May 2024 10:48:20 +0000
QR Codes:

Original text written by user:
IsPrivate?No (this computation is public)
User-defined keywords
Estimated Impact134
Family? (F = Feedback message, R = changed R code, M = changed R Module, P = changed Parameters, D = changed Data)
F       [(Partial) Autocorrelation Function] [Toon Wouters] [2008-12-09 17:32:59] [14e94996a4178d938cb12bed20a4a373] [Current]
Feedback Forum
2008-12-15 18:50:20 [Steven Vercammen] [reply
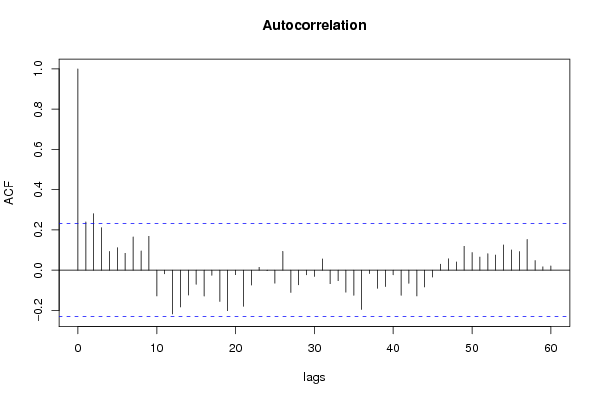
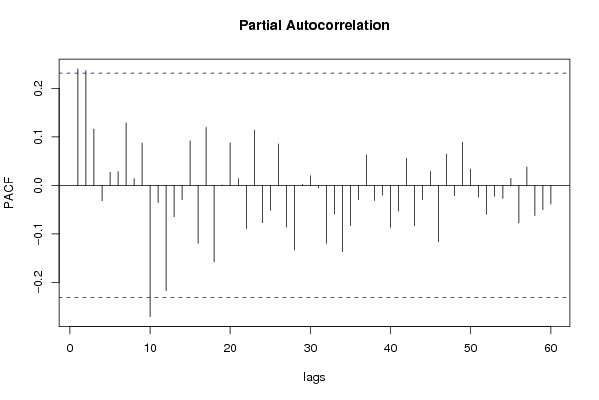
Dit klopt we zien dat dat de seizonaliteit verdwenen is.
2008-12-15 18:54:18 [Steven Vercammen] [reply
STEP 4: wordt volledig correct uitgewerkt en geïnterpreteerd.

Post a new message
Dataseries X:
94
118.6
135
132.7
110.1
111
159.4
129.9
124.8
140.5
120.6
121.6
107.3
130.7
134.9
128.3
99.8
96.7
134.1
131.6
118
133.2
109.3
111.9
98.3
116.3
113.6
121.3
93.7
92.3
132
114.3
123.1
117.3
106
107.5
104.3
112.6
113.9
132.8
88.8
97.7
131.2
116.1
124.7
128.2
105
102.3
98.4
111.1
125.3
123.6
86.7
100.6
123.3
112.2
120.8
114.8
107.3
107.5
93.1
112.4
127.9
120.7
91
98.5
118.9
113.8
113.8
118.7
105.1
101.4
84.1
107.2
119.9
105.4
88.6
90.5
108.5
104.7
100
113.1
96.7
98.5


Summary of computational transaction
Raw Inputview raw input (R code)
Raw Outputview raw output of R engine
Computing time4 seconds
R Server'Herman Ole Andreas Wold' @ 193.190.124.10:1001

\begin{tabular}{lllllllll}
\hline
Summary of computational transaction \tabularnewline
Raw Input & view raw input (R code)  \tabularnewline
Raw Output & view raw output of R engine  \tabularnewline
Computing time & 4 seconds \tabularnewline
R Server & 'Herman Ole Andreas Wold' @ 193.190.124.10:1001 \tabularnewline
\hline
\end{tabular}
%Source: https://freestatistics.org/blog/index.php?pk=31614&T=0

[TABLE]
[ROW][C]Summary of computational transaction[/C][/ROW]
[ROW][C]Raw Input[/C][C]view raw input (R code) [/C][/ROW]
[ROW][C]Raw Output[/C][C]view raw output of R engine [/C][/ROW]
[ROW][C]Computing time[/C][C]4 seconds[/C][/ROW]
[ROW][C]R Server[/C][C]'Herman Ole Andreas Wold' @ 193.190.124.10:1001[/C][/ROW]
[/TABLE]
Source: https://freestatistics.org/blog/index.php?pk=31614&T=0

Globally Unique Identifier (entire table): ba.freestatistics.org/blog/index.php?pk=31614&T=0

As an alternative you can also use a QR Code:  

The GUIDs for individual cells are displayed in the table below:

Summary of computational transaction
Raw Inputview raw input (R code)
Raw Outputview raw output of R engine
Computing time4 seconds
R Server'Herman Ole Andreas Wold' @ 193.190.124.10:1001


Autocorrelation Function
Time lag kACF(k)T-STATP-value
10.2398382.03510.022762
20.2805342.38040.009971
30.2111811.79190.038673
40.0931850.79070.215858
50.1116470.94740.173313
60.0836590.70990.240039
70.1650761.40070.082797
80.0955130.81050.210176
90.1682251.42740.078888
10-0.128282-1.08850.140001
11-0.018039-0.15310.439389
12-0.217266-1.84360.034681
13-0.182403-1.54770.063035
14-0.123714-1.04980.148672
15-0.070507-0.59830.275767
16-0.128384-1.08940.139812
17-0.025439-0.21590.414855
18-0.155568-1.320.095502
19-0.201495-1.70970.04581
20-0.022429-0.19030.424798
21-0.179415-1.52240.066147
22-0.073992-0.62780.266046
230.0144570.12270.451353
24-0.002872-0.02440.490313
25-0.06448-0.54710.292991
260.0934180.79270.215284
27-0.110532-0.93790.175718
28-0.072927-0.61880.268999
29-0.022929-0.19460.423144
30-0.030891-0.26210.39699
310.0560470.47560.317907
32-0.067457-0.57240.284419
33-0.051982-0.44110.330238
34-0.109468-0.92890.17803
35-0.124667-1.05780.146833
36-0.195413-1.65810.050821
37-0.016787-0.14240.443564
38-0.090381-0.76690.222822
39-0.081451-0.69110.245853
40-0.022949-0.19470.423077
41-0.124928-1.06010.146332
42-0.065602-0.55670.289746
43-0.12829-1.08860.139985
44-0.08334-0.70720.240874
45-0.034506-0.29280.385262
460.0295450.25070.401381
470.0564820.47930.316601
480.0407520.34580.365252
490.1187631.00770.158478
500.0873180.74090.230577
510.065450.55540.290184
520.0819860.69570.244435
530.0749680.63610.263357
540.1256091.06580.145032
550.1007420.85480.197742
560.0926770.78640.21711
570.1528361.29690.099411
580.0479990.40730.342504
590.0166930.14160.443879
600.0210660.17870.429319

\begin{tabular}{lllllllll}
\hline
Autocorrelation Function \tabularnewline
Time lag k & ACF(k) & T-STAT & P-value \tabularnewline
1 & 0.239838 & 2.0351 & 0.022762 \tabularnewline
2 & 0.280534 & 2.3804 & 0.009971 \tabularnewline
3 & 0.211181 & 1.7919 & 0.038673 \tabularnewline
4 & 0.093185 & 0.7907 & 0.215858 \tabularnewline
5 & 0.111647 & 0.9474 & 0.173313 \tabularnewline
6 & 0.083659 & 0.7099 & 0.240039 \tabularnewline
7 & 0.165076 & 1.4007 & 0.082797 \tabularnewline
8 & 0.095513 & 0.8105 & 0.210176 \tabularnewline
9 & 0.168225 & 1.4274 & 0.078888 \tabularnewline
10 & -0.128282 & -1.0885 & 0.140001 \tabularnewline
11 & -0.018039 & -0.1531 & 0.439389 \tabularnewline
12 & -0.217266 & -1.8436 & 0.034681 \tabularnewline
13 & -0.182403 & -1.5477 & 0.063035 \tabularnewline
14 & -0.123714 & -1.0498 & 0.148672 \tabularnewline
15 & -0.070507 & -0.5983 & 0.275767 \tabularnewline
16 & -0.128384 & -1.0894 & 0.139812 \tabularnewline
17 & -0.025439 & -0.2159 & 0.414855 \tabularnewline
18 & -0.155568 & -1.32 & 0.095502 \tabularnewline
19 & -0.201495 & -1.7097 & 0.04581 \tabularnewline
20 & -0.022429 & -0.1903 & 0.424798 \tabularnewline
21 & -0.179415 & -1.5224 & 0.066147 \tabularnewline
22 & -0.073992 & -0.6278 & 0.266046 \tabularnewline
23 & 0.014457 & 0.1227 & 0.451353 \tabularnewline
24 & -0.002872 & -0.0244 & 0.490313 \tabularnewline
25 & -0.06448 & -0.5471 & 0.292991 \tabularnewline
26 & 0.093418 & 0.7927 & 0.215284 \tabularnewline
27 & -0.110532 & -0.9379 & 0.175718 \tabularnewline
28 & -0.072927 & -0.6188 & 0.268999 \tabularnewline
29 & -0.022929 & -0.1946 & 0.423144 \tabularnewline
30 & -0.030891 & -0.2621 & 0.39699 \tabularnewline
31 & 0.056047 & 0.4756 & 0.317907 \tabularnewline
32 & -0.067457 & -0.5724 & 0.284419 \tabularnewline
33 & -0.051982 & -0.4411 & 0.330238 \tabularnewline
34 & -0.109468 & -0.9289 & 0.17803 \tabularnewline
35 & -0.124667 & -1.0578 & 0.146833 \tabularnewline
36 & -0.195413 & -1.6581 & 0.050821 \tabularnewline
37 & -0.016787 & -0.1424 & 0.443564 \tabularnewline
38 & -0.090381 & -0.7669 & 0.222822 \tabularnewline
39 & -0.081451 & -0.6911 & 0.245853 \tabularnewline
40 & -0.022949 & -0.1947 & 0.423077 \tabularnewline
41 & -0.124928 & -1.0601 & 0.146332 \tabularnewline
42 & -0.065602 & -0.5567 & 0.289746 \tabularnewline
43 & -0.12829 & -1.0886 & 0.139985 \tabularnewline
44 & -0.08334 & -0.7072 & 0.240874 \tabularnewline
45 & -0.034506 & -0.2928 & 0.385262 \tabularnewline
46 & 0.029545 & 0.2507 & 0.401381 \tabularnewline
47 & 0.056482 & 0.4793 & 0.316601 \tabularnewline
48 & 0.040752 & 0.3458 & 0.365252 \tabularnewline
49 & 0.118763 & 1.0077 & 0.158478 \tabularnewline
50 & 0.087318 & 0.7409 & 0.230577 \tabularnewline
51 & 0.06545 & 0.5554 & 0.290184 \tabularnewline
52 & 0.081986 & 0.6957 & 0.244435 \tabularnewline
53 & 0.074968 & 0.6361 & 0.263357 \tabularnewline
54 & 0.125609 & 1.0658 & 0.145032 \tabularnewline
55 & 0.100742 & 0.8548 & 0.197742 \tabularnewline
56 & 0.092677 & 0.7864 & 0.21711 \tabularnewline
57 & 0.152836 & 1.2969 & 0.099411 \tabularnewline
58 & 0.047999 & 0.4073 & 0.342504 \tabularnewline
59 & 0.016693 & 0.1416 & 0.443879 \tabularnewline
60 & 0.021066 & 0.1787 & 0.429319 \tabularnewline
\hline
\end{tabular}
%Source: https://freestatistics.org/blog/index.php?pk=31614&T=1

[TABLE]
[ROW][C]Autocorrelation Function[/C][/ROW]
[ROW][C]Time lag k[/C][C]ACF(k)[/C][C]T-STAT[/C][C]P-value[/C][/ROW]
[ROW][C]1[/C][C]0.239838[/C][C]2.0351[/C][C]0.022762[/C][/ROW]
[ROW][C]2[/C][C]0.280534[/C][C]2.3804[/C][C]0.009971[/C][/ROW]
[ROW][C]3[/C][C]0.211181[/C][C]1.7919[/C][C]0.038673[/C][/ROW]
[ROW][C]4[/C][C]0.093185[/C][C]0.7907[/C][C]0.215858[/C][/ROW]
[ROW][C]5[/C][C]0.111647[/C][C]0.9474[/C][C]0.173313[/C][/ROW]
[ROW][C]6[/C][C]0.083659[/C][C]0.7099[/C][C]0.240039[/C][/ROW]
[ROW][C]7[/C][C]0.165076[/C][C]1.4007[/C][C]0.082797[/C][/ROW]
[ROW][C]8[/C][C]0.095513[/C][C]0.8105[/C][C]0.210176[/C][/ROW]
[ROW][C]9[/C][C]0.168225[/C][C]1.4274[/C][C]0.078888[/C][/ROW]
[ROW][C]10[/C][C]-0.128282[/C][C]-1.0885[/C][C]0.140001[/C][/ROW]
[ROW][C]11[/C][C]-0.018039[/C][C]-0.1531[/C][C]0.439389[/C][/ROW]
[ROW][C]12[/C][C]-0.217266[/C][C]-1.8436[/C][C]0.034681[/C][/ROW]
[ROW][C]13[/C][C]-0.182403[/C][C]-1.5477[/C][C]0.063035[/C][/ROW]
[ROW][C]14[/C][C]-0.123714[/C][C]-1.0498[/C][C]0.148672[/C][/ROW]
[ROW][C]15[/C][C]-0.070507[/C][C]-0.5983[/C][C]0.275767[/C][/ROW]
[ROW][C]16[/C][C]-0.128384[/C][C]-1.0894[/C][C]0.139812[/C][/ROW]
[ROW][C]17[/C][C]-0.025439[/C][C]-0.2159[/C][C]0.414855[/C][/ROW]
[ROW][C]18[/C][C]-0.155568[/C][C]-1.32[/C][C]0.095502[/C][/ROW]
[ROW][C]19[/C][C]-0.201495[/C][C]-1.7097[/C][C]0.04581[/C][/ROW]
[ROW][C]20[/C][C]-0.022429[/C][C]-0.1903[/C][C]0.424798[/C][/ROW]
[ROW][C]21[/C][C]-0.179415[/C][C]-1.5224[/C][C]0.066147[/C][/ROW]
[ROW][C]22[/C][C]-0.073992[/C][C]-0.6278[/C][C]0.266046[/C][/ROW]
[ROW][C]23[/C][C]0.014457[/C][C]0.1227[/C][C]0.451353[/C][/ROW]
[ROW][C]24[/C][C]-0.002872[/C][C]-0.0244[/C][C]0.490313[/C][/ROW]
[ROW][C]25[/C][C]-0.06448[/C][C]-0.5471[/C][C]0.292991[/C][/ROW]
[ROW][C]26[/C][C]0.093418[/C][C]0.7927[/C][C]0.215284[/C][/ROW]
[ROW][C]27[/C][C]-0.110532[/C][C]-0.9379[/C][C]0.175718[/C][/ROW]
[ROW][C]28[/C][C]-0.072927[/C][C]-0.6188[/C][C]0.268999[/C][/ROW]
[ROW][C]29[/C][C]-0.022929[/C][C]-0.1946[/C][C]0.423144[/C][/ROW]
[ROW][C]30[/C][C]-0.030891[/C][C]-0.2621[/C][C]0.39699[/C][/ROW]
[ROW][C]31[/C][C]0.056047[/C][C]0.4756[/C][C]0.317907[/C][/ROW]
[ROW][C]32[/C][C]-0.067457[/C][C]-0.5724[/C][C]0.284419[/C][/ROW]
[ROW][C]33[/C][C]-0.051982[/C][C]-0.4411[/C][C]0.330238[/C][/ROW]
[ROW][C]34[/C][C]-0.109468[/C][C]-0.9289[/C][C]0.17803[/C][/ROW]
[ROW][C]35[/C][C]-0.124667[/C][C]-1.0578[/C][C]0.146833[/C][/ROW]
[ROW][C]36[/C][C]-0.195413[/C][C]-1.6581[/C][C]0.050821[/C][/ROW]
[ROW][C]37[/C][C]-0.016787[/C][C]-0.1424[/C][C]0.443564[/C][/ROW]
[ROW][C]38[/C][C]-0.090381[/C][C]-0.7669[/C][C]0.222822[/C][/ROW]
[ROW][C]39[/C][C]-0.081451[/C][C]-0.6911[/C][C]0.245853[/C][/ROW]
[ROW][C]40[/C][C]-0.022949[/C][C]-0.1947[/C][C]0.423077[/C][/ROW]
[ROW][C]41[/C][C]-0.124928[/C][C]-1.0601[/C][C]0.146332[/C][/ROW]
[ROW][C]42[/C][C]-0.065602[/C][C]-0.5567[/C][C]0.289746[/C][/ROW]
[ROW][C]43[/C][C]-0.12829[/C][C]-1.0886[/C][C]0.139985[/C][/ROW]
[ROW][C]44[/C][C]-0.08334[/C][C]-0.7072[/C][C]0.240874[/C][/ROW]
[ROW][C]45[/C][C]-0.034506[/C][C]-0.2928[/C][C]0.385262[/C][/ROW]
[ROW][C]46[/C][C]0.029545[/C][C]0.2507[/C][C]0.401381[/C][/ROW]
[ROW][C]47[/C][C]0.056482[/C][C]0.4793[/C][C]0.316601[/C][/ROW]
[ROW][C]48[/C][C]0.040752[/C][C]0.3458[/C][C]0.365252[/C][/ROW]
[ROW][C]49[/C][C]0.118763[/C][C]1.0077[/C][C]0.158478[/C][/ROW]
[ROW][C]50[/C][C]0.087318[/C][C]0.7409[/C][C]0.230577[/C][/ROW]
[ROW][C]51[/C][C]0.06545[/C][C]0.5554[/C][C]0.290184[/C][/ROW]
[ROW][C]52[/C][C]0.081986[/C][C]0.6957[/C][C]0.244435[/C][/ROW]
[ROW][C]53[/C][C]0.074968[/C][C]0.6361[/C][C]0.263357[/C][/ROW]
[ROW][C]54[/C][C]0.125609[/C][C]1.0658[/C][C]0.145032[/C][/ROW]
[ROW][C]55[/C][C]0.100742[/C][C]0.8548[/C][C]0.197742[/C][/ROW]
[ROW][C]56[/C][C]0.092677[/C][C]0.7864[/C][C]0.21711[/C][/ROW]
[ROW][C]57[/C][C]0.152836[/C][C]1.2969[/C][C]0.099411[/C][/ROW]
[ROW][C]58[/C][C]0.047999[/C][C]0.4073[/C][C]0.342504[/C][/ROW]
[ROW][C]59[/C][C]0.016693[/C][C]0.1416[/C][C]0.443879[/C][/ROW]
[ROW][C]60[/C][C]0.021066[/C][C]0.1787[/C][C]0.429319[/C][/ROW]
[/TABLE]
Source: https://freestatistics.org/blog/index.php?pk=31614&T=1

Globally Unique Identifier (entire table): ba.freestatistics.org/blog/index.php?pk=31614&T=1

As an alternative you can also use a QR Code:  

The GUIDs for individual cells are displayed in the table below:

Autocorrelation Function
Time lag kACF(k)T-STATP-value
10.2398382.03510.022762
20.2805342.38040.009971
30.2111811.79190.038673
40.0931850.79070.215858
50.1116470.94740.173313
60.0836590.70990.240039
70.1650761.40070.082797
80.0955130.81050.210176
90.1682251.42740.078888
10-0.128282-1.08850.140001
11-0.018039-0.15310.439389
12-0.217266-1.84360.034681
13-0.182403-1.54770.063035
14-0.123714-1.04980.148672
15-0.070507-0.59830.275767
16-0.128384-1.08940.139812
17-0.025439-0.21590.414855
18-0.155568-1.320.095502
19-0.201495-1.70970.04581
20-0.022429-0.19030.424798
21-0.179415-1.52240.066147
22-0.073992-0.62780.266046
230.0144570.12270.451353
24-0.002872-0.02440.490313
25-0.06448-0.54710.292991
260.0934180.79270.215284
27-0.110532-0.93790.175718
28-0.072927-0.61880.268999
29-0.022929-0.19460.423144
30-0.030891-0.26210.39699
310.0560470.47560.317907
32-0.067457-0.57240.284419
33-0.051982-0.44110.330238
34-0.109468-0.92890.17803
35-0.124667-1.05780.146833
36-0.195413-1.65810.050821
37-0.016787-0.14240.443564
38-0.090381-0.76690.222822
39-0.081451-0.69110.245853
40-0.022949-0.19470.423077
41-0.124928-1.06010.146332
42-0.065602-0.55670.289746
43-0.12829-1.08860.139985
44-0.08334-0.70720.240874
45-0.034506-0.29280.385262
460.0295450.25070.401381
470.0564820.47930.316601
480.0407520.34580.365252
490.1187631.00770.158478
500.0873180.74090.230577
510.065450.55540.290184
520.0819860.69570.244435
530.0749680.63610.263357
540.1256091.06580.145032
550.1007420.85480.197742
560.0926770.78640.21711
570.1528361.29690.099411
580.0479990.40730.342504
590.0166930.14160.443879
600.0210660.17870.429319


Partial Autocorrelation Function
Time lag kPACF(k)T-STATP-value
10.2398382.03510.022762
20.2366222.00780.024208
30.1158450.9830.164456
4-0.031791-0.26980.394059
50.0269110.22830.410012
60.0282850.240.405505
70.1286511.09160.139315
80.0140.11880.452884
90.0871130.73920.231102
10-0.270694-2.29690.012267
11-0.035479-0.30110.382122
12-0.217222-1.84320.034708
13-0.064768-0.54960.292156
14-0.029656-0.25160.401018
150.091630.77750.219705
16-0.119626-1.01510.156739
170.1193851.0130.157223
18-0.157626-1.33750.092635
190.0007430.00630.497492
200.0876210.74350.229802
210.0140550.11930.4527
22-0.089149-0.75650.225922
230.1134040.96230.169568
24-0.076925-0.65270.258005
25-0.051809-0.43960.330767
260.0851790.72280.236082
27-0.086128-0.73080.233631
28-0.133294-1.1310.130896
290.0023420.01990.492099
300.0199680.16940.432965
31-0.005218-0.04430.482403
32-0.119436-1.01340.15712
33-0.059266-0.50290.30829
34-0.137125-1.16350.124226
35-0.083021-0.70450.24171
36-0.029703-0.2520.400864
370.0625060.53040.298741
38-0.031423-0.26660.395255
39-0.019911-0.16890.433155
40-0.086736-0.7360.232067
41-0.052958-0.44940.327259
420.0557380.4730.31884
43-0.083153-0.70560.241365
44-0.029704-0.2520.400862
450.0287140.24360.404099
46-0.116373-0.98750.163362
470.0642530.54520.293648
48-0.021676-0.18390.427293
490.0889910.75510.226322
500.0336180.28530.388133
51-0.024144-0.20490.419128
52-0.059613-0.50580.307259
53-0.022581-0.19160.424296
54-0.027133-0.23020.409283
550.0145020.1230.451205
56-0.077711-0.65940.255872
570.0379450.3220.374202
58-0.062295-0.52860.299358
59-0.050182-0.42580.335759
60-0.038722-0.32860.371719

\begin{tabular}{lllllllll}
\hline
Partial Autocorrelation Function \tabularnewline
Time lag k & PACF(k) & T-STAT & P-value \tabularnewline
1 & 0.239838 & 2.0351 & 0.022762 \tabularnewline
2 & 0.236622 & 2.0078 & 0.024208 \tabularnewline
3 & 0.115845 & 0.983 & 0.164456 \tabularnewline
4 & -0.031791 & -0.2698 & 0.394059 \tabularnewline
5 & 0.026911 & 0.2283 & 0.410012 \tabularnewline
6 & 0.028285 & 0.24 & 0.405505 \tabularnewline
7 & 0.128651 & 1.0916 & 0.139315 \tabularnewline
8 & 0.014 & 0.1188 & 0.452884 \tabularnewline
9 & 0.087113 & 0.7392 & 0.231102 \tabularnewline
10 & -0.270694 & -2.2969 & 0.012267 \tabularnewline
11 & -0.035479 & -0.3011 & 0.382122 \tabularnewline
12 & -0.217222 & -1.8432 & 0.034708 \tabularnewline
13 & -0.064768 & -0.5496 & 0.292156 \tabularnewline
14 & -0.029656 & -0.2516 & 0.401018 \tabularnewline
15 & 0.09163 & 0.7775 & 0.219705 \tabularnewline
16 & -0.119626 & -1.0151 & 0.156739 \tabularnewline
17 & 0.119385 & 1.013 & 0.157223 \tabularnewline
18 & -0.157626 & -1.3375 & 0.092635 \tabularnewline
19 & 0.000743 & 0.0063 & 0.497492 \tabularnewline
20 & 0.087621 & 0.7435 & 0.229802 \tabularnewline
21 & 0.014055 & 0.1193 & 0.4527 \tabularnewline
22 & -0.089149 & -0.7565 & 0.225922 \tabularnewline
23 & 0.113404 & 0.9623 & 0.169568 \tabularnewline
24 & -0.076925 & -0.6527 & 0.258005 \tabularnewline
25 & -0.051809 & -0.4396 & 0.330767 \tabularnewline
26 & 0.085179 & 0.7228 & 0.236082 \tabularnewline
27 & -0.086128 & -0.7308 & 0.233631 \tabularnewline
28 & -0.133294 & -1.131 & 0.130896 \tabularnewline
29 & 0.002342 & 0.0199 & 0.492099 \tabularnewline
30 & 0.019968 & 0.1694 & 0.432965 \tabularnewline
31 & -0.005218 & -0.0443 & 0.482403 \tabularnewline
32 & -0.119436 & -1.0134 & 0.15712 \tabularnewline
33 & -0.059266 & -0.5029 & 0.30829 \tabularnewline
34 & -0.137125 & -1.1635 & 0.124226 \tabularnewline
35 & -0.083021 & -0.7045 & 0.24171 \tabularnewline
36 & -0.029703 & -0.252 & 0.400864 \tabularnewline
37 & 0.062506 & 0.5304 & 0.298741 \tabularnewline
38 & -0.031423 & -0.2666 & 0.395255 \tabularnewline
39 & -0.019911 & -0.1689 & 0.433155 \tabularnewline
40 & -0.086736 & -0.736 & 0.232067 \tabularnewline
41 & -0.052958 & -0.4494 & 0.327259 \tabularnewline
42 & 0.055738 & 0.473 & 0.31884 \tabularnewline
43 & -0.083153 & -0.7056 & 0.241365 \tabularnewline
44 & -0.029704 & -0.252 & 0.400862 \tabularnewline
45 & 0.028714 & 0.2436 & 0.404099 \tabularnewline
46 & -0.116373 & -0.9875 & 0.163362 \tabularnewline
47 & 0.064253 & 0.5452 & 0.293648 \tabularnewline
48 & -0.021676 & -0.1839 & 0.427293 \tabularnewline
49 & 0.088991 & 0.7551 & 0.226322 \tabularnewline
50 & 0.033618 & 0.2853 & 0.388133 \tabularnewline
51 & -0.024144 & -0.2049 & 0.419128 \tabularnewline
52 & -0.059613 & -0.5058 & 0.307259 \tabularnewline
53 & -0.022581 & -0.1916 & 0.424296 \tabularnewline
54 & -0.027133 & -0.2302 & 0.409283 \tabularnewline
55 & 0.014502 & 0.123 & 0.451205 \tabularnewline
56 & -0.077711 & -0.6594 & 0.255872 \tabularnewline
57 & 0.037945 & 0.322 & 0.374202 \tabularnewline
58 & -0.062295 & -0.5286 & 0.299358 \tabularnewline
59 & -0.050182 & -0.4258 & 0.335759 \tabularnewline
60 & -0.038722 & -0.3286 & 0.371719 \tabularnewline
\hline
\end{tabular}
%Source: https://freestatistics.org/blog/index.php?pk=31614&T=2

[TABLE]
[ROW][C]Partial Autocorrelation Function[/C][/ROW]
[ROW][C]Time lag k[/C][C]PACF(k)[/C][C]T-STAT[/C][C]P-value[/C][/ROW]
[ROW][C]1[/C][C]0.239838[/C][C]2.0351[/C][C]0.022762[/C][/ROW]
[ROW][C]2[/C][C]0.236622[/C][C]2.0078[/C][C]0.024208[/C][/ROW]
[ROW][C]3[/C][C]0.115845[/C][C]0.983[/C][C]0.164456[/C][/ROW]
[ROW][C]4[/C][C]-0.031791[/C][C]-0.2698[/C][C]0.394059[/C][/ROW]
[ROW][C]5[/C][C]0.026911[/C][C]0.2283[/C][C]0.410012[/C][/ROW]
[ROW][C]6[/C][C]0.028285[/C][C]0.24[/C][C]0.405505[/C][/ROW]
[ROW][C]7[/C][C]0.128651[/C][C]1.0916[/C][C]0.139315[/C][/ROW]
[ROW][C]8[/C][C]0.014[/C][C]0.1188[/C][C]0.452884[/C][/ROW]
[ROW][C]9[/C][C]0.087113[/C][C]0.7392[/C][C]0.231102[/C][/ROW]
[ROW][C]10[/C][C]-0.270694[/C][C]-2.2969[/C][C]0.012267[/C][/ROW]
[ROW][C]11[/C][C]-0.035479[/C][C]-0.3011[/C][C]0.382122[/C][/ROW]
[ROW][C]12[/C][C]-0.217222[/C][C]-1.8432[/C][C]0.034708[/C][/ROW]
[ROW][C]13[/C][C]-0.064768[/C][C]-0.5496[/C][C]0.292156[/C][/ROW]
[ROW][C]14[/C][C]-0.029656[/C][C]-0.2516[/C][C]0.401018[/C][/ROW]
[ROW][C]15[/C][C]0.09163[/C][C]0.7775[/C][C]0.219705[/C][/ROW]
[ROW][C]16[/C][C]-0.119626[/C][C]-1.0151[/C][C]0.156739[/C][/ROW]
[ROW][C]17[/C][C]0.119385[/C][C]1.013[/C][C]0.157223[/C][/ROW]
[ROW][C]18[/C][C]-0.157626[/C][C]-1.3375[/C][C]0.092635[/C][/ROW]
[ROW][C]19[/C][C]0.000743[/C][C]0.0063[/C][C]0.497492[/C][/ROW]
[ROW][C]20[/C][C]0.087621[/C][C]0.7435[/C][C]0.229802[/C][/ROW]
[ROW][C]21[/C][C]0.014055[/C][C]0.1193[/C][C]0.4527[/C][/ROW]
[ROW][C]22[/C][C]-0.089149[/C][C]-0.7565[/C][C]0.225922[/C][/ROW]
[ROW][C]23[/C][C]0.113404[/C][C]0.9623[/C][C]0.169568[/C][/ROW]
[ROW][C]24[/C][C]-0.076925[/C][C]-0.6527[/C][C]0.258005[/C][/ROW]
[ROW][C]25[/C][C]-0.051809[/C][C]-0.4396[/C][C]0.330767[/C][/ROW]
[ROW][C]26[/C][C]0.085179[/C][C]0.7228[/C][C]0.236082[/C][/ROW]
[ROW][C]27[/C][C]-0.086128[/C][C]-0.7308[/C][C]0.233631[/C][/ROW]
[ROW][C]28[/C][C]-0.133294[/C][C]-1.131[/C][C]0.130896[/C][/ROW]
[ROW][C]29[/C][C]0.002342[/C][C]0.0199[/C][C]0.492099[/C][/ROW]
[ROW][C]30[/C][C]0.019968[/C][C]0.1694[/C][C]0.432965[/C][/ROW]
[ROW][C]31[/C][C]-0.005218[/C][C]-0.0443[/C][C]0.482403[/C][/ROW]
[ROW][C]32[/C][C]-0.119436[/C][C]-1.0134[/C][C]0.15712[/C][/ROW]
[ROW][C]33[/C][C]-0.059266[/C][C]-0.5029[/C][C]0.30829[/C][/ROW]
[ROW][C]34[/C][C]-0.137125[/C][C]-1.1635[/C][C]0.124226[/C][/ROW]
[ROW][C]35[/C][C]-0.083021[/C][C]-0.7045[/C][C]0.24171[/C][/ROW]
[ROW][C]36[/C][C]-0.029703[/C][C]-0.252[/C][C]0.400864[/C][/ROW]
[ROW][C]37[/C][C]0.062506[/C][C]0.5304[/C][C]0.298741[/C][/ROW]
[ROW][C]38[/C][C]-0.031423[/C][C]-0.2666[/C][C]0.395255[/C][/ROW]
[ROW][C]39[/C][C]-0.019911[/C][C]-0.1689[/C][C]0.433155[/C][/ROW]
[ROW][C]40[/C][C]-0.086736[/C][C]-0.736[/C][C]0.232067[/C][/ROW]
[ROW][C]41[/C][C]-0.052958[/C][C]-0.4494[/C][C]0.327259[/C][/ROW]
[ROW][C]42[/C][C]0.055738[/C][C]0.473[/C][C]0.31884[/C][/ROW]
[ROW][C]43[/C][C]-0.083153[/C][C]-0.7056[/C][C]0.241365[/C][/ROW]
[ROW][C]44[/C][C]-0.029704[/C][C]-0.252[/C][C]0.400862[/C][/ROW]
[ROW][C]45[/C][C]0.028714[/C][C]0.2436[/C][C]0.404099[/C][/ROW]
[ROW][C]46[/C][C]-0.116373[/C][C]-0.9875[/C][C]0.163362[/C][/ROW]
[ROW][C]47[/C][C]0.064253[/C][C]0.5452[/C][C]0.293648[/C][/ROW]
[ROW][C]48[/C][C]-0.021676[/C][C]-0.1839[/C][C]0.427293[/C][/ROW]
[ROW][C]49[/C][C]0.088991[/C][C]0.7551[/C][C]0.226322[/C][/ROW]
[ROW][C]50[/C][C]0.033618[/C][C]0.2853[/C][C]0.388133[/C][/ROW]
[ROW][C]51[/C][C]-0.024144[/C][C]-0.2049[/C][C]0.419128[/C][/ROW]
[ROW][C]52[/C][C]-0.059613[/C][C]-0.5058[/C][C]0.307259[/C][/ROW]
[ROW][C]53[/C][C]-0.022581[/C][C]-0.1916[/C][C]0.424296[/C][/ROW]
[ROW][C]54[/C][C]-0.027133[/C][C]-0.2302[/C][C]0.409283[/C][/ROW]
[ROW][C]55[/C][C]0.014502[/C][C]0.123[/C][C]0.451205[/C][/ROW]
[ROW][C]56[/C][C]-0.077711[/C][C]-0.6594[/C][C]0.255872[/C][/ROW]
[ROW][C]57[/C][C]0.037945[/C][C]0.322[/C][C]0.374202[/C][/ROW]
[ROW][C]58[/C][C]-0.062295[/C][C]-0.5286[/C][C]0.299358[/C][/ROW]
[ROW][C]59[/C][C]-0.050182[/C][C]-0.4258[/C][C]0.335759[/C][/ROW]
[ROW][C]60[/C][C]-0.038722[/C][C]-0.3286[/C][C]0.371719[/C][/ROW]
[/TABLE]
Source: https://freestatistics.org/blog/index.php?pk=31614&T=2

Globally Unique Identifier (entire table): ba.freestatistics.org/blog/index.php?pk=31614&T=2

As an alternative you can also use a QR Code:  

The GUIDs for individual cells are displayed in the table below:

Partial Autocorrelation Function
Time lag kPACF(k)T-STATP-value
10.2398382.03510.022762
20.2366222.00780.024208
30.1158450.9830.164456
4-0.031791-0.26980.394059
50.0269110.22830.410012
60.0282850.240.405505
70.1286511.09160.139315
80.0140.11880.452884
90.0871130.73920.231102
10-0.270694-2.29690.012267
11-0.035479-0.30110.382122
12-0.217222-1.84320.034708
13-0.064768-0.54960.292156
14-0.029656-0.25160.401018
150.091630.77750.219705
16-0.119626-1.01510.156739
170.1193851.0130.157223
18-0.157626-1.33750.092635
190.0007430.00630.497492
200.0876210.74350.229802
210.0140550.11930.4527
22-0.089149-0.75650.225922
230.1134040.96230.169568
24-0.076925-0.65270.258005
25-0.051809-0.43960.330767
260.0851790.72280.236082
27-0.086128-0.73080.233631
28-0.133294-1.1310.130896
290.0023420.01990.492099
300.0199680.16940.432965
31-0.005218-0.04430.482403
32-0.119436-1.01340.15712
33-0.059266-0.50290.30829
34-0.137125-1.16350.124226
35-0.083021-0.70450.24171
36-0.029703-0.2520.400864
370.0625060.53040.298741
38-0.031423-0.26660.395255
39-0.019911-0.16890.433155
40-0.086736-0.7360.232067
41-0.052958-0.44940.327259
420.0557380.4730.31884
43-0.083153-0.70560.241365
44-0.029704-0.2520.400862
450.0287140.24360.404099
46-0.116373-0.98750.163362
470.0642530.54520.293648
48-0.021676-0.18390.427293
490.0889910.75510.226322
500.0336180.28530.388133
51-0.024144-0.20490.419128
52-0.059613-0.50580.307259
53-0.022581-0.19160.424296
54-0.027133-0.23020.409283
550.0145020.1230.451205
56-0.077711-0.65940.255872
570.0379450.3220.374202
58-0.062295-0.52860.299358
59-0.050182-0.42580.335759
60-0.038722-0.32860.371719


Parameters (Session):
par1 = 60 ; par2 = 1 ; par3 = 0 ; par4 = 1 ; par5 = 12 ;
Parameters (R input):
par1 = 60 ; par2 = 1 ; par3 = 0 ; par4 = 1 ; par5 = 12 ;
R code (references can be found in the software module):
if (par1 == 'Default') {
par1 = 10*log10(length(x))
} else {
par1 <- as.numeric(par1)
}
par2 <- as.numeric(par2)
par3 <- as.numeric(par3)
par4 <- as.numeric(par4)
par5 <- as.numeric(par5)
if (par2 == 0) {
x <- log(x)
} else {
x <- (x ^ par2 - 1) / par2
}
if (par3 > 0) x <- diff(x,lag=1,difference=par3)
if (par4 > 0) x <- diff(x,lag=par5,difference=par4)
bitmap(file='pic1.png')
racf <- acf(x,par1,main='Autocorrelation',xlab='lags',ylab='ACF')
dev.off()
bitmap(file='pic2.png')
rpacf <- pacf(x,par1,main='Partial Autocorrelation',xlab='lags',ylab='PACF')
dev.off()
(myacf <- c(racf$acf))
(mypacf <- c(rpacf$acf))
lengthx <- length(x)
sqrtn <- sqrt(lengthx)
load(file='createtable')
a<-table.start()
a<-table.row.start(a)
a<-table.element(a,'Autocorrelation Function',4,TRUE)
a<-table.row.end(a)
a<-table.row.start(a)
a<-table.element(a,'Time lag k',header=TRUE)
a<-table.element(a,hyperlink('basics.htm','ACF(k)','click here for more information about the Autocorrelation Function'),header=TRUE)
a<-table.element(a,'T-STAT',header=TRUE)
a<-table.element(a,'P-value',header=TRUE)
a<-table.row.end(a)
for (i in 2:(par1+1)) {
a<-table.row.start(a)
a<-table.element(a,i-1,header=TRUE)
a<-table.element(a,round(myacf[i],6))
mytstat <- myacf[i]*sqrtn
a<-table.element(a,round(mytstat,4))
a<-table.element(a,round(1-pt(abs(mytstat),lengthx),6))
a<-table.row.end(a)
}
a<-table.end(a)
table.save(a,file='mytable.tab')
a<-table.start()
a<-table.row.start(a)
a<-table.element(a,'Partial Autocorrelation Function',4,TRUE)
a<-table.row.end(a)
a<-table.row.start(a)
a<-table.element(a,'Time lag k',header=TRUE)
a<-table.element(a,hyperlink('basics.htm','PACF(k)','click here for more information about the Partial Autocorrelation Function'),header=TRUE)
a<-table.element(a,'T-STAT',header=TRUE)
a<-table.element(a,'P-value',header=TRUE)
a<-table.row.end(a)
for (i in 1:par1) {
a<-table.row.start(a)
a<-table.element(a,i,header=TRUE)
a<-table.element(a,round(mypacf[i],6))
mytstat <- mypacf[i]*sqrtn
a<-table.element(a,round(mytstat,4))
a<-table.element(a,round(1-pt(abs(mytstat),lengthx),6))
a<-table.row.end(a)
}
a<-table.end(a)
table.save(a,file='mytable1.tab')