Free Statistics

of Irreproducible Research!

Author's title

Author*Unverified author*
R Software Modulerwasp_autocorrelation.wasp
Title produced by software(Partial) Autocorrelation Function
Date of computationTue, 09 Dec 2008 10:06:01 -0700
Cite this page as followsStatistical Computations at FreeStatistics.org, Office for Research Development and Education, URL https://freestatistics.org/blog/index.php?v=date/2008/Dec/09/t1228842451613noydb4ceiulx.htm/, Retrieved Sun, 19 May 2024 09:41:03 +0000
Statistical Computations at FreeStatistics.org, Office for Research Development and Education, URL https://freestatistics.org/blog/index.php?pk=31589, Retrieved Sun, 19 May 2024 09:41:03 +0000
QR Codes:

Original text written by user:
IsPrivate?No (this computation is public)
User-defined keywords
Estimated Impact210
Family? (F = Feedback message, R = changed R code, M = changed R Module, P = changed Parameters, D = changed Data)
-     [(Partial) Autocorrelation Function] [(P)ACF Transportm...] [2008-12-04 18:19:15] [65eec331235880e0070acfba94c20cfa]
-   P     [(Partial) Autocorrelation Function] [(P)ACF Transportm...] [2008-12-09 17:06:01] [d41d8cd98f00b204e9800998ecf8427e] [Current]
Feedback Forum

Post a new message
Dataseries X:
100.8
105.3
116.1
112.8
114.5
117.2
77.1
80.1
120.3
133.4
109.4
93.2
91.2
99.2
108.2
101.5
106.9
104.4
77.9
60
99.5
95
105.6
102.5
93.3
97.3
127
111.7
96.4
133
72.2
95.8
124.1
127.6
110.7
104.6
112.7
115.3
139.4
119
97.4
154
81.5
88.8
127.7
105.1
114.9
106.4
104.5
121.6
141.4
99
126.7
134.1
81.3
88.6
132.7
132.9
134.4
103.7
119.7
115
132.9
108.5
113.9
142
97.7
92.2
128.8
134.9
128.2
114.8
117.9


Summary of computational transaction
Raw Inputview raw input (R code)
Raw Outputview raw output of R engine
Computing time3 seconds
R Server'Herman Ole Andreas Wold' @ 193.190.124.10:1001

\begin{tabular}{lllllllll}
\hline
Summary of computational transaction \tabularnewline
Raw Input & view raw input (R code)  \tabularnewline
Raw Output & view raw output of R engine  \tabularnewline
Computing time & 3 seconds \tabularnewline
R Server & 'Herman Ole Andreas Wold' @ 193.190.124.10:1001 \tabularnewline
\hline
\end{tabular}
%Source: https://freestatistics.org/blog/index.php?pk=31589&T=0

[TABLE]
[ROW][C]Summary of computational transaction[/C][/ROW]
[ROW][C]Raw Input[/C][C]view raw input (R code) [/C][/ROW]
[ROW][C]Raw Output[/C][C]view raw output of R engine [/C][/ROW]
[ROW][C]Computing time[/C][C]3 seconds[/C][/ROW]
[ROW][C]R Server[/C][C]'Herman Ole Andreas Wold' @ 193.190.124.10:1001[/C][/ROW]
[/TABLE]
Source: https://freestatistics.org/blog/index.php?pk=31589&T=0

Globally Unique Identifier (entire table): ba.freestatistics.org/blog/index.php?pk=31589&T=0

As an alternative you can also use a QR Code:  

The GUIDs for individual cells are displayed in the table below:

Summary of computational transaction
Raw Inputview raw input (R code)
Raw Outputview raw output of R engine
Computing time3 seconds
R Server'Herman Ole Andreas Wold' @ 193.190.124.10:1001


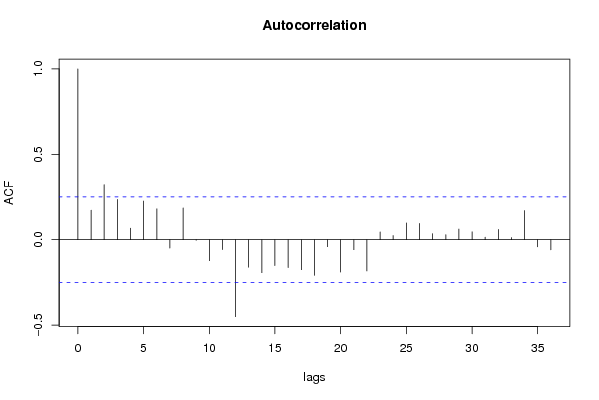
Autocorrelation Function
Time lag kACF(k)T-STATP-value
10.1727971.34960.091067
20.3221752.51630.007254
30.2358221.84180.035181
40.0678690.53010.298991
50.226291.76740.041083
60.1807191.41150.081595
7-0.04869-0.38030.352529
80.1858971.45190.075826
9-0.00341-0.02660.489421
10-0.12302-0.96080.170219
11-0.05795-0.45260.326219
12-0.45051-3.51860.000413
13-0.160682-1.2550.107139
14-0.193099-1.50810.068339
15-0.151464-1.1830.120705
16-0.162803-1.27150.104183
17-0.175489-1.37060.087759
18-0.208753-1.63040.054084
19-0.040571-0.31690.376212
20-0.189295-1.47840.072218
21-0.058258-0.4550.32536
22-0.182996-1.42920.079018
230.0457790.35750.36096
240.0241280.18840.425578
250.0981540.76660.223137
260.0956030.74670.229062
270.0356440.27840.390827
280.0293960.22960.409589
290.0627240.48990.312985
300.0464690.36290.358954
310.0145830.11390.454845
320.0604530.47220.31925
330.0126590.09890.460784
340.1704881.33160.09398
35-0.041636-0.32520.373077
36-0.058792-0.45920.323869

\begin{tabular}{lllllllll}
\hline
Autocorrelation Function \tabularnewline
Time lag k & ACF(k) & T-STAT & P-value \tabularnewline
1 & 0.172797 & 1.3496 & 0.091067 \tabularnewline
2 & 0.322175 & 2.5163 & 0.007254 \tabularnewline
3 & 0.235822 & 1.8418 & 0.035181 \tabularnewline
4 & 0.067869 & 0.5301 & 0.298991 \tabularnewline
5 & 0.22629 & 1.7674 & 0.041083 \tabularnewline
6 & 0.180719 & 1.4115 & 0.081595 \tabularnewline
7 & -0.04869 & -0.3803 & 0.352529 \tabularnewline
8 & 0.185897 & 1.4519 & 0.075826 \tabularnewline
9 & -0.00341 & -0.0266 & 0.489421 \tabularnewline
10 & -0.12302 & -0.9608 & 0.170219 \tabularnewline
11 & -0.05795 & -0.4526 & 0.326219 \tabularnewline
12 & -0.45051 & -3.5186 & 0.000413 \tabularnewline
13 & -0.160682 & -1.255 & 0.107139 \tabularnewline
14 & -0.193099 & -1.5081 & 0.068339 \tabularnewline
15 & -0.151464 & -1.183 & 0.120705 \tabularnewline
16 & -0.162803 & -1.2715 & 0.104183 \tabularnewline
17 & -0.175489 & -1.3706 & 0.087759 \tabularnewline
18 & -0.208753 & -1.6304 & 0.054084 \tabularnewline
19 & -0.040571 & -0.3169 & 0.376212 \tabularnewline
20 & -0.189295 & -1.4784 & 0.072218 \tabularnewline
21 & -0.058258 & -0.455 & 0.32536 \tabularnewline
22 & -0.182996 & -1.4292 & 0.079018 \tabularnewline
23 & 0.045779 & 0.3575 & 0.36096 \tabularnewline
24 & 0.024128 & 0.1884 & 0.425578 \tabularnewline
25 & 0.098154 & 0.7666 & 0.223137 \tabularnewline
26 & 0.095603 & 0.7467 & 0.229062 \tabularnewline
27 & 0.035644 & 0.2784 & 0.390827 \tabularnewline
28 & 0.029396 & 0.2296 & 0.409589 \tabularnewline
29 & 0.062724 & 0.4899 & 0.312985 \tabularnewline
30 & 0.046469 & 0.3629 & 0.358954 \tabularnewline
31 & 0.014583 & 0.1139 & 0.454845 \tabularnewline
32 & 0.060453 & 0.4722 & 0.31925 \tabularnewline
33 & 0.012659 & 0.0989 & 0.460784 \tabularnewline
34 & 0.170488 & 1.3316 & 0.09398 \tabularnewline
35 & -0.041636 & -0.3252 & 0.373077 \tabularnewline
36 & -0.058792 & -0.4592 & 0.323869 \tabularnewline
\hline
\end{tabular}
%Source: https://freestatistics.org/blog/index.php?pk=31589&T=1

[TABLE]
[ROW][C]Autocorrelation Function[/C][/ROW]
[ROW][C]Time lag k[/C][C]ACF(k)[/C][C]T-STAT[/C][C]P-value[/C][/ROW]
[ROW][C]1[/C][C]0.172797[/C][C]1.3496[/C][C]0.091067[/C][/ROW]
[ROW][C]2[/C][C]0.322175[/C][C]2.5163[/C][C]0.007254[/C][/ROW]
[ROW][C]3[/C][C]0.235822[/C][C]1.8418[/C][C]0.035181[/C][/ROW]
[ROW][C]4[/C][C]0.067869[/C][C]0.5301[/C][C]0.298991[/C][/ROW]
[ROW][C]5[/C][C]0.22629[/C][C]1.7674[/C][C]0.041083[/C][/ROW]
[ROW][C]6[/C][C]0.180719[/C][C]1.4115[/C][C]0.081595[/C][/ROW]
[ROW][C]7[/C][C]-0.04869[/C][C]-0.3803[/C][C]0.352529[/C][/ROW]
[ROW][C]8[/C][C]0.185897[/C][C]1.4519[/C][C]0.075826[/C][/ROW]
[ROW][C]9[/C][C]-0.00341[/C][C]-0.0266[/C][C]0.489421[/C][/ROW]
[ROW][C]10[/C][C]-0.12302[/C][C]-0.9608[/C][C]0.170219[/C][/ROW]
[ROW][C]11[/C][C]-0.05795[/C][C]-0.4526[/C][C]0.326219[/C][/ROW]
[ROW][C]12[/C][C]-0.45051[/C][C]-3.5186[/C][C]0.000413[/C][/ROW]
[ROW][C]13[/C][C]-0.160682[/C][C]-1.255[/C][C]0.107139[/C][/ROW]
[ROW][C]14[/C][C]-0.193099[/C][C]-1.5081[/C][C]0.068339[/C][/ROW]
[ROW][C]15[/C][C]-0.151464[/C][C]-1.183[/C][C]0.120705[/C][/ROW]
[ROW][C]16[/C][C]-0.162803[/C][C]-1.2715[/C][C]0.104183[/C][/ROW]
[ROW][C]17[/C][C]-0.175489[/C][C]-1.3706[/C][C]0.087759[/C][/ROW]
[ROW][C]18[/C][C]-0.208753[/C][C]-1.6304[/C][C]0.054084[/C][/ROW]
[ROW][C]19[/C][C]-0.040571[/C][C]-0.3169[/C][C]0.376212[/C][/ROW]
[ROW][C]20[/C][C]-0.189295[/C][C]-1.4784[/C][C]0.072218[/C][/ROW]
[ROW][C]21[/C][C]-0.058258[/C][C]-0.455[/C][C]0.32536[/C][/ROW]
[ROW][C]22[/C][C]-0.182996[/C][C]-1.4292[/C][C]0.079018[/C][/ROW]
[ROW][C]23[/C][C]0.045779[/C][C]0.3575[/C][C]0.36096[/C][/ROW]
[ROW][C]24[/C][C]0.024128[/C][C]0.1884[/C][C]0.425578[/C][/ROW]
[ROW][C]25[/C][C]0.098154[/C][C]0.7666[/C][C]0.223137[/C][/ROW]
[ROW][C]26[/C][C]0.095603[/C][C]0.7467[/C][C]0.229062[/C][/ROW]
[ROW][C]27[/C][C]0.035644[/C][C]0.2784[/C][C]0.390827[/C][/ROW]
[ROW][C]28[/C][C]0.029396[/C][C]0.2296[/C][C]0.409589[/C][/ROW]
[ROW][C]29[/C][C]0.062724[/C][C]0.4899[/C][C]0.312985[/C][/ROW]
[ROW][C]30[/C][C]0.046469[/C][C]0.3629[/C][C]0.358954[/C][/ROW]
[ROW][C]31[/C][C]0.014583[/C][C]0.1139[/C][C]0.454845[/C][/ROW]
[ROW][C]32[/C][C]0.060453[/C][C]0.4722[/C][C]0.31925[/C][/ROW]
[ROW][C]33[/C][C]0.012659[/C][C]0.0989[/C][C]0.460784[/C][/ROW]
[ROW][C]34[/C][C]0.170488[/C][C]1.3316[/C][C]0.09398[/C][/ROW]
[ROW][C]35[/C][C]-0.041636[/C][C]-0.3252[/C][C]0.373077[/C][/ROW]
[ROW][C]36[/C][C]-0.058792[/C][C]-0.4592[/C][C]0.323869[/C][/ROW]
[/TABLE]
Source: https://freestatistics.org/blog/index.php?pk=31589&T=1

Globally Unique Identifier (entire table): ba.freestatistics.org/blog/index.php?pk=31589&T=1

As an alternative you can also use a QR Code:  

The GUIDs for individual cells are displayed in the table below:

Autocorrelation Function
Time lag kACF(k)T-STATP-value
10.1727971.34960.091067
20.3221752.51630.007254
30.2358221.84180.035181
40.0678690.53010.298991
50.226291.76740.041083
60.1807191.41150.081595
7-0.04869-0.38030.352529
80.1858971.45190.075826
9-0.00341-0.02660.489421
10-0.12302-0.96080.170219
11-0.05795-0.45260.326219
12-0.45051-3.51860.000413
13-0.160682-1.2550.107139
14-0.193099-1.50810.068339
15-0.151464-1.1830.120705
16-0.162803-1.27150.104183
17-0.175489-1.37060.087759
18-0.208753-1.63040.054084
19-0.040571-0.31690.376212
20-0.189295-1.47840.072218
21-0.058258-0.4550.32536
22-0.182996-1.42920.079018
230.0457790.35750.36096
240.0241280.18840.425578
250.0981540.76660.223137
260.0956030.74670.229062
270.0356440.27840.390827
280.0293960.22960.409589
290.0627240.48990.312985
300.0464690.36290.358954
310.0145830.11390.454845
320.0604530.47220.31925
330.0126590.09890.460784
340.1704881.33160.09398
35-0.041636-0.32520.373077
36-0.058792-0.45920.323869


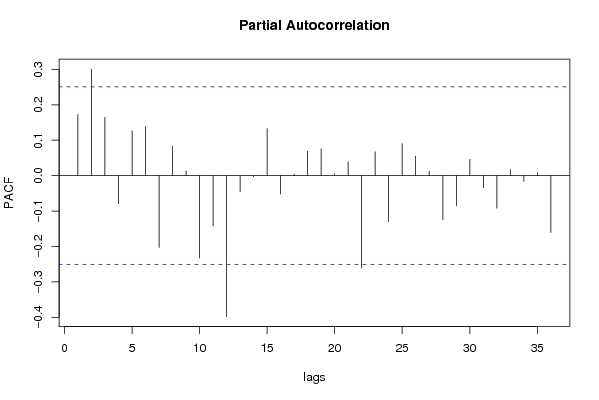
Partial Autocorrelation Function
Time lag kPACF(k)T-STATP-value
10.1727971.34960.091067
20.3013132.35330.010923
30.1642281.28270.102232
4-0.079227-0.61880.269183
50.1265040.9880.163521
60.138611.08260.141627
7-0.20291-1.58480.059094
80.0831310.64930.259299
90.0128870.10060.46008
10-0.232914-1.81910.036901
11-0.141952-1.10870.135961
12-0.398324-3.1110.001417
13-0.044899-0.35070.363521
14-0.002937-0.02290.490888
150.1327631.03690.151935
16-0.052134-0.40720.342652
170.0040640.03170.48739
180.0685210.53520.297241
190.0755620.59020.278632
200.0053210.04160.483494
210.0390920.30530.380582
22-0.261002-2.03850.022921
230.0675730.52780.29979
24-0.130264-1.01740.156492
250.0901610.70420.242
260.0551710.43090.33403
270.0124550.09730.461413
28-0.124038-0.96880.168244
29-0.085508-0.66780.253377
300.046150.36040.359881
31-0.034139-0.26660.395325
32-0.09201-0.71860.23756
330.0169220.13220.447643
34-0.016069-0.12550.45027
350.008420.06580.473892
36-0.160982-1.25730.106717

\begin{tabular}{lllllllll}
\hline
Partial Autocorrelation Function \tabularnewline
Time lag k & PACF(k) & T-STAT & P-value \tabularnewline
1 & 0.172797 & 1.3496 & 0.091067 \tabularnewline
2 & 0.301313 & 2.3533 & 0.010923 \tabularnewline
3 & 0.164228 & 1.2827 & 0.102232 \tabularnewline
4 & -0.079227 & -0.6188 & 0.269183 \tabularnewline
5 & 0.126504 & 0.988 & 0.163521 \tabularnewline
6 & 0.13861 & 1.0826 & 0.141627 \tabularnewline
7 & -0.20291 & -1.5848 & 0.059094 \tabularnewline
8 & 0.083131 & 0.6493 & 0.259299 \tabularnewline
9 & 0.012887 & 0.1006 & 0.46008 \tabularnewline
10 & -0.232914 & -1.8191 & 0.036901 \tabularnewline
11 & -0.141952 & -1.1087 & 0.135961 \tabularnewline
12 & -0.398324 & -3.111 & 0.001417 \tabularnewline
13 & -0.044899 & -0.3507 & 0.363521 \tabularnewline
14 & -0.002937 & -0.0229 & 0.490888 \tabularnewline
15 & 0.132763 & 1.0369 & 0.151935 \tabularnewline
16 & -0.052134 & -0.4072 & 0.342652 \tabularnewline
17 & 0.004064 & 0.0317 & 0.48739 \tabularnewline
18 & 0.068521 & 0.5352 & 0.297241 \tabularnewline
19 & 0.075562 & 0.5902 & 0.278632 \tabularnewline
20 & 0.005321 & 0.0416 & 0.483494 \tabularnewline
21 & 0.039092 & 0.3053 & 0.380582 \tabularnewline
22 & -0.261002 & -2.0385 & 0.022921 \tabularnewline
23 & 0.067573 & 0.5278 & 0.29979 \tabularnewline
24 & -0.130264 & -1.0174 & 0.156492 \tabularnewline
25 & 0.090161 & 0.7042 & 0.242 \tabularnewline
26 & 0.055171 & 0.4309 & 0.33403 \tabularnewline
27 & 0.012455 & 0.0973 & 0.461413 \tabularnewline
28 & -0.124038 & -0.9688 & 0.168244 \tabularnewline
29 & -0.085508 & -0.6678 & 0.253377 \tabularnewline
30 & 0.04615 & 0.3604 & 0.359881 \tabularnewline
31 & -0.034139 & -0.2666 & 0.395325 \tabularnewline
32 & -0.09201 & -0.7186 & 0.23756 \tabularnewline
33 & 0.016922 & 0.1322 & 0.447643 \tabularnewline
34 & -0.016069 & -0.1255 & 0.45027 \tabularnewline
35 & 0.00842 & 0.0658 & 0.473892 \tabularnewline
36 & -0.160982 & -1.2573 & 0.106717 \tabularnewline
\hline
\end{tabular}
%Source: https://freestatistics.org/blog/index.php?pk=31589&T=2

[TABLE]
[ROW][C]Partial Autocorrelation Function[/C][/ROW]
[ROW][C]Time lag k[/C][C]PACF(k)[/C][C]T-STAT[/C][C]P-value[/C][/ROW]
[ROW][C]1[/C][C]0.172797[/C][C]1.3496[/C][C]0.091067[/C][/ROW]
[ROW][C]2[/C][C]0.301313[/C][C]2.3533[/C][C]0.010923[/C][/ROW]
[ROW][C]3[/C][C]0.164228[/C][C]1.2827[/C][C]0.102232[/C][/ROW]
[ROW][C]4[/C][C]-0.079227[/C][C]-0.6188[/C][C]0.269183[/C][/ROW]
[ROW][C]5[/C][C]0.126504[/C][C]0.988[/C][C]0.163521[/C][/ROW]
[ROW][C]6[/C][C]0.13861[/C][C]1.0826[/C][C]0.141627[/C][/ROW]
[ROW][C]7[/C][C]-0.20291[/C][C]-1.5848[/C][C]0.059094[/C][/ROW]
[ROW][C]8[/C][C]0.083131[/C][C]0.6493[/C][C]0.259299[/C][/ROW]
[ROW][C]9[/C][C]0.012887[/C][C]0.1006[/C][C]0.46008[/C][/ROW]
[ROW][C]10[/C][C]-0.232914[/C][C]-1.8191[/C][C]0.036901[/C][/ROW]
[ROW][C]11[/C][C]-0.141952[/C][C]-1.1087[/C][C]0.135961[/C][/ROW]
[ROW][C]12[/C][C]-0.398324[/C][C]-3.111[/C][C]0.001417[/C][/ROW]
[ROW][C]13[/C][C]-0.044899[/C][C]-0.3507[/C][C]0.363521[/C][/ROW]
[ROW][C]14[/C][C]-0.002937[/C][C]-0.0229[/C][C]0.490888[/C][/ROW]
[ROW][C]15[/C][C]0.132763[/C][C]1.0369[/C][C]0.151935[/C][/ROW]
[ROW][C]16[/C][C]-0.052134[/C][C]-0.4072[/C][C]0.342652[/C][/ROW]
[ROW][C]17[/C][C]0.004064[/C][C]0.0317[/C][C]0.48739[/C][/ROW]
[ROW][C]18[/C][C]0.068521[/C][C]0.5352[/C][C]0.297241[/C][/ROW]
[ROW][C]19[/C][C]0.075562[/C][C]0.5902[/C][C]0.278632[/C][/ROW]
[ROW][C]20[/C][C]0.005321[/C][C]0.0416[/C][C]0.483494[/C][/ROW]
[ROW][C]21[/C][C]0.039092[/C][C]0.3053[/C][C]0.380582[/C][/ROW]
[ROW][C]22[/C][C]-0.261002[/C][C]-2.0385[/C][C]0.022921[/C][/ROW]
[ROW][C]23[/C][C]0.067573[/C][C]0.5278[/C][C]0.29979[/C][/ROW]
[ROW][C]24[/C][C]-0.130264[/C][C]-1.0174[/C][C]0.156492[/C][/ROW]
[ROW][C]25[/C][C]0.090161[/C][C]0.7042[/C][C]0.242[/C][/ROW]
[ROW][C]26[/C][C]0.055171[/C][C]0.4309[/C][C]0.33403[/C][/ROW]
[ROW][C]27[/C][C]0.012455[/C][C]0.0973[/C][C]0.461413[/C][/ROW]
[ROW][C]28[/C][C]-0.124038[/C][C]-0.9688[/C][C]0.168244[/C][/ROW]
[ROW][C]29[/C][C]-0.085508[/C][C]-0.6678[/C][C]0.253377[/C][/ROW]
[ROW][C]30[/C][C]0.04615[/C][C]0.3604[/C][C]0.359881[/C][/ROW]
[ROW][C]31[/C][C]-0.034139[/C][C]-0.2666[/C][C]0.395325[/C][/ROW]
[ROW][C]32[/C][C]-0.09201[/C][C]-0.7186[/C][C]0.23756[/C][/ROW]
[ROW][C]33[/C][C]0.016922[/C][C]0.1322[/C][C]0.447643[/C][/ROW]
[ROW][C]34[/C][C]-0.016069[/C][C]-0.1255[/C][C]0.45027[/C][/ROW]
[ROW][C]35[/C][C]0.00842[/C][C]0.0658[/C][C]0.473892[/C][/ROW]
[ROW][C]36[/C][C]-0.160982[/C][C]-1.2573[/C][C]0.106717[/C][/ROW]
[/TABLE]
Source: https://freestatistics.org/blog/index.php?pk=31589&T=2

Globally Unique Identifier (entire table): ba.freestatistics.org/blog/index.php?pk=31589&T=2

As an alternative you can also use a QR Code:  

The GUIDs for individual cells are displayed in the table below:

Partial Autocorrelation Function
Time lag kPACF(k)T-STATP-value
10.1727971.34960.091067
20.3013132.35330.010923
30.1642281.28270.102232
4-0.079227-0.61880.269183
50.1265040.9880.163521
60.138611.08260.141627
7-0.20291-1.58480.059094
80.0831310.64930.259299
90.0128870.10060.46008
10-0.232914-1.81910.036901
11-0.141952-1.10870.135961
12-0.398324-3.1110.001417
13-0.044899-0.35070.363521
14-0.002937-0.02290.490888
150.1327631.03690.151935
16-0.052134-0.40720.342652
170.0040640.03170.48739
180.0685210.53520.297241
190.0755620.59020.278632
200.0053210.04160.483494
210.0390920.30530.380582
22-0.261002-2.03850.022921
230.0675730.52780.29979
24-0.130264-1.01740.156492
250.0901610.70420.242
260.0551710.43090.33403
270.0124550.09730.461413
28-0.124038-0.96880.168244
29-0.085508-0.66780.253377
300.046150.36040.359881
31-0.034139-0.26660.395325
32-0.09201-0.71860.23756
330.0169220.13220.447643
34-0.016069-0.12550.45027
350.008420.06580.473892
36-0.160982-1.25730.106717


Parameters (Session):
par1 = 36 ; par2 = 1 ; par3 = 0 ; par4 = 1 ; par5 = 12 ;
Parameters (R input):
par1 = 36 ; par2 = 1 ; par3 = 0 ; par4 = 1 ; par5 = 12 ;
R code (references can be found in the software module):
if (par1 == 'Default') {
par1 = 10*log10(length(x))
} else {
par1 <- as.numeric(par1)
}
par2 <- as.numeric(par2)
par3 <- as.numeric(par3)
par4 <- as.numeric(par4)
par5 <- as.numeric(par5)
if (par2 == 0) {
x <- log(x)
} else {
x <- (x ^ par2 - 1) / par2
}
if (par3 > 0) x <- diff(x,lag=1,difference=par3)
if (par4 > 0) x <- diff(x,lag=par5,difference=par4)
bitmap(file='pic1.png')
racf <- acf(x,par1,main='Autocorrelation',xlab='lags',ylab='ACF')
dev.off()
bitmap(file='pic2.png')
rpacf <- pacf(x,par1,main='Partial Autocorrelation',xlab='lags',ylab='PACF')
dev.off()
(myacf <- c(racf$acf))
(mypacf <- c(rpacf$acf))
lengthx <- length(x)
sqrtn <- sqrt(lengthx)
load(file='createtable')
a<-table.start()
a<-table.row.start(a)
a<-table.element(a,'Autocorrelation Function',4,TRUE)
a<-table.row.end(a)
a<-table.row.start(a)
a<-table.element(a,'Time lag k',header=TRUE)
a<-table.element(a,hyperlink('basics.htm','ACF(k)','click here for more information about the Autocorrelation Function'),header=TRUE)
a<-table.element(a,'T-STAT',header=TRUE)
a<-table.element(a,'P-value',header=TRUE)
a<-table.row.end(a)
for (i in 2:(par1+1)) {
a<-table.row.start(a)
a<-table.element(a,i-1,header=TRUE)
a<-table.element(a,round(myacf[i],6))
mytstat <- myacf[i]*sqrtn
a<-table.element(a,round(mytstat,4))
a<-table.element(a,round(1-pt(abs(mytstat),lengthx),6))
a<-table.row.end(a)
}
a<-table.end(a)
table.save(a,file='mytable.tab')
a<-table.start()
a<-table.row.start(a)
a<-table.element(a,'Partial Autocorrelation Function',4,TRUE)
a<-table.row.end(a)
a<-table.row.start(a)
a<-table.element(a,'Time lag k',header=TRUE)
a<-table.element(a,hyperlink('basics.htm','PACF(k)','click here for more information about the Partial Autocorrelation Function'),header=TRUE)
a<-table.element(a,'T-STAT',header=TRUE)
a<-table.element(a,'P-value',header=TRUE)
a<-table.row.end(a)
for (i in 1:par1) {
a<-table.row.start(a)
a<-table.element(a,i,header=TRUE)
a<-table.element(a,round(mypacf[i],6))
mytstat <- mypacf[i]*sqrtn
a<-table.element(a,round(mytstat,4))
a<-table.element(a,round(1-pt(abs(mytstat),lengthx),6))
a<-table.row.end(a)
}
a<-table.end(a)
table.save(a,file='mytable1.tab')