Free Statistics

of Irreproducible Research!

Author's title

Author*Unverified author*
R Software Modulerwasp_autocorrelation.wasp
Title produced by software(Partial) Autocorrelation Function
Date of computationTue, 09 Dec 2008 09:24:23 -0700
Cite this page as followsStatistical Computations at FreeStatistics.org, Office for Research Development and Education, URL https://freestatistics.org/blog/index.php?v=date/2008/Dec/09/t1228839961fwnvu1sn9edqrmt.htm/, Retrieved Sun, 19 May 2024 10:05:32 +0000
Statistical Computations at FreeStatistics.org, Office for Research Development and Education, URL https://freestatistics.org/blog/index.php?pk=31567, Retrieved Sun, 19 May 2024 10:05:32 +0000
QR Codes:

Original text written by user:
IsPrivate?No (this computation is public)
User-defined keywords
Estimated Impact163
Family? (F = Feedback message, R = changed R code, M = changed R Module, P = changed Parameters, D = changed Data)
-     [Univariate Data Series] [data set] [2008-12-01 19:54:57] [b98453cac15ba1066b407e146608df68]
F RMPD  [Standard Deviation-Mean Plot] [W8Q1(2)] [2008-12-08 20:04:32] [74be16979710d4c4e7c6647856088456]
- RMPD    [(Partial) Autocorrelation Function] [W8Q2(2)] [2008-12-09 10:18:02] [fefc9cefce013a6daab207c2a2eec05e]
-   P         [(Partial) Autocorrelation Function] [W8Q2(2)] [2008-12-09 16:24:23] [d41d8cd98f00b204e9800998ecf8427e] [Current]
Feedback Forum

Post a new message
Dataseries X:
104.9
110.9
104.8
94.1
95.8
99.3
101.1
104
99
105.4
107.1
110.7
117.1
118.7
126.5
127.5
134.6
131.8
135.9
142.7
141.7
153.4
145
137.7
148.3
152.2
169.4
168.6
161.1
174.1
179
190.6
190
181.6
174.8
180.5
196.8
193.8
197
216.3
221.4
217.9
229.7
227.4
204.2
196.6
198.8
207.5
190.7
201.6
210.5
223.5
223.8
231.2
244
234.7
250.2
265.7
287.6
283.3
295.4
312.3
333.8
347.7
383.2
407.1
413.6
362.7
321.9
239.4


Summary of computational transaction
Raw Inputview raw input (R code)
Raw Outputview raw output of R engine
Computing time1 seconds
R Server'George Udny Yule' @ 72.249.76.132

\begin{tabular}{lllllllll}
\hline
Summary of computational transaction \tabularnewline
Raw Input & view raw input (R code)  \tabularnewline
Raw Output & view raw output of R engine  \tabularnewline
Computing time & 1 seconds \tabularnewline
R Server & 'George Udny Yule' @ 72.249.76.132 \tabularnewline
\hline
\end{tabular}
%Source: https://freestatistics.org/blog/index.php?pk=31567&T=0

[TABLE]
[ROW][C]Summary of computational transaction[/C][/ROW]
[ROW][C]Raw Input[/C][C]view raw input (R code) [/C][/ROW]
[ROW][C]Raw Output[/C][C]view raw output of R engine [/C][/ROW]
[ROW][C]Computing time[/C][C]1 seconds[/C][/ROW]
[ROW][C]R Server[/C][C]'George Udny Yule' @ 72.249.76.132[/C][/ROW]
[/TABLE]
Source: https://freestatistics.org/blog/index.php?pk=31567&T=0

Globally Unique Identifier (entire table): ba.freestatistics.org/blog/index.php?pk=31567&T=0

As an alternative you can also use a QR Code:  

The GUIDs for individual cells are displayed in the table below:

Summary of computational transaction
Raw Inputview raw input (R code)
Raw Outputview raw output of R engine
Computing time1 seconds
R Server'George Udny Yule' @ 72.249.76.132


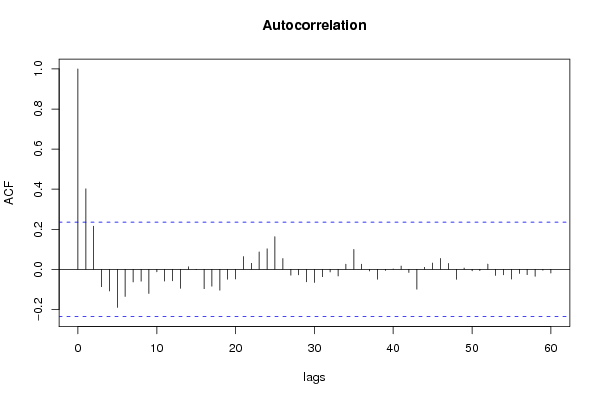
Autocorrelation Function
Time lag kACF(k)T-STATP-value
10.4019813.33910.000679
20.2157151.79190.038769
3-0.086132-0.71550.238367
4-0.107378-0.89190.187761
5-0.189863-1.57710.05967
6-0.134846-1.12010.133274
7-0.062441-0.51870.302823
8-0.059135-0.49120.312416
9-0.120313-0.99940.160548
10-0.012527-0.10410.458712
11-0.058196-0.48340.315168
12-0.056985-0.47340.318728
13-0.094502-0.7850.217573
140.0129360.10750.457372
15-0.000945-0.00790.496879
16-0.096594-0.80240.212546
17-0.083911-0.6970.244067
18-0.104061-0.86440.195184
19-0.049322-0.40970.341648
20-0.047572-0.39520.34697
210.0639880.53150.298381
220.030150.25040.401493
230.0869080.72190.236395
240.1024250.85080.19891
250.1628921.35310.090223
260.0536320.44550.328676
27-0.02897-0.24060.405274
28-0.02726-0.22640.410763
29-0.061886-0.51410.304424
30-0.065146-0.54110.295075
31-0.036783-0.30550.380437
32-0.012803-0.10630.457808
33-0.032929-0.27350.392631
340.0258940.21510.415164
350.0996070.82740.205431
360.0261010.21680.414498
37-0.008022-0.06660.473532
38-0.048744-0.40490.343402
39-0.005259-0.04370.48264
400.0021780.01810.49281
410.0165090.13710.445664
42-0.015378-0.12770.449365
43-0.098929-0.82180.207021
440.0104560.08690.46552
450.0314440.26120.397361
460.05450.45270.326088
470.0294620.24470.403696
48-0.049832-0.41390.340103
490.0063480.05270.47905
50-0.007036-0.05840.476781
51-0.006074-0.05050.479952
520.0261670.21740.414284
53-0.030114-0.25010.401611
54-0.027123-0.22530.411206
55-0.048486-0.40280.344185
56-0.020163-0.16750.433737
57-0.026704-0.22180.412554
58-0.03494-0.29020.386255
59-0.004135-0.03440.486348
60-0.018573-0.15430.43892

\begin{tabular}{lllllllll}
\hline
Autocorrelation Function \tabularnewline
Time lag k & ACF(k) & T-STAT & P-value \tabularnewline
1 & 0.401981 & 3.3391 & 0.000679 \tabularnewline
2 & 0.215715 & 1.7919 & 0.038769 \tabularnewline
3 & -0.086132 & -0.7155 & 0.238367 \tabularnewline
4 & -0.107378 & -0.8919 & 0.187761 \tabularnewline
5 & -0.189863 & -1.5771 & 0.05967 \tabularnewline
6 & -0.134846 & -1.1201 & 0.133274 \tabularnewline
7 & -0.062441 & -0.5187 & 0.302823 \tabularnewline
8 & -0.059135 & -0.4912 & 0.312416 \tabularnewline
9 & -0.120313 & -0.9994 & 0.160548 \tabularnewline
10 & -0.012527 & -0.1041 & 0.458712 \tabularnewline
11 & -0.058196 & -0.4834 & 0.315168 \tabularnewline
12 & -0.056985 & -0.4734 & 0.318728 \tabularnewline
13 & -0.094502 & -0.785 & 0.217573 \tabularnewline
14 & 0.012936 & 0.1075 & 0.457372 \tabularnewline
15 & -0.000945 & -0.0079 & 0.496879 \tabularnewline
16 & -0.096594 & -0.8024 & 0.212546 \tabularnewline
17 & -0.083911 & -0.697 & 0.244067 \tabularnewline
18 & -0.104061 & -0.8644 & 0.195184 \tabularnewline
19 & -0.049322 & -0.4097 & 0.341648 \tabularnewline
20 & -0.047572 & -0.3952 & 0.34697 \tabularnewline
21 & 0.063988 & 0.5315 & 0.298381 \tabularnewline
22 & 0.03015 & 0.2504 & 0.401493 \tabularnewline
23 & 0.086908 & 0.7219 & 0.236395 \tabularnewline
24 & 0.102425 & 0.8508 & 0.19891 \tabularnewline
25 & 0.162892 & 1.3531 & 0.090223 \tabularnewline
26 & 0.053632 & 0.4455 & 0.328676 \tabularnewline
27 & -0.02897 & -0.2406 & 0.405274 \tabularnewline
28 & -0.02726 & -0.2264 & 0.410763 \tabularnewline
29 & -0.061886 & -0.5141 & 0.304424 \tabularnewline
30 & -0.065146 & -0.5411 & 0.295075 \tabularnewline
31 & -0.036783 & -0.3055 & 0.380437 \tabularnewline
32 & -0.012803 & -0.1063 & 0.457808 \tabularnewline
33 & -0.032929 & -0.2735 & 0.392631 \tabularnewline
34 & 0.025894 & 0.2151 & 0.415164 \tabularnewline
35 & 0.099607 & 0.8274 & 0.205431 \tabularnewline
36 & 0.026101 & 0.2168 & 0.414498 \tabularnewline
37 & -0.008022 & -0.0666 & 0.473532 \tabularnewline
38 & -0.048744 & -0.4049 & 0.343402 \tabularnewline
39 & -0.005259 & -0.0437 & 0.48264 \tabularnewline
40 & 0.002178 & 0.0181 & 0.49281 \tabularnewline
41 & 0.016509 & 0.1371 & 0.445664 \tabularnewline
42 & -0.015378 & -0.1277 & 0.449365 \tabularnewline
43 & -0.098929 & -0.8218 & 0.207021 \tabularnewline
44 & 0.010456 & 0.0869 & 0.46552 \tabularnewline
45 & 0.031444 & 0.2612 & 0.397361 \tabularnewline
46 & 0.0545 & 0.4527 & 0.326088 \tabularnewline
47 & 0.029462 & 0.2447 & 0.403696 \tabularnewline
48 & -0.049832 & -0.4139 & 0.340103 \tabularnewline
49 & 0.006348 & 0.0527 & 0.47905 \tabularnewline
50 & -0.007036 & -0.0584 & 0.476781 \tabularnewline
51 & -0.006074 & -0.0505 & 0.479952 \tabularnewline
52 & 0.026167 & 0.2174 & 0.414284 \tabularnewline
53 & -0.030114 & -0.2501 & 0.401611 \tabularnewline
54 & -0.027123 & -0.2253 & 0.411206 \tabularnewline
55 & -0.048486 & -0.4028 & 0.344185 \tabularnewline
56 & -0.020163 & -0.1675 & 0.433737 \tabularnewline
57 & -0.026704 & -0.2218 & 0.412554 \tabularnewline
58 & -0.03494 & -0.2902 & 0.386255 \tabularnewline
59 & -0.004135 & -0.0344 & 0.486348 \tabularnewline
60 & -0.018573 & -0.1543 & 0.43892 \tabularnewline
\hline
\end{tabular}
%Source: https://freestatistics.org/blog/index.php?pk=31567&T=1

[TABLE]
[ROW][C]Autocorrelation Function[/C][/ROW]
[ROW][C]Time lag k[/C][C]ACF(k)[/C][C]T-STAT[/C][C]P-value[/C][/ROW]
[ROW][C]1[/C][C]0.401981[/C][C]3.3391[/C][C]0.000679[/C][/ROW]
[ROW][C]2[/C][C]0.215715[/C][C]1.7919[/C][C]0.038769[/C][/ROW]
[ROW][C]3[/C][C]-0.086132[/C][C]-0.7155[/C][C]0.238367[/C][/ROW]
[ROW][C]4[/C][C]-0.107378[/C][C]-0.8919[/C][C]0.187761[/C][/ROW]
[ROW][C]5[/C][C]-0.189863[/C][C]-1.5771[/C][C]0.05967[/C][/ROW]
[ROW][C]6[/C][C]-0.134846[/C][C]-1.1201[/C][C]0.133274[/C][/ROW]
[ROW][C]7[/C][C]-0.062441[/C][C]-0.5187[/C][C]0.302823[/C][/ROW]
[ROW][C]8[/C][C]-0.059135[/C][C]-0.4912[/C][C]0.312416[/C][/ROW]
[ROW][C]9[/C][C]-0.120313[/C][C]-0.9994[/C][C]0.160548[/C][/ROW]
[ROW][C]10[/C][C]-0.012527[/C][C]-0.1041[/C][C]0.458712[/C][/ROW]
[ROW][C]11[/C][C]-0.058196[/C][C]-0.4834[/C][C]0.315168[/C][/ROW]
[ROW][C]12[/C][C]-0.056985[/C][C]-0.4734[/C][C]0.318728[/C][/ROW]
[ROW][C]13[/C][C]-0.094502[/C][C]-0.785[/C][C]0.217573[/C][/ROW]
[ROW][C]14[/C][C]0.012936[/C][C]0.1075[/C][C]0.457372[/C][/ROW]
[ROW][C]15[/C][C]-0.000945[/C][C]-0.0079[/C][C]0.496879[/C][/ROW]
[ROW][C]16[/C][C]-0.096594[/C][C]-0.8024[/C][C]0.212546[/C][/ROW]
[ROW][C]17[/C][C]-0.083911[/C][C]-0.697[/C][C]0.244067[/C][/ROW]
[ROW][C]18[/C][C]-0.104061[/C][C]-0.8644[/C][C]0.195184[/C][/ROW]
[ROW][C]19[/C][C]-0.049322[/C][C]-0.4097[/C][C]0.341648[/C][/ROW]
[ROW][C]20[/C][C]-0.047572[/C][C]-0.3952[/C][C]0.34697[/C][/ROW]
[ROW][C]21[/C][C]0.063988[/C][C]0.5315[/C][C]0.298381[/C][/ROW]
[ROW][C]22[/C][C]0.03015[/C][C]0.2504[/C][C]0.401493[/C][/ROW]
[ROW][C]23[/C][C]0.086908[/C][C]0.7219[/C][C]0.236395[/C][/ROW]
[ROW][C]24[/C][C]0.102425[/C][C]0.8508[/C][C]0.19891[/C][/ROW]
[ROW][C]25[/C][C]0.162892[/C][C]1.3531[/C][C]0.090223[/C][/ROW]
[ROW][C]26[/C][C]0.053632[/C][C]0.4455[/C][C]0.328676[/C][/ROW]
[ROW][C]27[/C][C]-0.02897[/C][C]-0.2406[/C][C]0.405274[/C][/ROW]
[ROW][C]28[/C][C]-0.02726[/C][C]-0.2264[/C][C]0.410763[/C][/ROW]
[ROW][C]29[/C][C]-0.061886[/C][C]-0.5141[/C][C]0.304424[/C][/ROW]
[ROW][C]30[/C][C]-0.065146[/C][C]-0.5411[/C][C]0.295075[/C][/ROW]
[ROW][C]31[/C][C]-0.036783[/C][C]-0.3055[/C][C]0.380437[/C][/ROW]
[ROW][C]32[/C][C]-0.012803[/C][C]-0.1063[/C][C]0.457808[/C][/ROW]
[ROW][C]33[/C][C]-0.032929[/C][C]-0.2735[/C][C]0.392631[/C][/ROW]
[ROW][C]34[/C][C]0.025894[/C][C]0.2151[/C][C]0.415164[/C][/ROW]
[ROW][C]35[/C][C]0.099607[/C][C]0.8274[/C][C]0.205431[/C][/ROW]
[ROW][C]36[/C][C]0.026101[/C][C]0.2168[/C][C]0.414498[/C][/ROW]
[ROW][C]37[/C][C]-0.008022[/C][C]-0.0666[/C][C]0.473532[/C][/ROW]
[ROW][C]38[/C][C]-0.048744[/C][C]-0.4049[/C][C]0.343402[/C][/ROW]
[ROW][C]39[/C][C]-0.005259[/C][C]-0.0437[/C][C]0.48264[/C][/ROW]
[ROW][C]40[/C][C]0.002178[/C][C]0.0181[/C][C]0.49281[/C][/ROW]
[ROW][C]41[/C][C]0.016509[/C][C]0.1371[/C][C]0.445664[/C][/ROW]
[ROW][C]42[/C][C]-0.015378[/C][C]-0.1277[/C][C]0.449365[/C][/ROW]
[ROW][C]43[/C][C]-0.098929[/C][C]-0.8218[/C][C]0.207021[/C][/ROW]
[ROW][C]44[/C][C]0.010456[/C][C]0.0869[/C][C]0.46552[/C][/ROW]
[ROW][C]45[/C][C]0.031444[/C][C]0.2612[/C][C]0.397361[/C][/ROW]
[ROW][C]46[/C][C]0.0545[/C][C]0.4527[/C][C]0.326088[/C][/ROW]
[ROW][C]47[/C][C]0.029462[/C][C]0.2447[/C][C]0.403696[/C][/ROW]
[ROW][C]48[/C][C]-0.049832[/C][C]-0.4139[/C][C]0.340103[/C][/ROW]
[ROW][C]49[/C][C]0.006348[/C][C]0.0527[/C][C]0.47905[/C][/ROW]
[ROW][C]50[/C][C]-0.007036[/C][C]-0.0584[/C][C]0.476781[/C][/ROW]
[ROW][C]51[/C][C]-0.006074[/C][C]-0.0505[/C][C]0.479952[/C][/ROW]
[ROW][C]52[/C][C]0.026167[/C][C]0.2174[/C][C]0.414284[/C][/ROW]
[ROW][C]53[/C][C]-0.030114[/C][C]-0.2501[/C][C]0.401611[/C][/ROW]
[ROW][C]54[/C][C]-0.027123[/C][C]-0.2253[/C][C]0.411206[/C][/ROW]
[ROW][C]55[/C][C]-0.048486[/C][C]-0.4028[/C][C]0.344185[/C][/ROW]
[ROW][C]56[/C][C]-0.020163[/C][C]-0.1675[/C][C]0.433737[/C][/ROW]
[ROW][C]57[/C][C]-0.026704[/C][C]-0.2218[/C][C]0.412554[/C][/ROW]
[ROW][C]58[/C][C]-0.03494[/C][C]-0.2902[/C][C]0.386255[/C][/ROW]
[ROW][C]59[/C][C]-0.004135[/C][C]-0.0344[/C][C]0.486348[/C][/ROW]
[ROW][C]60[/C][C]-0.018573[/C][C]-0.1543[/C][C]0.43892[/C][/ROW]
[/TABLE]
Source: https://freestatistics.org/blog/index.php?pk=31567&T=1

Globally Unique Identifier (entire table): ba.freestatistics.org/blog/index.php?pk=31567&T=1

As an alternative you can also use a QR Code:  

The GUIDs for individual cells are displayed in the table below:

Autocorrelation Function
Time lag kACF(k)T-STATP-value
10.4019813.33910.000679
20.2157151.79190.038769
3-0.086132-0.71550.238367
4-0.107378-0.89190.187761
5-0.189863-1.57710.05967
6-0.134846-1.12010.133274
7-0.062441-0.51870.302823
8-0.059135-0.49120.312416
9-0.120313-0.99940.160548
10-0.012527-0.10410.458712
11-0.058196-0.48340.315168
12-0.056985-0.47340.318728
13-0.094502-0.7850.217573
140.0129360.10750.457372
15-0.000945-0.00790.496879
16-0.096594-0.80240.212546
17-0.083911-0.6970.244067
18-0.104061-0.86440.195184
19-0.049322-0.40970.341648
20-0.047572-0.39520.34697
210.0639880.53150.298381
220.030150.25040.401493
230.0869080.72190.236395
240.1024250.85080.19891
250.1628921.35310.090223
260.0536320.44550.328676
27-0.02897-0.24060.405274
28-0.02726-0.22640.410763
29-0.061886-0.51410.304424
30-0.065146-0.54110.295075
31-0.036783-0.30550.380437
32-0.012803-0.10630.457808
33-0.032929-0.27350.392631
340.0258940.21510.415164
350.0996070.82740.205431
360.0261010.21680.414498
37-0.008022-0.06660.473532
38-0.048744-0.40490.343402
39-0.005259-0.04370.48264
400.0021780.01810.49281
410.0165090.13710.445664
42-0.015378-0.12770.449365
43-0.098929-0.82180.207021
440.0104560.08690.46552
450.0314440.26120.397361
460.05450.45270.326088
470.0294620.24470.403696
48-0.049832-0.41390.340103
490.0063480.05270.47905
50-0.007036-0.05840.476781
51-0.006074-0.05050.479952
520.0261670.21740.414284
53-0.030114-0.25010.401611
54-0.027123-0.22530.411206
55-0.048486-0.40280.344185
56-0.020163-0.16750.433737
57-0.026704-0.22180.412554
58-0.03494-0.29020.386255
59-0.004135-0.03440.486348
60-0.018573-0.15430.43892


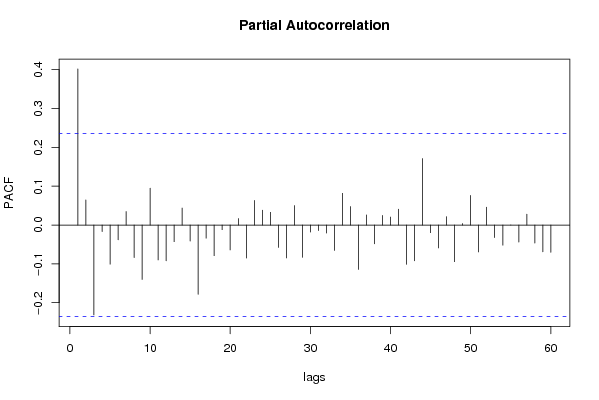
Partial Autocorrelation Function
Time lag kPACF(k)T-STATP-value
10.4019813.33910.000679
20.0645590.53630.296751
3-0.231399-1.92210.029359
4-0.016933-0.14070.444275
5-0.100928-0.83840.202359
6-0.038101-0.31650.376293
70.0346520.28780.387166
8-0.083816-0.69620.244312
9-0.140106-1.16380.124255
100.0948250.78770.216791
11-0.089851-0.74640.228994
12-0.092028-0.76440.223605
13-0.042973-0.3570.361104
140.043590.36210.359198
15-0.041296-0.3430.36631
16-0.178418-1.48210.071439
17-0.033779-0.28060.389932
18-0.078978-0.6560.25699
19-0.011858-0.09850.460911
20-0.064204-0.53330.297763
210.0166570.13840.445177
22-0.085169-0.70750.240831
230.0633670.52640.300161
240.0381170.31660.376242
250.0327560.27210.393183
26-0.057541-0.4780.317089
27-0.084867-0.7050.241605
280.0501970.4170.338999
29-0.083086-0.69020.246203
30-0.018065-0.15010.440577
31-0.014132-0.11740.453447
32-0.020754-0.17240.431816
33-0.065561-0.54460.293896
340.0817050.67870.2498
350.0476530.39580.346723
36-0.114503-0.95110.172429
370.0258540.21480.415293
38-0.048495-0.40280.344161
390.0248140.20610.418652
400.0206040.17110.432305
410.0408070.3390.367832
42-0.101315-0.84160.201464
43-0.092077-0.76480.223485
440.1712761.42270.079661
45-0.019695-0.16360.435263
46-0.059106-0.4910.312501
470.0215430.17890.429252
48-0.094413-0.78430.217787
490.0036340.03020.488002
500.0762260.63320.264354
51-0.069174-0.57460.283716
520.0458280.38070.352306
53-0.032394-0.26910.394335
54-0.051938-0.43140.333752
555.7e-055e-040.499813
56-0.043854-0.36430.358382
570.0278560.23140.408847
58-0.046571-0.38680.350029
59-0.068986-0.5730.28424
60-0.070227-0.58330.28078

\begin{tabular}{lllllllll}
\hline
Partial Autocorrelation Function \tabularnewline
Time lag k & PACF(k) & T-STAT & P-value \tabularnewline
1 & 0.401981 & 3.3391 & 0.000679 \tabularnewline
2 & 0.064559 & 0.5363 & 0.296751 \tabularnewline
3 & -0.231399 & -1.9221 & 0.029359 \tabularnewline
4 & -0.016933 & -0.1407 & 0.444275 \tabularnewline
5 & -0.100928 & -0.8384 & 0.202359 \tabularnewline
6 & -0.038101 & -0.3165 & 0.376293 \tabularnewline
7 & 0.034652 & 0.2878 & 0.387166 \tabularnewline
8 & -0.083816 & -0.6962 & 0.244312 \tabularnewline
9 & -0.140106 & -1.1638 & 0.124255 \tabularnewline
10 & 0.094825 & 0.7877 & 0.216791 \tabularnewline
11 & -0.089851 & -0.7464 & 0.228994 \tabularnewline
12 & -0.092028 & -0.7644 & 0.223605 \tabularnewline
13 & -0.042973 & -0.357 & 0.361104 \tabularnewline
14 & 0.04359 & 0.3621 & 0.359198 \tabularnewline
15 & -0.041296 & -0.343 & 0.36631 \tabularnewline
16 & -0.178418 & -1.4821 & 0.071439 \tabularnewline
17 & -0.033779 & -0.2806 & 0.389932 \tabularnewline
18 & -0.078978 & -0.656 & 0.25699 \tabularnewline
19 & -0.011858 & -0.0985 & 0.460911 \tabularnewline
20 & -0.064204 & -0.5333 & 0.297763 \tabularnewline
21 & 0.016657 & 0.1384 & 0.445177 \tabularnewline
22 & -0.085169 & -0.7075 & 0.240831 \tabularnewline
23 & 0.063367 & 0.5264 & 0.300161 \tabularnewline
24 & 0.038117 & 0.3166 & 0.376242 \tabularnewline
25 & 0.032756 & 0.2721 & 0.393183 \tabularnewline
26 & -0.057541 & -0.478 & 0.317089 \tabularnewline
27 & -0.084867 & -0.705 & 0.241605 \tabularnewline
28 & 0.050197 & 0.417 & 0.338999 \tabularnewline
29 & -0.083086 & -0.6902 & 0.246203 \tabularnewline
30 & -0.018065 & -0.1501 & 0.440577 \tabularnewline
31 & -0.014132 & -0.1174 & 0.453447 \tabularnewline
32 & -0.020754 & -0.1724 & 0.431816 \tabularnewline
33 & -0.065561 & -0.5446 & 0.293896 \tabularnewline
34 & 0.081705 & 0.6787 & 0.2498 \tabularnewline
35 & 0.047653 & 0.3958 & 0.346723 \tabularnewline
36 & -0.114503 & -0.9511 & 0.172429 \tabularnewline
37 & 0.025854 & 0.2148 & 0.415293 \tabularnewline
38 & -0.048495 & -0.4028 & 0.344161 \tabularnewline
39 & 0.024814 & 0.2061 & 0.418652 \tabularnewline
40 & 0.020604 & 0.1711 & 0.432305 \tabularnewline
41 & 0.040807 & 0.339 & 0.367832 \tabularnewline
42 & -0.101315 & -0.8416 & 0.201464 \tabularnewline
43 & -0.092077 & -0.7648 & 0.223485 \tabularnewline
44 & 0.171276 & 1.4227 & 0.079661 \tabularnewline
45 & -0.019695 & -0.1636 & 0.435263 \tabularnewline
46 & -0.059106 & -0.491 & 0.312501 \tabularnewline
47 & 0.021543 & 0.1789 & 0.429252 \tabularnewline
48 & -0.094413 & -0.7843 & 0.217787 \tabularnewline
49 & 0.003634 & 0.0302 & 0.488002 \tabularnewline
50 & 0.076226 & 0.6332 & 0.264354 \tabularnewline
51 & -0.069174 & -0.5746 & 0.283716 \tabularnewline
52 & 0.045828 & 0.3807 & 0.352306 \tabularnewline
53 & -0.032394 & -0.2691 & 0.394335 \tabularnewline
54 & -0.051938 & -0.4314 & 0.333752 \tabularnewline
55 & 5.7e-05 & 5e-04 & 0.499813 \tabularnewline
56 & -0.043854 & -0.3643 & 0.358382 \tabularnewline
57 & 0.027856 & 0.2314 & 0.408847 \tabularnewline
58 & -0.046571 & -0.3868 & 0.350029 \tabularnewline
59 & -0.068986 & -0.573 & 0.28424 \tabularnewline
60 & -0.070227 & -0.5833 & 0.28078 \tabularnewline
\hline
\end{tabular}
%Source: https://freestatistics.org/blog/index.php?pk=31567&T=2

[TABLE]
[ROW][C]Partial Autocorrelation Function[/C][/ROW]
[ROW][C]Time lag k[/C][C]PACF(k)[/C][C]T-STAT[/C][C]P-value[/C][/ROW]
[ROW][C]1[/C][C]0.401981[/C][C]3.3391[/C][C]0.000679[/C][/ROW]
[ROW][C]2[/C][C]0.064559[/C][C]0.5363[/C][C]0.296751[/C][/ROW]
[ROW][C]3[/C][C]-0.231399[/C][C]-1.9221[/C][C]0.029359[/C][/ROW]
[ROW][C]4[/C][C]-0.016933[/C][C]-0.1407[/C][C]0.444275[/C][/ROW]
[ROW][C]5[/C][C]-0.100928[/C][C]-0.8384[/C][C]0.202359[/C][/ROW]
[ROW][C]6[/C][C]-0.038101[/C][C]-0.3165[/C][C]0.376293[/C][/ROW]
[ROW][C]7[/C][C]0.034652[/C][C]0.2878[/C][C]0.387166[/C][/ROW]
[ROW][C]8[/C][C]-0.083816[/C][C]-0.6962[/C][C]0.244312[/C][/ROW]
[ROW][C]9[/C][C]-0.140106[/C][C]-1.1638[/C][C]0.124255[/C][/ROW]
[ROW][C]10[/C][C]0.094825[/C][C]0.7877[/C][C]0.216791[/C][/ROW]
[ROW][C]11[/C][C]-0.089851[/C][C]-0.7464[/C][C]0.228994[/C][/ROW]
[ROW][C]12[/C][C]-0.092028[/C][C]-0.7644[/C][C]0.223605[/C][/ROW]
[ROW][C]13[/C][C]-0.042973[/C][C]-0.357[/C][C]0.361104[/C][/ROW]
[ROW][C]14[/C][C]0.04359[/C][C]0.3621[/C][C]0.359198[/C][/ROW]
[ROW][C]15[/C][C]-0.041296[/C][C]-0.343[/C][C]0.36631[/C][/ROW]
[ROW][C]16[/C][C]-0.178418[/C][C]-1.4821[/C][C]0.071439[/C][/ROW]
[ROW][C]17[/C][C]-0.033779[/C][C]-0.2806[/C][C]0.389932[/C][/ROW]
[ROW][C]18[/C][C]-0.078978[/C][C]-0.656[/C][C]0.25699[/C][/ROW]
[ROW][C]19[/C][C]-0.011858[/C][C]-0.0985[/C][C]0.460911[/C][/ROW]
[ROW][C]20[/C][C]-0.064204[/C][C]-0.5333[/C][C]0.297763[/C][/ROW]
[ROW][C]21[/C][C]0.016657[/C][C]0.1384[/C][C]0.445177[/C][/ROW]
[ROW][C]22[/C][C]-0.085169[/C][C]-0.7075[/C][C]0.240831[/C][/ROW]
[ROW][C]23[/C][C]0.063367[/C][C]0.5264[/C][C]0.300161[/C][/ROW]
[ROW][C]24[/C][C]0.038117[/C][C]0.3166[/C][C]0.376242[/C][/ROW]
[ROW][C]25[/C][C]0.032756[/C][C]0.2721[/C][C]0.393183[/C][/ROW]
[ROW][C]26[/C][C]-0.057541[/C][C]-0.478[/C][C]0.317089[/C][/ROW]
[ROW][C]27[/C][C]-0.084867[/C][C]-0.705[/C][C]0.241605[/C][/ROW]
[ROW][C]28[/C][C]0.050197[/C][C]0.417[/C][C]0.338999[/C][/ROW]
[ROW][C]29[/C][C]-0.083086[/C][C]-0.6902[/C][C]0.246203[/C][/ROW]
[ROW][C]30[/C][C]-0.018065[/C][C]-0.1501[/C][C]0.440577[/C][/ROW]
[ROW][C]31[/C][C]-0.014132[/C][C]-0.1174[/C][C]0.453447[/C][/ROW]
[ROW][C]32[/C][C]-0.020754[/C][C]-0.1724[/C][C]0.431816[/C][/ROW]
[ROW][C]33[/C][C]-0.065561[/C][C]-0.5446[/C][C]0.293896[/C][/ROW]
[ROW][C]34[/C][C]0.081705[/C][C]0.6787[/C][C]0.2498[/C][/ROW]
[ROW][C]35[/C][C]0.047653[/C][C]0.3958[/C][C]0.346723[/C][/ROW]
[ROW][C]36[/C][C]-0.114503[/C][C]-0.9511[/C][C]0.172429[/C][/ROW]
[ROW][C]37[/C][C]0.025854[/C][C]0.2148[/C][C]0.415293[/C][/ROW]
[ROW][C]38[/C][C]-0.048495[/C][C]-0.4028[/C][C]0.344161[/C][/ROW]
[ROW][C]39[/C][C]0.024814[/C][C]0.2061[/C][C]0.418652[/C][/ROW]
[ROW][C]40[/C][C]0.020604[/C][C]0.1711[/C][C]0.432305[/C][/ROW]
[ROW][C]41[/C][C]0.040807[/C][C]0.339[/C][C]0.367832[/C][/ROW]
[ROW][C]42[/C][C]-0.101315[/C][C]-0.8416[/C][C]0.201464[/C][/ROW]
[ROW][C]43[/C][C]-0.092077[/C][C]-0.7648[/C][C]0.223485[/C][/ROW]
[ROW][C]44[/C][C]0.171276[/C][C]1.4227[/C][C]0.079661[/C][/ROW]
[ROW][C]45[/C][C]-0.019695[/C][C]-0.1636[/C][C]0.435263[/C][/ROW]
[ROW][C]46[/C][C]-0.059106[/C][C]-0.491[/C][C]0.312501[/C][/ROW]
[ROW][C]47[/C][C]0.021543[/C][C]0.1789[/C][C]0.429252[/C][/ROW]
[ROW][C]48[/C][C]-0.094413[/C][C]-0.7843[/C][C]0.217787[/C][/ROW]
[ROW][C]49[/C][C]0.003634[/C][C]0.0302[/C][C]0.488002[/C][/ROW]
[ROW][C]50[/C][C]0.076226[/C][C]0.6332[/C][C]0.264354[/C][/ROW]
[ROW][C]51[/C][C]-0.069174[/C][C]-0.5746[/C][C]0.283716[/C][/ROW]
[ROW][C]52[/C][C]0.045828[/C][C]0.3807[/C][C]0.352306[/C][/ROW]
[ROW][C]53[/C][C]-0.032394[/C][C]-0.2691[/C][C]0.394335[/C][/ROW]
[ROW][C]54[/C][C]-0.051938[/C][C]-0.4314[/C][C]0.333752[/C][/ROW]
[ROW][C]55[/C][C]5.7e-05[/C][C]5e-04[/C][C]0.499813[/C][/ROW]
[ROW][C]56[/C][C]-0.043854[/C][C]-0.3643[/C][C]0.358382[/C][/ROW]
[ROW][C]57[/C][C]0.027856[/C][C]0.2314[/C][C]0.408847[/C][/ROW]
[ROW][C]58[/C][C]-0.046571[/C][C]-0.3868[/C][C]0.350029[/C][/ROW]
[ROW][C]59[/C][C]-0.068986[/C][C]-0.573[/C][C]0.28424[/C][/ROW]
[ROW][C]60[/C][C]-0.070227[/C][C]-0.5833[/C][C]0.28078[/C][/ROW]
[/TABLE]
Source: https://freestatistics.org/blog/index.php?pk=31567&T=2

Globally Unique Identifier (entire table): ba.freestatistics.org/blog/index.php?pk=31567&T=2

As an alternative you can also use a QR Code:  

The GUIDs for individual cells are displayed in the table below:

Partial Autocorrelation Function
Time lag kPACF(k)T-STATP-value
10.4019813.33910.000679
20.0645590.53630.296751
3-0.231399-1.92210.029359
4-0.016933-0.14070.444275
5-0.100928-0.83840.202359
6-0.038101-0.31650.376293
70.0346520.28780.387166
8-0.083816-0.69620.244312
9-0.140106-1.16380.124255
100.0948250.78770.216791
11-0.089851-0.74640.228994
12-0.092028-0.76440.223605
13-0.042973-0.3570.361104
140.043590.36210.359198
15-0.041296-0.3430.36631
16-0.178418-1.48210.071439
17-0.033779-0.28060.389932
18-0.078978-0.6560.25699
19-0.011858-0.09850.460911
20-0.064204-0.53330.297763
210.0166570.13840.445177
22-0.085169-0.70750.240831
230.0633670.52640.300161
240.0381170.31660.376242
250.0327560.27210.393183
26-0.057541-0.4780.317089
27-0.084867-0.7050.241605
280.0501970.4170.338999
29-0.083086-0.69020.246203
30-0.018065-0.15010.440577
31-0.014132-0.11740.453447
32-0.020754-0.17240.431816
33-0.065561-0.54460.293896
340.0817050.67870.2498
350.0476530.39580.346723
36-0.114503-0.95110.172429
370.0258540.21480.415293
38-0.048495-0.40280.344161
390.0248140.20610.418652
400.0206040.17110.432305
410.0408070.3390.367832
42-0.101315-0.84160.201464
43-0.092077-0.76480.223485
440.1712761.42270.079661
45-0.019695-0.16360.435263
46-0.059106-0.4910.312501
470.0215430.17890.429252
48-0.094413-0.78430.217787
490.0036340.03020.488002
500.0762260.63320.264354
51-0.069174-0.57460.283716
520.0458280.38070.352306
53-0.032394-0.26910.394335
54-0.051938-0.43140.333752
555.7e-055e-040.499813
56-0.043854-0.36430.358382
570.0278560.23140.408847
58-0.046571-0.38680.350029
59-0.068986-0.5730.28424
60-0.070227-0.58330.28078


Parameters (Session):
par1 = 60 ; par2 = 1.0 ; par3 = 1 ; par4 = 0 ; par5 = 12 ;
Parameters (R input):
par1 = 60 ; par2 = 1.0 ; par3 = 1 ; par4 = 0 ; par5 = 12 ;
R code (references can be found in the software module):
if (par1 == 'Default') {
par1 = 10*log10(length(x))
} else {
par1 <- as.numeric(par1)
}
par2 <- as.numeric(par2)
par3 <- as.numeric(par3)
par4 <- as.numeric(par4)
par5 <- as.numeric(par5)
if (par2 == 0) {
x <- log(x)
} else {
x <- (x ^ par2 - 1) / par2
}
if (par3 > 0) x <- diff(x,lag=1,difference=par3)
if (par4 > 0) x <- diff(x,lag=par5,difference=par4)
bitmap(file='pic1.png')
racf <- acf(x,par1,main='Autocorrelation',xlab='lags',ylab='ACF')
dev.off()
bitmap(file='pic2.png')
rpacf <- pacf(x,par1,main='Partial Autocorrelation',xlab='lags',ylab='PACF')
dev.off()
(myacf <- c(racf$acf))
(mypacf <- c(rpacf$acf))
lengthx <- length(x)
sqrtn <- sqrt(lengthx)
load(file='createtable')
a<-table.start()
a<-table.row.start(a)
a<-table.element(a,'Autocorrelation Function',4,TRUE)
a<-table.row.end(a)
a<-table.row.start(a)
a<-table.element(a,'Time lag k',header=TRUE)
a<-table.element(a,hyperlink('basics.htm','ACF(k)','click here for more information about the Autocorrelation Function'),header=TRUE)
a<-table.element(a,'T-STAT',header=TRUE)
a<-table.element(a,'P-value',header=TRUE)
a<-table.row.end(a)
for (i in 2:(par1+1)) {
a<-table.row.start(a)
a<-table.element(a,i-1,header=TRUE)
a<-table.element(a,round(myacf[i],6))
mytstat <- myacf[i]*sqrtn
a<-table.element(a,round(mytstat,4))
a<-table.element(a,round(1-pt(abs(mytstat),lengthx),6))
a<-table.row.end(a)
}
a<-table.end(a)
table.save(a,file='mytable.tab')
a<-table.start()
a<-table.row.start(a)
a<-table.element(a,'Partial Autocorrelation Function',4,TRUE)
a<-table.row.end(a)
a<-table.row.start(a)
a<-table.element(a,'Time lag k',header=TRUE)
a<-table.element(a,hyperlink('basics.htm','PACF(k)','click here for more information about the Partial Autocorrelation Function'),header=TRUE)
a<-table.element(a,'T-STAT',header=TRUE)
a<-table.element(a,'P-value',header=TRUE)
a<-table.row.end(a)
for (i in 1:par1) {
a<-table.row.start(a)
a<-table.element(a,i,header=TRUE)
a<-table.element(a,round(mypacf[i],6))
mytstat <- mypacf[i]*sqrtn
a<-table.element(a,round(mytstat,4))
a<-table.element(a,round(1-pt(abs(mytstat),lengthx),6))
a<-table.row.end(a)
}
a<-table.end(a)
table.save(a,file='mytable1.tab')