Free Statistics

of Irreproducible Research!

Author's title

Author*The author of this computation has been verified*
R Software Modulerwasp_autocorrelation.wasp
Title produced by software(Partial) Autocorrelation Function
Date of computationTue, 09 Dec 2008 09:02:19 -0700
Cite this page as followsStatistical Computations at FreeStatistics.org, Office for Research Development and Education, URL https://freestatistics.org/blog/index.php?v=date/2008/Dec/09/t1228838660yfqppjv7upwmg6z.htm/, Retrieved Sun, 19 May 2024 09:15:44 +0000
Statistical Computations at FreeStatistics.org, Office for Research Development and Education, URL https://freestatistics.org/blog/index.php?pk=31547, Retrieved Sun, 19 May 2024 09:15:44 +0000
QR Codes:

Original text written by user:
IsPrivate?No (this computation is public)
User-defined keywords
Estimated Impact206
Family? (F = Feedback message, R = changed R code, M = changed R Module, P = changed Parameters, D = changed Data)
-     [Univariate Data Series] [data set] [2008-12-01 19:54:57] [b98453cac15ba1066b407e146608df68]
F RMP   [Standard Deviation-Mean Plot] [sdm ] [2008-12-05 13:33:27] [de72ca3f4fcfd0997c84e1ac92aea119]
F RM D    [Variance Reduction Matrix] [Q2 eigen tijdreeks] [2008-12-06 10:45:14] [de72ca3f4fcfd0997c84e1ac92aea119]
F RMP         [(Partial) Autocorrelation Function] [step 3] [2008-12-09 16:02:19] [56fd94b954e08a6655cb7790b21ee404] [Current]
Feedback Forum
2008-12-14 14:27:02 [Hannes Van Hoof] [reply
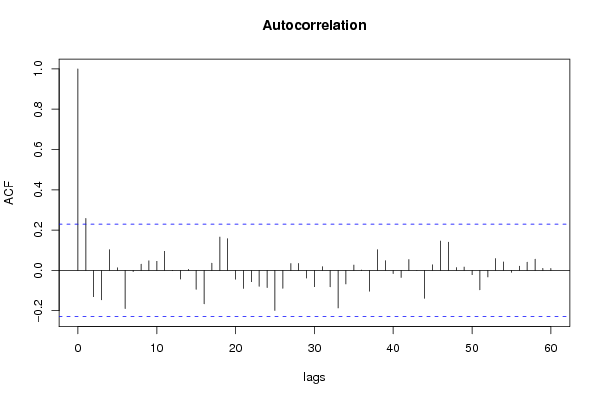
Je hebt de goede differentiatie gebruikt. Zowel op de ACF en de cumulatieve periodogram is de trend verdwenen.
Het trapvormige verloop van de cumulatieve periodogram is volgens mij niet uitgesproken genoeg om over seizoenaliteit te spreken.
2008-12-14 14:31:08 [Hannes Van Hoof] [reply
step4
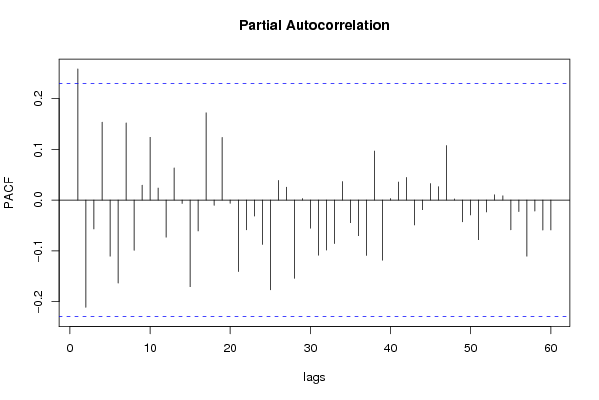
Ik vind hier ook geen AR proces in terug.
Wanneer we kijken naar de PACF, heb je gelijk dat er zowel een niet seizoenaal als een seizoenaal MA proces aanwezig is.

Post a new message
Dataseries X:
0.9059
0.8883
0.8924
0.8833
0.87
0.8758
0.8858
0.917
0.9554
0.9922
0.9778
0.9808
0.9811
1.0014
1.0183
1.0622
1.0773
1.0807
1.0848
1.1582
1.1663
1.1372
1.1139
1.1222
1.1692
1.1702
1.2286
1.2613
1.2646
1.2262
1.1985
1.2007
1.2138
1.2266
1.2176
1.2218
1.249
1.2991
1.3408
1.3119
1.3014
1.3201
1.2938
1.2694
1.2165
1.2037
1.2292
1.2256
1.2015
1.1786
1.1856
1.2103
1.1938
1.202
1.2271
1.277
1.265
1.2684
1.2811
1.2727
1.2611
1.2881
1.3213
1.2999
1.3074
1.3242
1.3516
1.3511
1.3419
1.3716
1.3622
1.3896
1.4227
1.4684


Summary of computational transaction
Raw Inputview raw input (R code)
Raw Outputview raw output of R engine
Computing time3 seconds
R Server'Herman Ole Andreas Wold' @ 193.190.124.10:1001

\begin{tabular}{lllllllll}
\hline
Summary of computational transaction \tabularnewline
Raw Input & view raw input (R code)  \tabularnewline
Raw Output & view raw output of R engine  \tabularnewline
Computing time & 3 seconds \tabularnewline
R Server & 'Herman Ole Andreas Wold' @ 193.190.124.10:1001 \tabularnewline
\hline
\end{tabular}
%Source: https://freestatistics.org/blog/index.php?pk=31547&T=0

[TABLE]
[ROW][C]Summary of computational transaction[/C][/ROW]
[ROW][C]Raw Input[/C][C]view raw input (R code) [/C][/ROW]
[ROW][C]Raw Output[/C][C]view raw output of R engine [/C][/ROW]
[ROW][C]Computing time[/C][C]3 seconds[/C][/ROW]
[ROW][C]R Server[/C][C]'Herman Ole Andreas Wold' @ 193.190.124.10:1001[/C][/ROW]
[/TABLE]
Source: https://freestatistics.org/blog/index.php?pk=31547&T=0

Globally Unique Identifier (entire table): ba.freestatistics.org/blog/index.php?pk=31547&T=0

As an alternative you can also use a QR Code:  

The GUIDs for individual cells are displayed in the table below:

Summary of computational transaction
Raw Inputview raw input (R code)
Raw Outputview raw output of R engine
Computing time3 seconds
R Server'Herman Ole Andreas Wold' @ 193.190.124.10:1001


Autocorrelation Function
Time lag kACF(k)T-STATP-value
10.2581952.2060.015265
2-0.130307-1.11330.134607
3-0.145946-1.2470.108199
40.1029920.880.190884
50.0129340.11050.456156
6-0.189041-1.61520.055294
7-0.005797-0.04950.480315
80.0312810.26730.395008
90.0476810.40740.34246
100.0454120.3880.349574
110.0950440.81210.209699
12-0.001117-0.00950.496205
13-0.042794-0.36560.357848
140.005270.0450.482105
15-0.093776-0.80120.212802
16-0.165475-1.41380.080833
170.0360140.30770.379591
180.1654281.41340.080892
190.1574141.34490.091403
20-0.043275-0.36970.356324
21-0.089094-0.76120.224488
22-0.05598-0.47830.316934
23-0.079046-0.67540.250787
24-0.084888-0.72530.235298
25-0.198598-1.69680.046995
26-0.088942-0.75990.224873
270.0341330.29160.385697
280.0346450.2960.384034
29-0.038013-0.32480.373138
30-0.080807-0.69040.246061
310.018780.16050.436484
32-0.0811-0.69290.24528
33-0.186303-1.59180.057879
34-0.066738-0.57020.285143
350.0265570.22690.410567
360.0016670.01420.494338
37-0.102908-0.87920.191076
380.1027910.87820.191346
390.0483150.41280.340479
40-0.015672-0.13390.446923
41-0.034723-0.29670.383778
420.0539010.46050.323253
43-9.6e-05-8e-040.499672
44-0.138531-1.18360.120204
450.0280880.240.405509
460.1457771.24550.108461
470.1403231.19890.117218
480.0144940.12380.450894
490.0167960.14350.443142
50-0.02139-0.18280.427747
51-0.096054-0.82070.207248
52-0.032065-0.2740.392442
530.0590230.50430.307789
540.042160.36020.359862
55-0.009228-0.07880.468688
560.0211310.18050.428615
570.0411360.35150.363125
580.0558130.47690.31744
590.0102420.08750.465254
600.0099190.08480.466346

\begin{tabular}{lllllllll}
\hline
Autocorrelation Function \tabularnewline
Time lag k & ACF(k) & T-STAT & P-value \tabularnewline
1 & 0.258195 & 2.206 & 0.015265 \tabularnewline
2 & -0.130307 & -1.1133 & 0.134607 \tabularnewline
3 & -0.145946 & -1.247 & 0.108199 \tabularnewline
4 & 0.102992 & 0.88 & 0.190884 \tabularnewline
5 & 0.012934 & 0.1105 & 0.456156 \tabularnewline
6 & -0.189041 & -1.6152 & 0.055294 \tabularnewline
7 & -0.005797 & -0.0495 & 0.480315 \tabularnewline
8 & 0.031281 & 0.2673 & 0.395008 \tabularnewline
9 & 0.047681 & 0.4074 & 0.34246 \tabularnewline
10 & 0.045412 & 0.388 & 0.349574 \tabularnewline
11 & 0.095044 & 0.8121 & 0.209699 \tabularnewline
12 & -0.001117 & -0.0095 & 0.496205 \tabularnewline
13 & -0.042794 & -0.3656 & 0.357848 \tabularnewline
14 & 0.00527 & 0.045 & 0.482105 \tabularnewline
15 & -0.093776 & -0.8012 & 0.212802 \tabularnewline
16 & -0.165475 & -1.4138 & 0.080833 \tabularnewline
17 & 0.036014 & 0.3077 & 0.379591 \tabularnewline
18 & 0.165428 & 1.4134 & 0.080892 \tabularnewline
19 & 0.157414 & 1.3449 & 0.091403 \tabularnewline
20 & -0.043275 & -0.3697 & 0.356324 \tabularnewline
21 & -0.089094 & -0.7612 & 0.224488 \tabularnewline
22 & -0.05598 & -0.4783 & 0.316934 \tabularnewline
23 & -0.079046 & -0.6754 & 0.250787 \tabularnewline
24 & -0.084888 & -0.7253 & 0.235298 \tabularnewline
25 & -0.198598 & -1.6968 & 0.046995 \tabularnewline
26 & -0.088942 & -0.7599 & 0.224873 \tabularnewline
27 & 0.034133 & 0.2916 & 0.385697 \tabularnewline
28 & 0.034645 & 0.296 & 0.384034 \tabularnewline
29 & -0.038013 & -0.3248 & 0.373138 \tabularnewline
30 & -0.080807 & -0.6904 & 0.246061 \tabularnewline
31 & 0.01878 & 0.1605 & 0.436484 \tabularnewline
32 & -0.0811 & -0.6929 & 0.24528 \tabularnewline
33 & -0.186303 & -1.5918 & 0.057879 \tabularnewline
34 & -0.066738 & -0.5702 & 0.285143 \tabularnewline
35 & 0.026557 & 0.2269 & 0.410567 \tabularnewline
36 & 0.001667 & 0.0142 & 0.494338 \tabularnewline
37 & -0.102908 & -0.8792 & 0.191076 \tabularnewline
38 & 0.102791 & 0.8782 & 0.191346 \tabularnewline
39 & 0.048315 & 0.4128 & 0.340479 \tabularnewline
40 & -0.015672 & -0.1339 & 0.446923 \tabularnewline
41 & -0.034723 & -0.2967 & 0.383778 \tabularnewline
42 & 0.053901 & 0.4605 & 0.323253 \tabularnewline
43 & -9.6e-05 & -8e-04 & 0.499672 \tabularnewline
44 & -0.138531 & -1.1836 & 0.120204 \tabularnewline
45 & 0.028088 & 0.24 & 0.405509 \tabularnewline
46 & 0.145777 & 1.2455 & 0.108461 \tabularnewline
47 & 0.140323 & 1.1989 & 0.117218 \tabularnewline
48 & 0.014494 & 0.1238 & 0.450894 \tabularnewline
49 & 0.016796 & 0.1435 & 0.443142 \tabularnewline
50 & -0.02139 & -0.1828 & 0.427747 \tabularnewline
51 & -0.096054 & -0.8207 & 0.207248 \tabularnewline
52 & -0.032065 & -0.274 & 0.392442 \tabularnewline
53 & 0.059023 & 0.5043 & 0.307789 \tabularnewline
54 & 0.04216 & 0.3602 & 0.359862 \tabularnewline
55 & -0.009228 & -0.0788 & 0.468688 \tabularnewline
56 & 0.021131 & 0.1805 & 0.428615 \tabularnewline
57 & 0.041136 & 0.3515 & 0.363125 \tabularnewline
58 & 0.055813 & 0.4769 & 0.31744 \tabularnewline
59 & 0.010242 & 0.0875 & 0.465254 \tabularnewline
60 & 0.009919 & 0.0848 & 0.466346 \tabularnewline
\hline
\end{tabular}
%Source: https://freestatistics.org/blog/index.php?pk=31547&T=1

[TABLE]
[ROW][C]Autocorrelation Function[/C][/ROW]
[ROW][C]Time lag k[/C][C]ACF(k)[/C][C]T-STAT[/C][C]P-value[/C][/ROW]
[ROW][C]1[/C][C]0.258195[/C][C]2.206[/C][C]0.015265[/C][/ROW]
[ROW][C]2[/C][C]-0.130307[/C][C]-1.1133[/C][C]0.134607[/C][/ROW]
[ROW][C]3[/C][C]-0.145946[/C][C]-1.247[/C][C]0.108199[/C][/ROW]
[ROW][C]4[/C][C]0.102992[/C][C]0.88[/C][C]0.190884[/C][/ROW]
[ROW][C]5[/C][C]0.012934[/C][C]0.1105[/C][C]0.456156[/C][/ROW]
[ROW][C]6[/C][C]-0.189041[/C][C]-1.6152[/C][C]0.055294[/C][/ROW]
[ROW][C]7[/C][C]-0.005797[/C][C]-0.0495[/C][C]0.480315[/C][/ROW]
[ROW][C]8[/C][C]0.031281[/C][C]0.2673[/C][C]0.395008[/C][/ROW]
[ROW][C]9[/C][C]0.047681[/C][C]0.4074[/C][C]0.34246[/C][/ROW]
[ROW][C]10[/C][C]0.045412[/C][C]0.388[/C][C]0.349574[/C][/ROW]
[ROW][C]11[/C][C]0.095044[/C][C]0.8121[/C][C]0.209699[/C][/ROW]
[ROW][C]12[/C][C]-0.001117[/C][C]-0.0095[/C][C]0.496205[/C][/ROW]
[ROW][C]13[/C][C]-0.042794[/C][C]-0.3656[/C][C]0.357848[/C][/ROW]
[ROW][C]14[/C][C]0.00527[/C][C]0.045[/C][C]0.482105[/C][/ROW]
[ROW][C]15[/C][C]-0.093776[/C][C]-0.8012[/C][C]0.212802[/C][/ROW]
[ROW][C]16[/C][C]-0.165475[/C][C]-1.4138[/C][C]0.080833[/C][/ROW]
[ROW][C]17[/C][C]0.036014[/C][C]0.3077[/C][C]0.379591[/C][/ROW]
[ROW][C]18[/C][C]0.165428[/C][C]1.4134[/C][C]0.080892[/C][/ROW]
[ROW][C]19[/C][C]0.157414[/C][C]1.3449[/C][C]0.091403[/C][/ROW]
[ROW][C]20[/C][C]-0.043275[/C][C]-0.3697[/C][C]0.356324[/C][/ROW]
[ROW][C]21[/C][C]-0.089094[/C][C]-0.7612[/C][C]0.224488[/C][/ROW]
[ROW][C]22[/C][C]-0.05598[/C][C]-0.4783[/C][C]0.316934[/C][/ROW]
[ROW][C]23[/C][C]-0.079046[/C][C]-0.6754[/C][C]0.250787[/C][/ROW]
[ROW][C]24[/C][C]-0.084888[/C][C]-0.7253[/C][C]0.235298[/C][/ROW]
[ROW][C]25[/C][C]-0.198598[/C][C]-1.6968[/C][C]0.046995[/C][/ROW]
[ROW][C]26[/C][C]-0.088942[/C][C]-0.7599[/C][C]0.224873[/C][/ROW]
[ROW][C]27[/C][C]0.034133[/C][C]0.2916[/C][C]0.385697[/C][/ROW]
[ROW][C]28[/C][C]0.034645[/C][C]0.296[/C][C]0.384034[/C][/ROW]
[ROW][C]29[/C][C]-0.038013[/C][C]-0.3248[/C][C]0.373138[/C][/ROW]
[ROW][C]30[/C][C]-0.080807[/C][C]-0.6904[/C][C]0.246061[/C][/ROW]
[ROW][C]31[/C][C]0.01878[/C][C]0.1605[/C][C]0.436484[/C][/ROW]
[ROW][C]32[/C][C]-0.0811[/C][C]-0.6929[/C][C]0.24528[/C][/ROW]
[ROW][C]33[/C][C]-0.186303[/C][C]-1.5918[/C][C]0.057879[/C][/ROW]
[ROW][C]34[/C][C]-0.066738[/C][C]-0.5702[/C][C]0.285143[/C][/ROW]
[ROW][C]35[/C][C]0.026557[/C][C]0.2269[/C][C]0.410567[/C][/ROW]
[ROW][C]36[/C][C]0.001667[/C][C]0.0142[/C][C]0.494338[/C][/ROW]
[ROW][C]37[/C][C]-0.102908[/C][C]-0.8792[/C][C]0.191076[/C][/ROW]
[ROW][C]38[/C][C]0.102791[/C][C]0.8782[/C][C]0.191346[/C][/ROW]
[ROW][C]39[/C][C]0.048315[/C][C]0.4128[/C][C]0.340479[/C][/ROW]
[ROW][C]40[/C][C]-0.015672[/C][C]-0.1339[/C][C]0.446923[/C][/ROW]
[ROW][C]41[/C][C]-0.034723[/C][C]-0.2967[/C][C]0.383778[/C][/ROW]
[ROW][C]42[/C][C]0.053901[/C][C]0.4605[/C][C]0.323253[/C][/ROW]
[ROW][C]43[/C][C]-9.6e-05[/C][C]-8e-04[/C][C]0.499672[/C][/ROW]
[ROW][C]44[/C][C]-0.138531[/C][C]-1.1836[/C][C]0.120204[/C][/ROW]
[ROW][C]45[/C][C]0.028088[/C][C]0.24[/C][C]0.405509[/C][/ROW]
[ROW][C]46[/C][C]0.145777[/C][C]1.2455[/C][C]0.108461[/C][/ROW]
[ROW][C]47[/C][C]0.140323[/C][C]1.1989[/C][C]0.117218[/C][/ROW]
[ROW][C]48[/C][C]0.014494[/C][C]0.1238[/C][C]0.450894[/C][/ROW]
[ROW][C]49[/C][C]0.016796[/C][C]0.1435[/C][C]0.443142[/C][/ROW]
[ROW][C]50[/C][C]-0.02139[/C][C]-0.1828[/C][C]0.427747[/C][/ROW]
[ROW][C]51[/C][C]-0.096054[/C][C]-0.8207[/C][C]0.207248[/C][/ROW]
[ROW][C]52[/C][C]-0.032065[/C][C]-0.274[/C][C]0.392442[/C][/ROW]
[ROW][C]53[/C][C]0.059023[/C][C]0.5043[/C][C]0.307789[/C][/ROW]
[ROW][C]54[/C][C]0.04216[/C][C]0.3602[/C][C]0.359862[/C][/ROW]
[ROW][C]55[/C][C]-0.009228[/C][C]-0.0788[/C][C]0.468688[/C][/ROW]
[ROW][C]56[/C][C]0.021131[/C][C]0.1805[/C][C]0.428615[/C][/ROW]
[ROW][C]57[/C][C]0.041136[/C][C]0.3515[/C][C]0.363125[/C][/ROW]
[ROW][C]58[/C][C]0.055813[/C][C]0.4769[/C][C]0.31744[/C][/ROW]
[ROW][C]59[/C][C]0.010242[/C][C]0.0875[/C][C]0.465254[/C][/ROW]
[ROW][C]60[/C][C]0.009919[/C][C]0.0848[/C][C]0.466346[/C][/ROW]
[/TABLE]
Source: https://freestatistics.org/blog/index.php?pk=31547&T=1

Globally Unique Identifier (entire table): ba.freestatistics.org/blog/index.php?pk=31547&T=1

As an alternative you can also use a QR Code:  

The GUIDs for individual cells are displayed in the table below:

Autocorrelation Function
Time lag kACF(k)T-STATP-value
10.2581952.2060.015265
2-0.130307-1.11330.134607
3-0.145946-1.2470.108199
40.1029920.880.190884
50.0129340.11050.456156
6-0.189041-1.61520.055294
7-0.005797-0.04950.480315
80.0312810.26730.395008
90.0476810.40740.34246
100.0454120.3880.349574
110.0950440.81210.209699
12-0.001117-0.00950.496205
13-0.042794-0.36560.357848
140.005270.0450.482105
15-0.093776-0.80120.212802
16-0.165475-1.41380.080833
170.0360140.30770.379591
180.1654281.41340.080892
190.1574141.34490.091403
20-0.043275-0.36970.356324
21-0.089094-0.76120.224488
22-0.05598-0.47830.316934
23-0.079046-0.67540.250787
24-0.084888-0.72530.235298
25-0.198598-1.69680.046995
26-0.088942-0.75990.224873
270.0341330.29160.385697
280.0346450.2960.384034
29-0.038013-0.32480.373138
30-0.080807-0.69040.246061
310.018780.16050.436484
32-0.0811-0.69290.24528
33-0.186303-1.59180.057879
34-0.066738-0.57020.285143
350.0265570.22690.410567
360.0016670.01420.494338
37-0.102908-0.87920.191076
380.1027910.87820.191346
390.0483150.41280.340479
40-0.015672-0.13390.446923
41-0.034723-0.29670.383778
420.0539010.46050.323253
43-9.6e-05-8e-040.499672
44-0.138531-1.18360.120204
450.0280880.240.405509
460.1457771.24550.108461
470.1403231.19890.117218
480.0144940.12380.450894
490.0167960.14350.443142
50-0.02139-0.18280.427747
51-0.096054-0.82070.207248
52-0.032065-0.2740.392442
530.0590230.50430.307789
540.042160.36020.359862
55-0.009228-0.07880.468688
560.0211310.18050.428615
570.0411360.35150.363125
580.0558130.47690.31744
590.0102420.08750.465254
600.0099190.08480.466346


Partial Autocorrelation Function
Time lag kPACF(k)T-STATP-value
10.2581952.2060.015265
2-0.21104-1.80310.037747
3-0.056866-0.48590.314259
40.1534231.31080.09701
5-0.110426-0.94350.174274
6-0.163234-1.39470.083672
70.1519031.29790.099211
8-0.098886-0.84490.200469
90.0294580.25170.400994
100.1235251.05540.147362
110.0236760.20230.420126
12-0.072889-0.62280.267689
130.0634340.5420.294742
14-0.006425-0.05490.478185
15-0.170327-1.45530.07494
16-0.060702-0.51860.302792
170.1718291.46810.073186
18-0.010297-0.0880.465066
190.1233351.05380.147731
20-0.006246-0.05340.478794
21-0.14076-1.20270.116498
22-0.058409-0.4990.309625
23-0.031407-0.26830.394596
24-0.087218-0.74520.229274
25-0.176483-1.50790.067952
260.038770.33120.370702
270.0253540.21660.414553
28-0.153957-1.31540.096244
290.0030120.02570.489771
30-0.055258-0.47210.319122
31-0.108438-0.92650.178622
32-0.098267-0.83960.201939
33-0.085526-0.73070.23364
340.0366410.31310.377562
35-0.044317-0.37860.353024
36-0.069975-0.59790.275891
37-0.108974-0.93110.177443
380.096460.82420.206268
39-0.118332-1.0110.15767
400.0030.02560.489811
410.0354340.30280.38147
420.0445590.38070.35226
43-0.048764-0.41660.339082
44-0.018856-0.16110.436228
450.0327040.27940.390356
460.0263230.22490.411343
470.1073390.91710.181055
480.0022450.01920.492374
49-0.042786-0.36560.357875
50-0.029204-0.24950.401829
51-0.077783-0.66460.254206
52-0.023203-0.19820.421703
530.0103380.08830.464929
540.0085970.07340.470824
55-0.058414-0.49910.309609
56-0.022567-0.19280.42382
57-0.110374-0.9430.174387
58-0.021547-0.18410.427223
59-0.059024-0.50430.307785
60-0.058585-0.50050.309098

\begin{tabular}{lllllllll}
\hline
Partial Autocorrelation Function \tabularnewline
Time lag k & PACF(k) & T-STAT & P-value \tabularnewline
1 & 0.258195 & 2.206 & 0.015265 \tabularnewline
2 & -0.21104 & -1.8031 & 0.037747 \tabularnewline
3 & -0.056866 & -0.4859 & 0.314259 \tabularnewline
4 & 0.153423 & 1.3108 & 0.09701 \tabularnewline
5 & -0.110426 & -0.9435 & 0.174274 \tabularnewline
6 & -0.163234 & -1.3947 & 0.083672 \tabularnewline
7 & 0.151903 & 1.2979 & 0.099211 \tabularnewline
8 & -0.098886 & -0.8449 & 0.200469 \tabularnewline
9 & 0.029458 & 0.2517 & 0.400994 \tabularnewline
10 & 0.123525 & 1.0554 & 0.147362 \tabularnewline
11 & 0.023676 & 0.2023 & 0.420126 \tabularnewline
12 & -0.072889 & -0.6228 & 0.267689 \tabularnewline
13 & 0.063434 & 0.542 & 0.294742 \tabularnewline
14 & -0.006425 & -0.0549 & 0.478185 \tabularnewline
15 & -0.170327 & -1.4553 & 0.07494 \tabularnewline
16 & -0.060702 & -0.5186 & 0.302792 \tabularnewline
17 & 0.171829 & 1.4681 & 0.073186 \tabularnewline
18 & -0.010297 & -0.088 & 0.465066 \tabularnewline
19 & 0.123335 & 1.0538 & 0.147731 \tabularnewline
20 & -0.006246 & -0.0534 & 0.478794 \tabularnewline
21 & -0.14076 & -1.2027 & 0.116498 \tabularnewline
22 & -0.058409 & -0.499 & 0.309625 \tabularnewline
23 & -0.031407 & -0.2683 & 0.394596 \tabularnewline
24 & -0.087218 & -0.7452 & 0.229274 \tabularnewline
25 & -0.176483 & -1.5079 & 0.067952 \tabularnewline
26 & 0.03877 & 0.3312 & 0.370702 \tabularnewline
27 & 0.025354 & 0.2166 & 0.414553 \tabularnewline
28 & -0.153957 & -1.3154 & 0.096244 \tabularnewline
29 & 0.003012 & 0.0257 & 0.489771 \tabularnewline
30 & -0.055258 & -0.4721 & 0.319122 \tabularnewline
31 & -0.108438 & -0.9265 & 0.178622 \tabularnewline
32 & -0.098267 & -0.8396 & 0.201939 \tabularnewline
33 & -0.085526 & -0.7307 & 0.23364 \tabularnewline
34 & 0.036641 & 0.3131 & 0.377562 \tabularnewline
35 & -0.044317 & -0.3786 & 0.353024 \tabularnewline
36 & -0.069975 & -0.5979 & 0.275891 \tabularnewline
37 & -0.108974 & -0.9311 & 0.177443 \tabularnewline
38 & 0.09646 & 0.8242 & 0.206268 \tabularnewline
39 & -0.118332 & -1.011 & 0.15767 \tabularnewline
40 & 0.003 & 0.0256 & 0.489811 \tabularnewline
41 & 0.035434 & 0.3028 & 0.38147 \tabularnewline
42 & 0.044559 & 0.3807 & 0.35226 \tabularnewline
43 & -0.048764 & -0.4166 & 0.339082 \tabularnewline
44 & -0.018856 & -0.1611 & 0.436228 \tabularnewline
45 & 0.032704 & 0.2794 & 0.390356 \tabularnewline
46 & 0.026323 & 0.2249 & 0.411343 \tabularnewline
47 & 0.107339 & 0.9171 & 0.181055 \tabularnewline
48 & 0.002245 & 0.0192 & 0.492374 \tabularnewline
49 & -0.042786 & -0.3656 & 0.357875 \tabularnewline
50 & -0.029204 & -0.2495 & 0.401829 \tabularnewline
51 & -0.077783 & -0.6646 & 0.254206 \tabularnewline
52 & -0.023203 & -0.1982 & 0.421703 \tabularnewline
53 & 0.010338 & 0.0883 & 0.464929 \tabularnewline
54 & 0.008597 & 0.0734 & 0.470824 \tabularnewline
55 & -0.058414 & -0.4991 & 0.309609 \tabularnewline
56 & -0.022567 & -0.1928 & 0.42382 \tabularnewline
57 & -0.110374 & -0.943 & 0.174387 \tabularnewline
58 & -0.021547 & -0.1841 & 0.427223 \tabularnewline
59 & -0.059024 & -0.5043 & 0.307785 \tabularnewline
60 & -0.058585 & -0.5005 & 0.309098 \tabularnewline
\hline
\end{tabular}
%Source: https://freestatistics.org/blog/index.php?pk=31547&T=2

[TABLE]
[ROW][C]Partial Autocorrelation Function[/C][/ROW]
[ROW][C]Time lag k[/C][C]PACF(k)[/C][C]T-STAT[/C][C]P-value[/C][/ROW]
[ROW][C]1[/C][C]0.258195[/C][C]2.206[/C][C]0.015265[/C][/ROW]
[ROW][C]2[/C][C]-0.21104[/C][C]-1.8031[/C][C]0.037747[/C][/ROW]
[ROW][C]3[/C][C]-0.056866[/C][C]-0.4859[/C][C]0.314259[/C][/ROW]
[ROW][C]4[/C][C]0.153423[/C][C]1.3108[/C][C]0.09701[/C][/ROW]
[ROW][C]5[/C][C]-0.110426[/C][C]-0.9435[/C][C]0.174274[/C][/ROW]
[ROW][C]6[/C][C]-0.163234[/C][C]-1.3947[/C][C]0.083672[/C][/ROW]
[ROW][C]7[/C][C]0.151903[/C][C]1.2979[/C][C]0.099211[/C][/ROW]
[ROW][C]8[/C][C]-0.098886[/C][C]-0.8449[/C][C]0.200469[/C][/ROW]
[ROW][C]9[/C][C]0.029458[/C][C]0.2517[/C][C]0.400994[/C][/ROW]
[ROW][C]10[/C][C]0.123525[/C][C]1.0554[/C][C]0.147362[/C][/ROW]
[ROW][C]11[/C][C]0.023676[/C][C]0.2023[/C][C]0.420126[/C][/ROW]
[ROW][C]12[/C][C]-0.072889[/C][C]-0.6228[/C][C]0.267689[/C][/ROW]
[ROW][C]13[/C][C]0.063434[/C][C]0.542[/C][C]0.294742[/C][/ROW]
[ROW][C]14[/C][C]-0.006425[/C][C]-0.0549[/C][C]0.478185[/C][/ROW]
[ROW][C]15[/C][C]-0.170327[/C][C]-1.4553[/C][C]0.07494[/C][/ROW]
[ROW][C]16[/C][C]-0.060702[/C][C]-0.5186[/C][C]0.302792[/C][/ROW]
[ROW][C]17[/C][C]0.171829[/C][C]1.4681[/C][C]0.073186[/C][/ROW]
[ROW][C]18[/C][C]-0.010297[/C][C]-0.088[/C][C]0.465066[/C][/ROW]
[ROW][C]19[/C][C]0.123335[/C][C]1.0538[/C][C]0.147731[/C][/ROW]
[ROW][C]20[/C][C]-0.006246[/C][C]-0.0534[/C][C]0.478794[/C][/ROW]
[ROW][C]21[/C][C]-0.14076[/C][C]-1.2027[/C][C]0.116498[/C][/ROW]
[ROW][C]22[/C][C]-0.058409[/C][C]-0.499[/C][C]0.309625[/C][/ROW]
[ROW][C]23[/C][C]-0.031407[/C][C]-0.2683[/C][C]0.394596[/C][/ROW]
[ROW][C]24[/C][C]-0.087218[/C][C]-0.7452[/C][C]0.229274[/C][/ROW]
[ROW][C]25[/C][C]-0.176483[/C][C]-1.5079[/C][C]0.067952[/C][/ROW]
[ROW][C]26[/C][C]0.03877[/C][C]0.3312[/C][C]0.370702[/C][/ROW]
[ROW][C]27[/C][C]0.025354[/C][C]0.2166[/C][C]0.414553[/C][/ROW]
[ROW][C]28[/C][C]-0.153957[/C][C]-1.3154[/C][C]0.096244[/C][/ROW]
[ROW][C]29[/C][C]0.003012[/C][C]0.0257[/C][C]0.489771[/C][/ROW]
[ROW][C]30[/C][C]-0.055258[/C][C]-0.4721[/C][C]0.319122[/C][/ROW]
[ROW][C]31[/C][C]-0.108438[/C][C]-0.9265[/C][C]0.178622[/C][/ROW]
[ROW][C]32[/C][C]-0.098267[/C][C]-0.8396[/C][C]0.201939[/C][/ROW]
[ROW][C]33[/C][C]-0.085526[/C][C]-0.7307[/C][C]0.23364[/C][/ROW]
[ROW][C]34[/C][C]0.036641[/C][C]0.3131[/C][C]0.377562[/C][/ROW]
[ROW][C]35[/C][C]-0.044317[/C][C]-0.3786[/C][C]0.353024[/C][/ROW]
[ROW][C]36[/C][C]-0.069975[/C][C]-0.5979[/C][C]0.275891[/C][/ROW]
[ROW][C]37[/C][C]-0.108974[/C][C]-0.9311[/C][C]0.177443[/C][/ROW]
[ROW][C]38[/C][C]0.09646[/C][C]0.8242[/C][C]0.206268[/C][/ROW]
[ROW][C]39[/C][C]-0.118332[/C][C]-1.011[/C][C]0.15767[/C][/ROW]
[ROW][C]40[/C][C]0.003[/C][C]0.0256[/C][C]0.489811[/C][/ROW]
[ROW][C]41[/C][C]0.035434[/C][C]0.3028[/C][C]0.38147[/C][/ROW]
[ROW][C]42[/C][C]0.044559[/C][C]0.3807[/C][C]0.35226[/C][/ROW]
[ROW][C]43[/C][C]-0.048764[/C][C]-0.4166[/C][C]0.339082[/C][/ROW]
[ROW][C]44[/C][C]-0.018856[/C][C]-0.1611[/C][C]0.436228[/C][/ROW]
[ROW][C]45[/C][C]0.032704[/C][C]0.2794[/C][C]0.390356[/C][/ROW]
[ROW][C]46[/C][C]0.026323[/C][C]0.2249[/C][C]0.411343[/C][/ROW]
[ROW][C]47[/C][C]0.107339[/C][C]0.9171[/C][C]0.181055[/C][/ROW]
[ROW][C]48[/C][C]0.002245[/C][C]0.0192[/C][C]0.492374[/C][/ROW]
[ROW][C]49[/C][C]-0.042786[/C][C]-0.3656[/C][C]0.357875[/C][/ROW]
[ROW][C]50[/C][C]-0.029204[/C][C]-0.2495[/C][C]0.401829[/C][/ROW]
[ROW][C]51[/C][C]-0.077783[/C][C]-0.6646[/C][C]0.254206[/C][/ROW]
[ROW][C]52[/C][C]-0.023203[/C][C]-0.1982[/C][C]0.421703[/C][/ROW]
[ROW][C]53[/C][C]0.010338[/C][C]0.0883[/C][C]0.464929[/C][/ROW]
[ROW][C]54[/C][C]0.008597[/C][C]0.0734[/C][C]0.470824[/C][/ROW]
[ROW][C]55[/C][C]-0.058414[/C][C]-0.4991[/C][C]0.309609[/C][/ROW]
[ROW][C]56[/C][C]-0.022567[/C][C]-0.1928[/C][C]0.42382[/C][/ROW]
[ROW][C]57[/C][C]-0.110374[/C][C]-0.943[/C][C]0.174387[/C][/ROW]
[ROW][C]58[/C][C]-0.021547[/C][C]-0.1841[/C][C]0.427223[/C][/ROW]
[ROW][C]59[/C][C]-0.059024[/C][C]-0.5043[/C][C]0.307785[/C][/ROW]
[ROW][C]60[/C][C]-0.058585[/C][C]-0.5005[/C][C]0.309098[/C][/ROW]
[/TABLE]
Source: https://freestatistics.org/blog/index.php?pk=31547&T=2

Globally Unique Identifier (entire table): ba.freestatistics.org/blog/index.php?pk=31547&T=2

As an alternative you can also use a QR Code:  

The GUIDs for individual cells are displayed in the table below:

Partial Autocorrelation Function
Time lag kPACF(k)T-STATP-value
10.2581952.2060.015265
2-0.21104-1.80310.037747
3-0.056866-0.48590.314259
40.1534231.31080.09701
5-0.110426-0.94350.174274
6-0.163234-1.39470.083672
70.1519031.29790.099211
8-0.098886-0.84490.200469
90.0294580.25170.400994
100.1235251.05540.147362
110.0236760.20230.420126
12-0.072889-0.62280.267689
130.0634340.5420.294742
14-0.006425-0.05490.478185
15-0.170327-1.45530.07494
16-0.060702-0.51860.302792
170.1718291.46810.073186
18-0.010297-0.0880.465066
190.1233351.05380.147731
20-0.006246-0.05340.478794
21-0.14076-1.20270.116498
22-0.058409-0.4990.309625
23-0.031407-0.26830.394596
24-0.087218-0.74520.229274
25-0.176483-1.50790.067952
260.038770.33120.370702
270.0253540.21660.414553
28-0.153957-1.31540.096244
290.0030120.02570.489771
30-0.055258-0.47210.319122
31-0.108438-0.92650.178622
32-0.098267-0.83960.201939
33-0.085526-0.73070.23364
340.0366410.31310.377562
35-0.044317-0.37860.353024
36-0.069975-0.59790.275891
37-0.108974-0.93110.177443
380.096460.82420.206268
39-0.118332-1.0110.15767
400.0030.02560.489811
410.0354340.30280.38147
420.0445590.38070.35226
43-0.048764-0.41660.339082
44-0.018856-0.16110.436228
450.0327040.27940.390356
460.0263230.22490.411343
470.1073390.91710.181055
480.0022450.01920.492374
49-0.042786-0.36560.357875
50-0.029204-0.24950.401829
51-0.077783-0.66460.254206
52-0.023203-0.19820.421703
530.0103380.08830.464929
540.0085970.07340.470824
55-0.058414-0.49910.309609
56-0.022567-0.19280.42382
57-0.110374-0.9430.174387
58-0.021547-0.18410.427223
59-0.059024-0.50430.307785
60-0.058585-0.50050.309098


Parameters (Session):
par1 = 60 ; par2 = 1 ; par3 = 1 ; par4 = 0 ; par5 = 12 ;
Parameters (R input):
par1 = 60 ; par2 = 1 ; par3 = 1 ; par4 = 0 ; par5 = 12 ;
R code (references can be found in the software module):
if (par1 == 'Default') {
par1 = 10*log10(length(x))
} else {
par1 <- as.numeric(par1)
}
par2 <- as.numeric(par2)
par3 <- as.numeric(par3)
par4 <- as.numeric(par4)
par5 <- as.numeric(par5)
if (par2 == 0) {
x <- log(x)
} else {
x <- (x ^ par2 - 1) / par2
}
if (par3 > 0) x <- diff(x,lag=1,difference=par3)
if (par4 > 0) x <- diff(x,lag=par5,difference=par4)
bitmap(file='pic1.png')
racf <- acf(x,par1,main='Autocorrelation',xlab='lags',ylab='ACF')
dev.off()
bitmap(file='pic2.png')
rpacf <- pacf(x,par1,main='Partial Autocorrelation',xlab='lags',ylab='PACF')
dev.off()
(myacf <- c(racf$acf))
(mypacf <- c(rpacf$acf))
lengthx <- length(x)
sqrtn <- sqrt(lengthx)
load(file='createtable')
a<-table.start()
a<-table.row.start(a)
a<-table.element(a,'Autocorrelation Function',4,TRUE)
a<-table.row.end(a)
a<-table.row.start(a)
a<-table.element(a,'Time lag k',header=TRUE)
a<-table.element(a,hyperlink('basics.htm','ACF(k)','click here for more information about the Autocorrelation Function'),header=TRUE)
a<-table.element(a,'T-STAT',header=TRUE)
a<-table.element(a,'P-value',header=TRUE)
a<-table.row.end(a)
for (i in 2:(par1+1)) {
a<-table.row.start(a)
a<-table.element(a,i-1,header=TRUE)
a<-table.element(a,round(myacf[i],6))
mytstat <- myacf[i]*sqrtn
a<-table.element(a,round(mytstat,4))
a<-table.element(a,round(1-pt(abs(mytstat),lengthx),6))
a<-table.row.end(a)
}
a<-table.end(a)
table.save(a,file='mytable.tab')
a<-table.start()
a<-table.row.start(a)
a<-table.element(a,'Partial Autocorrelation Function',4,TRUE)
a<-table.row.end(a)
a<-table.row.start(a)
a<-table.element(a,'Time lag k',header=TRUE)
a<-table.element(a,hyperlink('basics.htm','PACF(k)','click here for more information about the Partial Autocorrelation Function'),header=TRUE)
a<-table.element(a,'T-STAT',header=TRUE)
a<-table.element(a,'P-value',header=TRUE)
a<-table.row.end(a)
for (i in 1:par1) {
a<-table.row.start(a)
a<-table.element(a,i,header=TRUE)
a<-table.element(a,round(mypacf[i],6))
mytstat <- mypacf[i]*sqrtn
a<-table.element(a,round(mytstat,4))
a<-table.element(a,round(1-pt(abs(mytstat),lengthx),6))
a<-table.row.end(a)
}
a<-table.end(a)
table.save(a,file='mytable1.tab')