Free Statistics

of Irreproducible Research!

Author's title

Author*Unverified author*
R Software Modulerwasp_autocorrelation.wasp
Title produced by software(Partial) Autocorrelation Function
Date of computationTue, 09 Dec 2008 08:03:47 -0700
Cite this page as followsStatistical Computations at FreeStatistics.org, Office for Research Development and Education, URL https://freestatistics.org/blog/index.php?v=date/2008/Dec/09/t1228835064g7wp321h66ca9s2.htm/, Retrieved Sun, 19 May 2024 12:41:49 +0000
Statistical Computations at FreeStatistics.org, Office for Research Development and Education, URL https://freestatistics.org/blog/index.php?pk=31497, Retrieved Sun, 19 May 2024 12:41:49 +0000
QR Codes:

Original text written by user:
IsPrivate?No (this computation is public)
User-defined keywords
Estimated Impact150
Family? (F = Feedback message, R = changed R code, M = changed R Module, P = changed Parameters, D = changed Data)
F       [(Partial) Autocorrelation Function] [step3] [2008-12-09 15:03:47] [a413cf7744efd6bb212437a3916e2f23] [Current]
Feedback Forum
2008-12-14 13:28:16 [Gert-Jan Geudens] [reply
Niet correct, zoals reeds gevonden in stap 1, moet je lambda gelijkstellen aan 1 door de te hoge p-waarde. Als je dit doet, bekom je wel een stationaire reeks.
2008-12-14 13:33:56 [Gert-Jan Geudens] [reply
STEP 4 : We zijn het eens met de bevindingen van de student, al had hij hier nog wel het vermoedelijke model mogen opstellen.

Het model is : (1-hoofdletter phi1B12)nabla12yt = et
2008-12-14 13:40:29 [Gert-Jan Geudens] [reply
extra opmerking bij vorige feedback : Ook bij stap 4 moet je lambda gelijkstellen aan 1.
2008-12-14 13:58:01 [Gert-Jan Geudens] [reply
Correctie van onze vorige feedback : het vermoedelijke model is hier gelijk aan
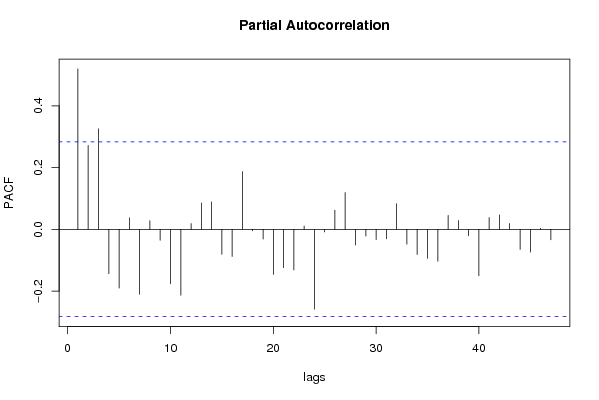
(1-phi1B-phi2B^2-phi3B^3)nabla12yt = et
2008-12-15 14:28:49 [Jonas Scheltjens] [reply
Step 3:De student heeft hier enkel de link en de grafiek gegeven zonder enige degelijke uitleg of verklaring. Aangezien het niet de taak is van de persoon die de assessments doet om deze taak voor de student te maken, verwijs ik dan ook voor de algemene en volledige uitleg voor deze Step naar Step 3 voor de unemployment data, dewelke ik zeer uitgebreid heb besproken en waar alle informatie in staat om deze vraag correct op te lossen.
2008-12-15 14:29:56 [Jonas Scheltjens] [reply
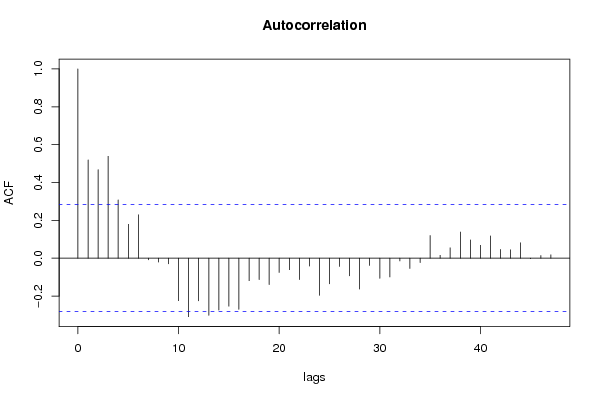
Step 4: De student bekomt tot de juiste conclusie dat er geen MA proces in de reeks zit. Ook valt er geen seizoenaal proces te bespeuren. Dit heeft de student ook juist.
Wel ontbreekt steeds een degelijke uitleg.
Voor de algemene en volledige uitleg voor deze Step verwijs ik ook naar Step 4 voor de unemployment data, dewelke ik zeer uitgebreid heb besproken en waar alle informatie in staat om deze vraag correct op te lossen.

Post a new message
Dataseries X:
1846.5
2796.3
2895.6
2472.2
2584.4
2630.4
2663.1
3176.2
2856.7
2551.4
3088.7
2628.3
2226.2
3023.6
3077.9
3084.1
2990.3
2949.6
3014.7
3517.7
3121.2
3067.4
3174.6
2676.3
2424
3195.1
3146.6
3506.7
3528.5
3365.1
3153
3843.3
3123.2
3361.1
3481.9
2970.5
2537
3257.6
3301.3
3391.6
2933.6
3283.2
3139.7
3486.4
3202.2
3294.4
3550.3
3279.3
2678.6
3451.4
3977.1
3814.8
3310.5
3971.8
4051.9
4057.6
4391.4
3628.9
4092.2
3822.5


Summary of computational transaction
Raw Inputview raw input (R code)
Raw Outputview raw output of R engine
Computing time1 seconds
R Server'George Udny Yule' @ 72.249.76.132

\begin{tabular}{lllllllll}
\hline
Summary of computational transaction \tabularnewline
Raw Input & view raw input (R code)  \tabularnewline
Raw Output & view raw output of R engine  \tabularnewline
Computing time & 1 seconds \tabularnewline
R Server & 'George Udny Yule' @ 72.249.76.132 \tabularnewline
\hline
\end{tabular}
%Source: https://freestatistics.org/blog/index.php?pk=31497&T=0

[TABLE]
[ROW][C]Summary of computational transaction[/C][/ROW]
[ROW][C]Raw Input[/C][C]view raw input (R code) [/C][/ROW]
[ROW][C]Raw Output[/C][C]view raw output of R engine [/C][/ROW]
[ROW][C]Computing time[/C][C]1 seconds[/C][/ROW]
[ROW][C]R Server[/C][C]'George Udny Yule' @ 72.249.76.132[/C][/ROW]
[/TABLE]
Source: https://freestatistics.org/blog/index.php?pk=31497&T=0

Globally Unique Identifier (entire table): ba.freestatistics.org/blog/index.php?pk=31497&T=0

As an alternative you can also use a QR Code:  

The GUIDs for individual cells are displayed in the table below:

Summary of computational transaction
Raw Inputview raw input (R code)
Raw Outputview raw output of R engine
Computing time1 seconds
R Server'George Udny Yule' @ 72.249.76.132


Autocorrelation Function
Time lag kACF(k)T-STATP-value
10.5191733.59690.000379
20.4678693.24150.001082
30.5380713.72790.000255
40.3074732.13020.019152
50.179151.24120.110284
60.2290241.58670.05957
7-0.008684-0.06020.476136
8-0.020604-0.14270.443543
9-0.02956-0.20480.419298
10-0.224969-1.55860.062827
11-0.30909-2.14140.018672
12-0.225078-1.55940.062737
13-0.301967-2.09210.020872
14-0.274126-1.89920.031778
15-0.253559-1.75670.042673
16-0.270458-1.87380.033527
17-0.118699-0.82240.207467
18-0.112915-0.78230.21894
19-0.139751-0.96820.168894
20-0.075397-0.52240.301908
21-0.061061-0.4230.337075
22-0.113385-0.78560.217994
23-0.041842-0.28990.386575
24-0.196497-1.36140.089876
25-0.135234-0.93690.176743
26-0.043441-0.3010.382371
27-0.09313-0.64520.260928
28-0.163365-1.13180.131665
29-0.038715-0.26820.394837
30-0.106768-0.73970.231539
31-0.099095-0.68650.247835
32-0.014981-0.10380.458883
33-0.054203-0.37550.35446
34-0.023022-0.15950.436973
350.119490.82790.205926
360.0151240.10480.458492
370.0544860.37750.353736
380.1380830.95670.171765
390.0964070.66790.25369
400.067950.47080.319967
410.1177280.81560.209366
420.0458570.31770.376044
430.0442880.30680.380148
440.0808850.56040.288911
45-0.002801-0.01940.4923
460.0136230.09440.4626
470.0177150.12270.451415
48NANANA
49NANANA
50NANANA
51NANANA
52NANANA
53NANANA
54NANANA
55NANANA
56NANANA
57NANANA
58NANANA
59NANANA
60NANANA

\begin{tabular}{lllllllll}
\hline
Autocorrelation Function \tabularnewline
Time lag k & ACF(k) & T-STAT & P-value \tabularnewline
1 & 0.519173 & 3.5969 & 0.000379 \tabularnewline
2 & 0.467869 & 3.2415 & 0.001082 \tabularnewline
3 & 0.538071 & 3.7279 & 0.000255 \tabularnewline
4 & 0.307473 & 2.1302 & 0.019152 \tabularnewline
5 & 0.17915 & 1.2412 & 0.110284 \tabularnewline
6 & 0.229024 & 1.5867 & 0.05957 \tabularnewline
7 & -0.008684 & -0.0602 & 0.476136 \tabularnewline
8 & -0.020604 & -0.1427 & 0.443543 \tabularnewline
9 & -0.02956 & -0.2048 & 0.419298 \tabularnewline
10 & -0.224969 & -1.5586 & 0.062827 \tabularnewline
11 & -0.30909 & -2.1414 & 0.018672 \tabularnewline
12 & -0.225078 & -1.5594 & 0.062737 \tabularnewline
13 & -0.301967 & -2.0921 & 0.020872 \tabularnewline
14 & -0.274126 & -1.8992 & 0.031778 \tabularnewline
15 & -0.253559 & -1.7567 & 0.042673 \tabularnewline
16 & -0.270458 & -1.8738 & 0.033527 \tabularnewline
17 & -0.118699 & -0.8224 & 0.207467 \tabularnewline
18 & -0.112915 & -0.7823 & 0.21894 \tabularnewline
19 & -0.139751 & -0.9682 & 0.168894 \tabularnewline
20 & -0.075397 & -0.5224 & 0.301908 \tabularnewline
21 & -0.061061 & -0.423 & 0.337075 \tabularnewline
22 & -0.113385 & -0.7856 & 0.217994 \tabularnewline
23 & -0.041842 & -0.2899 & 0.386575 \tabularnewline
24 & -0.196497 & -1.3614 & 0.089876 \tabularnewline
25 & -0.135234 & -0.9369 & 0.176743 \tabularnewline
26 & -0.043441 & -0.301 & 0.382371 \tabularnewline
27 & -0.09313 & -0.6452 & 0.260928 \tabularnewline
28 & -0.163365 & -1.1318 & 0.131665 \tabularnewline
29 & -0.038715 & -0.2682 & 0.394837 \tabularnewline
30 & -0.106768 & -0.7397 & 0.231539 \tabularnewline
31 & -0.099095 & -0.6865 & 0.247835 \tabularnewline
32 & -0.014981 & -0.1038 & 0.458883 \tabularnewline
33 & -0.054203 & -0.3755 & 0.35446 \tabularnewline
34 & -0.023022 & -0.1595 & 0.436973 \tabularnewline
35 & 0.11949 & 0.8279 & 0.205926 \tabularnewline
36 & 0.015124 & 0.1048 & 0.458492 \tabularnewline
37 & 0.054486 & 0.3775 & 0.353736 \tabularnewline
38 & 0.138083 & 0.9567 & 0.171765 \tabularnewline
39 & 0.096407 & 0.6679 & 0.25369 \tabularnewline
40 & 0.06795 & 0.4708 & 0.319967 \tabularnewline
41 & 0.117728 & 0.8156 & 0.209366 \tabularnewline
42 & 0.045857 & 0.3177 & 0.376044 \tabularnewline
43 & 0.044288 & 0.3068 & 0.380148 \tabularnewline
44 & 0.080885 & 0.5604 & 0.288911 \tabularnewline
45 & -0.002801 & -0.0194 & 0.4923 \tabularnewline
46 & 0.013623 & 0.0944 & 0.4626 \tabularnewline
47 & 0.017715 & 0.1227 & 0.451415 \tabularnewline
48 & NA & NA & NA \tabularnewline
49 & NA & NA & NA \tabularnewline
50 & NA & NA & NA \tabularnewline
51 & NA & NA & NA \tabularnewline
52 & NA & NA & NA \tabularnewline
53 & NA & NA & NA \tabularnewline
54 & NA & NA & NA \tabularnewline
55 & NA & NA & NA \tabularnewline
56 & NA & NA & NA \tabularnewline
57 & NA & NA & NA \tabularnewline
58 & NA & NA & NA \tabularnewline
59 & NA & NA & NA \tabularnewline
60 & NA & NA & NA \tabularnewline
\hline
\end{tabular}
%Source: https://freestatistics.org/blog/index.php?pk=31497&T=1

[TABLE]
[ROW][C]Autocorrelation Function[/C][/ROW]
[ROW][C]Time lag k[/C][C]ACF(k)[/C][C]T-STAT[/C][C]P-value[/C][/ROW]
[ROW][C]1[/C][C]0.519173[/C][C]3.5969[/C][C]0.000379[/C][/ROW]
[ROW][C]2[/C][C]0.467869[/C][C]3.2415[/C][C]0.001082[/C][/ROW]
[ROW][C]3[/C][C]0.538071[/C][C]3.7279[/C][C]0.000255[/C][/ROW]
[ROW][C]4[/C][C]0.307473[/C][C]2.1302[/C][C]0.019152[/C][/ROW]
[ROW][C]5[/C][C]0.17915[/C][C]1.2412[/C][C]0.110284[/C][/ROW]
[ROW][C]6[/C][C]0.229024[/C][C]1.5867[/C][C]0.05957[/C][/ROW]
[ROW][C]7[/C][C]-0.008684[/C][C]-0.0602[/C][C]0.476136[/C][/ROW]
[ROW][C]8[/C][C]-0.020604[/C][C]-0.1427[/C][C]0.443543[/C][/ROW]
[ROW][C]9[/C][C]-0.02956[/C][C]-0.2048[/C][C]0.419298[/C][/ROW]
[ROW][C]10[/C][C]-0.224969[/C][C]-1.5586[/C][C]0.062827[/C][/ROW]
[ROW][C]11[/C][C]-0.30909[/C][C]-2.1414[/C][C]0.018672[/C][/ROW]
[ROW][C]12[/C][C]-0.225078[/C][C]-1.5594[/C][C]0.062737[/C][/ROW]
[ROW][C]13[/C][C]-0.301967[/C][C]-2.0921[/C][C]0.020872[/C][/ROW]
[ROW][C]14[/C][C]-0.274126[/C][C]-1.8992[/C][C]0.031778[/C][/ROW]
[ROW][C]15[/C][C]-0.253559[/C][C]-1.7567[/C][C]0.042673[/C][/ROW]
[ROW][C]16[/C][C]-0.270458[/C][C]-1.8738[/C][C]0.033527[/C][/ROW]
[ROW][C]17[/C][C]-0.118699[/C][C]-0.8224[/C][C]0.207467[/C][/ROW]
[ROW][C]18[/C][C]-0.112915[/C][C]-0.7823[/C][C]0.21894[/C][/ROW]
[ROW][C]19[/C][C]-0.139751[/C][C]-0.9682[/C][C]0.168894[/C][/ROW]
[ROW][C]20[/C][C]-0.075397[/C][C]-0.5224[/C][C]0.301908[/C][/ROW]
[ROW][C]21[/C][C]-0.061061[/C][C]-0.423[/C][C]0.337075[/C][/ROW]
[ROW][C]22[/C][C]-0.113385[/C][C]-0.7856[/C][C]0.217994[/C][/ROW]
[ROW][C]23[/C][C]-0.041842[/C][C]-0.2899[/C][C]0.386575[/C][/ROW]
[ROW][C]24[/C][C]-0.196497[/C][C]-1.3614[/C][C]0.089876[/C][/ROW]
[ROW][C]25[/C][C]-0.135234[/C][C]-0.9369[/C][C]0.176743[/C][/ROW]
[ROW][C]26[/C][C]-0.043441[/C][C]-0.301[/C][C]0.382371[/C][/ROW]
[ROW][C]27[/C][C]-0.09313[/C][C]-0.6452[/C][C]0.260928[/C][/ROW]
[ROW][C]28[/C][C]-0.163365[/C][C]-1.1318[/C][C]0.131665[/C][/ROW]
[ROW][C]29[/C][C]-0.038715[/C][C]-0.2682[/C][C]0.394837[/C][/ROW]
[ROW][C]30[/C][C]-0.106768[/C][C]-0.7397[/C][C]0.231539[/C][/ROW]
[ROW][C]31[/C][C]-0.099095[/C][C]-0.6865[/C][C]0.247835[/C][/ROW]
[ROW][C]32[/C][C]-0.014981[/C][C]-0.1038[/C][C]0.458883[/C][/ROW]
[ROW][C]33[/C][C]-0.054203[/C][C]-0.3755[/C][C]0.35446[/C][/ROW]
[ROW][C]34[/C][C]-0.023022[/C][C]-0.1595[/C][C]0.436973[/C][/ROW]
[ROW][C]35[/C][C]0.11949[/C][C]0.8279[/C][C]0.205926[/C][/ROW]
[ROW][C]36[/C][C]0.015124[/C][C]0.1048[/C][C]0.458492[/C][/ROW]
[ROW][C]37[/C][C]0.054486[/C][C]0.3775[/C][C]0.353736[/C][/ROW]
[ROW][C]38[/C][C]0.138083[/C][C]0.9567[/C][C]0.171765[/C][/ROW]
[ROW][C]39[/C][C]0.096407[/C][C]0.6679[/C][C]0.25369[/C][/ROW]
[ROW][C]40[/C][C]0.06795[/C][C]0.4708[/C][C]0.319967[/C][/ROW]
[ROW][C]41[/C][C]0.117728[/C][C]0.8156[/C][C]0.209366[/C][/ROW]
[ROW][C]42[/C][C]0.045857[/C][C]0.3177[/C][C]0.376044[/C][/ROW]
[ROW][C]43[/C][C]0.044288[/C][C]0.3068[/C][C]0.380148[/C][/ROW]
[ROW][C]44[/C][C]0.080885[/C][C]0.5604[/C][C]0.288911[/C][/ROW]
[ROW][C]45[/C][C]-0.002801[/C][C]-0.0194[/C][C]0.4923[/C][/ROW]
[ROW][C]46[/C][C]0.013623[/C][C]0.0944[/C][C]0.4626[/C][/ROW]
[ROW][C]47[/C][C]0.017715[/C][C]0.1227[/C][C]0.451415[/C][/ROW]
[ROW][C]48[/C][C]NA[/C][C]NA[/C][C]NA[/C][/ROW]
[ROW][C]49[/C][C]NA[/C][C]NA[/C][C]NA[/C][/ROW]
[ROW][C]50[/C][C]NA[/C][C]NA[/C][C]NA[/C][/ROW]
[ROW][C]51[/C][C]NA[/C][C]NA[/C][C]NA[/C][/ROW]
[ROW][C]52[/C][C]NA[/C][C]NA[/C][C]NA[/C][/ROW]
[ROW][C]53[/C][C]NA[/C][C]NA[/C][C]NA[/C][/ROW]
[ROW][C]54[/C][C]NA[/C][C]NA[/C][C]NA[/C][/ROW]
[ROW][C]55[/C][C]NA[/C][C]NA[/C][C]NA[/C][/ROW]
[ROW][C]56[/C][C]NA[/C][C]NA[/C][C]NA[/C][/ROW]
[ROW][C]57[/C][C]NA[/C][C]NA[/C][C]NA[/C][/ROW]
[ROW][C]58[/C][C]NA[/C][C]NA[/C][C]NA[/C][/ROW]
[ROW][C]59[/C][C]NA[/C][C]NA[/C][C]NA[/C][/ROW]
[ROW][C]60[/C][C]NA[/C][C]NA[/C][C]NA[/C][/ROW]
[/TABLE]
Source: https://freestatistics.org/blog/index.php?pk=31497&T=1

Globally Unique Identifier (entire table): ba.freestatistics.org/blog/index.php?pk=31497&T=1

As an alternative you can also use a QR Code:  

The GUIDs for individual cells are displayed in the table below:

Autocorrelation Function
Time lag kACF(k)T-STATP-value
10.5191733.59690.000379
20.4678693.24150.001082
30.5380713.72790.000255
40.3074732.13020.019152
50.179151.24120.110284
60.2290241.58670.05957
7-0.008684-0.06020.476136
8-0.020604-0.14270.443543
9-0.02956-0.20480.419298
10-0.224969-1.55860.062827
11-0.30909-2.14140.018672
12-0.225078-1.55940.062737
13-0.301967-2.09210.020872
14-0.274126-1.89920.031778
15-0.253559-1.75670.042673
16-0.270458-1.87380.033527
17-0.118699-0.82240.207467
18-0.112915-0.78230.21894
19-0.139751-0.96820.168894
20-0.075397-0.52240.301908
21-0.061061-0.4230.337075
22-0.113385-0.78560.217994
23-0.041842-0.28990.386575
24-0.196497-1.36140.089876
25-0.135234-0.93690.176743
26-0.043441-0.3010.382371
27-0.09313-0.64520.260928
28-0.163365-1.13180.131665
29-0.038715-0.26820.394837
30-0.106768-0.73970.231539
31-0.099095-0.68650.247835
32-0.014981-0.10380.458883
33-0.054203-0.37550.35446
34-0.023022-0.15950.436973
350.119490.82790.205926
360.0151240.10480.458492
370.0544860.37750.353736
380.1380830.95670.171765
390.0964070.66790.25369
400.067950.47080.319967
410.1177280.81560.209366
420.0458570.31770.376044
430.0442880.30680.380148
440.0808850.56040.288911
45-0.002801-0.01940.4923
460.0136230.09440.4626
470.0177150.12270.451415
48NANANA
49NANANA
50NANANA
51NANANA
52NANANA
53NANANA
54NANANA
55NANANA
56NANANA
57NANANA
58NANANA
59NANANA
60NANANA


Partial Autocorrelation Function
Time lag kPACF(k)T-STATP-value
10.5191733.59690.000379
20.2715121.88110.033017
30.325382.25430.014389
4-0.143608-0.99490.162377
5-0.190456-1.31950.096627
60.0370130.25640.399355
7-0.210496-1.45840.075627
80.0276680.19170.424397
9-0.035773-0.24780.402658
10-0.176541-1.22310.113629
11-0.213529-1.47940.072787
120.0186790.12940.448787
130.0848710.5880.279643
140.0884490.61280.271453
15-0.080908-0.56050.288857
16-0.088104-0.61040.272237
170.1871091.29630.10053
18-0.004906-0.0340.486514
19-0.031694-0.21960.413565
20-0.146062-1.01190.158319
21-0.124276-0.8610.196757
22-0.131776-0.9130.18291
230.0104460.07240.471302
24-0.258911-1.79380.039574
25-0.008534-0.05910.47655
260.0618260.42830.335157
270.1190050.82450.20687
28-0.050636-0.35080.363632
29-0.021907-0.15180.44
30-0.033222-0.23020.409469
31-0.031042-0.21510.415314
320.082950.57470.28409
33-0.048321-0.33480.369625
34-0.082023-0.56830.286249
35-0.09434-0.65360.258242
36-0.10326-0.71540.238913
370.0448560.31080.378661
380.0283630.19650.422523
39-0.021052-0.14590.442324
40-0.150537-1.04290.151098
410.0379470.26290.396874
420.0463360.3210.374793
430.0191270.13250.447565
44-0.06523-0.45190.326678
45-0.073898-0.5120.305505
460.0032150.02230.491162
47-0.034118-0.23640.407072
48NANANA
49NANANA
50NANANA
51NANANA
52NANANA
53NANANA
54NANANA
55NANANA
56NANANA
57NANANA
58NANANA
59NANANA
60NANANA

\begin{tabular}{lllllllll}
\hline
Partial Autocorrelation Function \tabularnewline
Time lag k & PACF(k) & T-STAT & P-value \tabularnewline
1 & 0.519173 & 3.5969 & 0.000379 \tabularnewline
2 & 0.271512 & 1.8811 & 0.033017 \tabularnewline
3 & 0.32538 & 2.2543 & 0.014389 \tabularnewline
4 & -0.143608 & -0.9949 & 0.162377 \tabularnewline
5 & -0.190456 & -1.3195 & 0.096627 \tabularnewline
6 & 0.037013 & 0.2564 & 0.399355 \tabularnewline
7 & -0.210496 & -1.4584 & 0.075627 \tabularnewline
8 & 0.027668 & 0.1917 & 0.424397 \tabularnewline
9 & -0.035773 & -0.2478 & 0.402658 \tabularnewline
10 & -0.176541 & -1.2231 & 0.113629 \tabularnewline
11 & -0.213529 & -1.4794 & 0.072787 \tabularnewline
12 & 0.018679 & 0.1294 & 0.448787 \tabularnewline
13 & 0.084871 & 0.588 & 0.279643 \tabularnewline
14 & 0.088449 & 0.6128 & 0.271453 \tabularnewline
15 & -0.080908 & -0.5605 & 0.288857 \tabularnewline
16 & -0.088104 & -0.6104 & 0.272237 \tabularnewline
17 & 0.187109 & 1.2963 & 0.10053 \tabularnewline
18 & -0.004906 & -0.034 & 0.486514 \tabularnewline
19 & -0.031694 & -0.2196 & 0.413565 \tabularnewline
20 & -0.146062 & -1.0119 & 0.158319 \tabularnewline
21 & -0.124276 & -0.861 & 0.196757 \tabularnewline
22 & -0.131776 & -0.913 & 0.18291 \tabularnewline
23 & 0.010446 & 0.0724 & 0.471302 \tabularnewline
24 & -0.258911 & -1.7938 & 0.039574 \tabularnewline
25 & -0.008534 & -0.0591 & 0.47655 \tabularnewline
26 & 0.061826 & 0.4283 & 0.335157 \tabularnewline
27 & 0.119005 & 0.8245 & 0.20687 \tabularnewline
28 & -0.050636 & -0.3508 & 0.363632 \tabularnewline
29 & -0.021907 & -0.1518 & 0.44 \tabularnewline
30 & -0.033222 & -0.2302 & 0.409469 \tabularnewline
31 & -0.031042 & -0.2151 & 0.415314 \tabularnewline
32 & 0.08295 & 0.5747 & 0.28409 \tabularnewline
33 & -0.048321 & -0.3348 & 0.369625 \tabularnewline
34 & -0.082023 & -0.5683 & 0.286249 \tabularnewline
35 & -0.09434 & -0.6536 & 0.258242 \tabularnewline
36 & -0.10326 & -0.7154 & 0.238913 \tabularnewline
37 & 0.044856 & 0.3108 & 0.378661 \tabularnewline
38 & 0.028363 & 0.1965 & 0.422523 \tabularnewline
39 & -0.021052 & -0.1459 & 0.442324 \tabularnewline
40 & -0.150537 & -1.0429 & 0.151098 \tabularnewline
41 & 0.037947 & 0.2629 & 0.396874 \tabularnewline
42 & 0.046336 & 0.321 & 0.374793 \tabularnewline
43 & 0.019127 & 0.1325 & 0.447565 \tabularnewline
44 & -0.06523 & -0.4519 & 0.326678 \tabularnewline
45 & -0.073898 & -0.512 & 0.305505 \tabularnewline
46 & 0.003215 & 0.0223 & 0.491162 \tabularnewline
47 & -0.034118 & -0.2364 & 0.407072 \tabularnewline
48 & NA & NA & NA \tabularnewline
49 & NA & NA & NA \tabularnewline
50 & NA & NA & NA \tabularnewline
51 & NA & NA & NA \tabularnewline
52 & NA & NA & NA \tabularnewline
53 & NA & NA & NA \tabularnewline
54 & NA & NA & NA \tabularnewline
55 & NA & NA & NA \tabularnewline
56 & NA & NA & NA \tabularnewline
57 & NA & NA & NA \tabularnewline
58 & NA & NA & NA \tabularnewline
59 & NA & NA & NA \tabularnewline
60 & NA & NA & NA \tabularnewline
\hline
\end{tabular}
%Source: https://freestatistics.org/blog/index.php?pk=31497&T=2

[TABLE]
[ROW][C]Partial Autocorrelation Function[/C][/ROW]
[ROW][C]Time lag k[/C][C]PACF(k)[/C][C]T-STAT[/C][C]P-value[/C][/ROW]
[ROW][C]1[/C][C]0.519173[/C][C]3.5969[/C][C]0.000379[/C][/ROW]
[ROW][C]2[/C][C]0.271512[/C][C]1.8811[/C][C]0.033017[/C][/ROW]
[ROW][C]3[/C][C]0.32538[/C][C]2.2543[/C][C]0.014389[/C][/ROW]
[ROW][C]4[/C][C]-0.143608[/C][C]-0.9949[/C][C]0.162377[/C][/ROW]
[ROW][C]5[/C][C]-0.190456[/C][C]-1.3195[/C][C]0.096627[/C][/ROW]
[ROW][C]6[/C][C]0.037013[/C][C]0.2564[/C][C]0.399355[/C][/ROW]
[ROW][C]7[/C][C]-0.210496[/C][C]-1.4584[/C][C]0.075627[/C][/ROW]
[ROW][C]8[/C][C]0.027668[/C][C]0.1917[/C][C]0.424397[/C][/ROW]
[ROW][C]9[/C][C]-0.035773[/C][C]-0.2478[/C][C]0.402658[/C][/ROW]
[ROW][C]10[/C][C]-0.176541[/C][C]-1.2231[/C][C]0.113629[/C][/ROW]
[ROW][C]11[/C][C]-0.213529[/C][C]-1.4794[/C][C]0.072787[/C][/ROW]
[ROW][C]12[/C][C]0.018679[/C][C]0.1294[/C][C]0.448787[/C][/ROW]
[ROW][C]13[/C][C]0.084871[/C][C]0.588[/C][C]0.279643[/C][/ROW]
[ROW][C]14[/C][C]0.088449[/C][C]0.6128[/C][C]0.271453[/C][/ROW]
[ROW][C]15[/C][C]-0.080908[/C][C]-0.5605[/C][C]0.288857[/C][/ROW]
[ROW][C]16[/C][C]-0.088104[/C][C]-0.6104[/C][C]0.272237[/C][/ROW]
[ROW][C]17[/C][C]0.187109[/C][C]1.2963[/C][C]0.10053[/C][/ROW]
[ROW][C]18[/C][C]-0.004906[/C][C]-0.034[/C][C]0.486514[/C][/ROW]
[ROW][C]19[/C][C]-0.031694[/C][C]-0.2196[/C][C]0.413565[/C][/ROW]
[ROW][C]20[/C][C]-0.146062[/C][C]-1.0119[/C][C]0.158319[/C][/ROW]
[ROW][C]21[/C][C]-0.124276[/C][C]-0.861[/C][C]0.196757[/C][/ROW]
[ROW][C]22[/C][C]-0.131776[/C][C]-0.913[/C][C]0.18291[/C][/ROW]
[ROW][C]23[/C][C]0.010446[/C][C]0.0724[/C][C]0.471302[/C][/ROW]
[ROW][C]24[/C][C]-0.258911[/C][C]-1.7938[/C][C]0.039574[/C][/ROW]
[ROW][C]25[/C][C]-0.008534[/C][C]-0.0591[/C][C]0.47655[/C][/ROW]
[ROW][C]26[/C][C]0.061826[/C][C]0.4283[/C][C]0.335157[/C][/ROW]
[ROW][C]27[/C][C]0.119005[/C][C]0.8245[/C][C]0.20687[/C][/ROW]
[ROW][C]28[/C][C]-0.050636[/C][C]-0.3508[/C][C]0.363632[/C][/ROW]
[ROW][C]29[/C][C]-0.021907[/C][C]-0.1518[/C][C]0.44[/C][/ROW]
[ROW][C]30[/C][C]-0.033222[/C][C]-0.2302[/C][C]0.409469[/C][/ROW]
[ROW][C]31[/C][C]-0.031042[/C][C]-0.2151[/C][C]0.415314[/C][/ROW]
[ROW][C]32[/C][C]0.08295[/C][C]0.5747[/C][C]0.28409[/C][/ROW]
[ROW][C]33[/C][C]-0.048321[/C][C]-0.3348[/C][C]0.369625[/C][/ROW]
[ROW][C]34[/C][C]-0.082023[/C][C]-0.5683[/C][C]0.286249[/C][/ROW]
[ROW][C]35[/C][C]-0.09434[/C][C]-0.6536[/C][C]0.258242[/C][/ROW]
[ROW][C]36[/C][C]-0.10326[/C][C]-0.7154[/C][C]0.238913[/C][/ROW]
[ROW][C]37[/C][C]0.044856[/C][C]0.3108[/C][C]0.378661[/C][/ROW]
[ROW][C]38[/C][C]0.028363[/C][C]0.1965[/C][C]0.422523[/C][/ROW]
[ROW][C]39[/C][C]-0.021052[/C][C]-0.1459[/C][C]0.442324[/C][/ROW]
[ROW][C]40[/C][C]-0.150537[/C][C]-1.0429[/C][C]0.151098[/C][/ROW]
[ROW][C]41[/C][C]0.037947[/C][C]0.2629[/C][C]0.396874[/C][/ROW]
[ROW][C]42[/C][C]0.046336[/C][C]0.321[/C][C]0.374793[/C][/ROW]
[ROW][C]43[/C][C]0.019127[/C][C]0.1325[/C][C]0.447565[/C][/ROW]
[ROW][C]44[/C][C]-0.06523[/C][C]-0.4519[/C][C]0.326678[/C][/ROW]
[ROW][C]45[/C][C]-0.073898[/C][C]-0.512[/C][C]0.305505[/C][/ROW]
[ROW][C]46[/C][C]0.003215[/C][C]0.0223[/C][C]0.491162[/C][/ROW]
[ROW][C]47[/C][C]-0.034118[/C][C]-0.2364[/C][C]0.407072[/C][/ROW]
[ROW][C]48[/C][C]NA[/C][C]NA[/C][C]NA[/C][/ROW]
[ROW][C]49[/C][C]NA[/C][C]NA[/C][C]NA[/C][/ROW]
[ROW][C]50[/C][C]NA[/C][C]NA[/C][C]NA[/C][/ROW]
[ROW][C]51[/C][C]NA[/C][C]NA[/C][C]NA[/C][/ROW]
[ROW][C]52[/C][C]NA[/C][C]NA[/C][C]NA[/C][/ROW]
[ROW][C]53[/C][C]NA[/C][C]NA[/C][C]NA[/C][/ROW]
[ROW][C]54[/C][C]NA[/C][C]NA[/C][C]NA[/C][/ROW]
[ROW][C]55[/C][C]NA[/C][C]NA[/C][C]NA[/C][/ROW]
[ROW][C]56[/C][C]NA[/C][C]NA[/C][C]NA[/C][/ROW]
[ROW][C]57[/C][C]NA[/C][C]NA[/C][C]NA[/C][/ROW]
[ROW][C]58[/C][C]NA[/C][C]NA[/C][C]NA[/C][/ROW]
[ROW][C]59[/C][C]NA[/C][C]NA[/C][C]NA[/C][/ROW]
[ROW][C]60[/C][C]NA[/C][C]NA[/C][C]NA[/C][/ROW]
[/TABLE]
Source: https://freestatistics.org/blog/index.php?pk=31497&T=2

Globally Unique Identifier (entire table): ba.freestatistics.org/blog/index.php?pk=31497&T=2

As an alternative you can also use a QR Code:  

The GUIDs for individual cells are displayed in the table below:

Partial Autocorrelation Function
Time lag kPACF(k)T-STATP-value
10.5191733.59690.000379
20.2715121.88110.033017
30.325382.25430.014389
4-0.143608-0.99490.162377
5-0.190456-1.31950.096627
60.0370130.25640.399355
7-0.210496-1.45840.075627
80.0276680.19170.424397
9-0.035773-0.24780.402658
10-0.176541-1.22310.113629
11-0.213529-1.47940.072787
120.0186790.12940.448787
130.0848710.5880.279643
140.0884490.61280.271453
15-0.080908-0.56050.288857
16-0.088104-0.61040.272237
170.1871091.29630.10053
18-0.004906-0.0340.486514
19-0.031694-0.21960.413565
20-0.146062-1.01190.158319
21-0.124276-0.8610.196757
22-0.131776-0.9130.18291
230.0104460.07240.471302
24-0.258911-1.79380.039574
25-0.008534-0.05910.47655
260.0618260.42830.335157
270.1190050.82450.20687
28-0.050636-0.35080.363632
29-0.021907-0.15180.44
30-0.033222-0.23020.409469
31-0.031042-0.21510.415314
320.082950.57470.28409
33-0.048321-0.33480.369625
34-0.082023-0.56830.286249
35-0.09434-0.65360.258242
36-0.10326-0.71540.238913
370.0448560.31080.378661
380.0283630.19650.422523
39-0.021052-0.14590.442324
40-0.150537-1.04290.151098
410.0379470.26290.396874
420.0463360.3210.374793
430.0191270.13250.447565
44-0.06523-0.45190.326678
45-0.073898-0.5120.305505
460.0032150.02230.491162
47-0.034118-0.23640.407072
48NANANA
49NANANA
50NANANA
51NANANA
52NANANA
53NANANA
54NANANA
55NANANA
56NANANA
57NANANA
58NANANA
59NANANA
60NANANA


Parameters (Session):
par1 = 60 ; par2 = 0.1 ; par3 = 0 ; par4 = 1 ; par5 = 12 ;
Parameters (R input):
par1 = 60 ; par2 = 0.1 ; par3 = 0 ; par4 = 1 ; par5 = 12 ;
R code (references can be found in the software module):
if (par1 == 'Default') {
par1 = 10*log10(length(x))
} else {
par1 <- as.numeric(par1)
}
par2 <- as.numeric(par2)
par3 <- as.numeric(par3)
par4 <- as.numeric(par4)
par5 <- as.numeric(par5)
if (par2 == 0) {
x <- log(x)
} else {
x <- (x ^ par2 - 1) / par2
}
if (par3 > 0) x <- diff(x,lag=1,difference=par3)
if (par4 > 0) x <- diff(x,lag=par5,difference=par4)
bitmap(file='pic1.png')
racf <- acf(x,par1,main='Autocorrelation',xlab='lags',ylab='ACF')
dev.off()
bitmap(file='pic2.png')
rpacf <- pacf(x,par1,main='Partial Autocorrelation',xlab='lags',ylab='PACF')
dev.off()
(myacf <- c(racf$acf))
(mypacf <- c(rpacf$acf))
lengthx <- length(x)
sqrtn <- sqrt(lengthx)
load(file='createtable')
a<-table.start()
a<-table.row.start(a)
a<-table.element(a,'Autocorrelation Function',4,TRUE)
a<-table.row.end(a)
a<-table.row.start(a)
a<-table.element(a,'Time lag k',header=TRUE)
a<-table.element(a,hyperlink('basics.htm','ACF(k)','click here for more information about the Autocorrelation Function'),header=TRUE)
a<-table.element(a,'T-STAT',header=TRUE)
a<-table.element(a,'P-value',header=TRUE)
a<-table.row.end(a)
for (i in 2:(par1+1)) {
a<-table.row.start(a)
a<-table.element(a,i-1,header=TRUE)
a<-table.element(a,round(myacf[i],6))
mytstat <- myacf[i]*sqrtn
a<-table.element(a,round(mytstat,4))
a<-table.element(a,round(1-pt(abs(mytstat),lengthx),6))
a<-table.row.end(a)
}
a<-table.end(a)
table.save(a,file='mytable.tab')
a<-table.start()
a<-table.row.start(a)
a<-table.element(a,'Partial Autocorrelation Function',4,TRUE)
a<-table.row.end(a)
a<-table.row.start(a)
a<-table.element(a,'Time lag k',header=TRUE)
a<-table.element(a,hyperlink('basics.htm','PACF(k)','click here for more information about the Partial Autocorrelation Function'),header=TRUE)
a<-table.element(a,'T-STAT',header=TRUE)
a<-table.element(a,'P-value',header=TRUE)
a<-table.row.end(a)
for (i in 1:par1) {
a<-table.row.start(a)
a<-table.element(a,i,header=TRUE)
a<-table.element(a,round(mypacf[i],6))
mytstat <- mypacf[i]*sqrtn
a<-table.element(a,round(mytstat,4))
a<-table.element(a,round(1-pt(abs(mytstat),lengthx),6))
a<-table.row.end(a)
}
a<-table.end(a)
table.save(a,file='mytable1.tab')